
 Check sheet
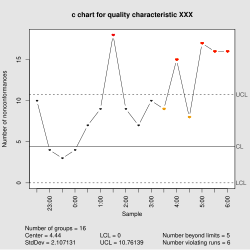 Control chart
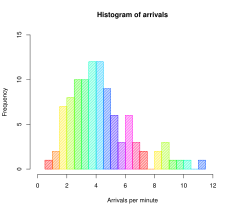 Histogram
 Scatter diagram
 Flow chart
 Run chart


The seven basic tools of quality are a fixed set of visual exercises identified as being most helpful in troubleshooting issues related to quality. [1] They are called basic because they are suitable for people with little formal training in statistics and because they can be used to solve the vast majority of quality-related issues. [2]
The seven tools are: [3] [4] [5]
The designation arose in postwar Japan, inspired by the seven famous weapons of Benkei. [6] It was possibly introduced by Kaoru Ishikawa who in turn was influenced by a series of lectures W. Edwards Deming had given to Japanese engineers and scientists in 1950. [7] At that time, companies that had set about training their workforces in statistical quality control found that the complexity of the subject intimidated most of their workers and scaled back training to focus primarily on simpler methods which suffice for most quality-related issues. [8] The Project Management Institute references the seven basic tools in A Guide to the Project Management Body of Knowledge as an example of a set of general tools useful for planning or controlling project quality. [9]
The seven basic tools stand in contrast to more advanced statistical methods such as survey sampling, acceptance sampling, statistical hypothesis testing, design of experiments, multivariate analysis, and various methods developed in the field of operations research. [10]