The Cauchy distribution, named after Augustin Cauchy, is a continuous probability distribution. It is also known, especially among physicists, as the Lorentz distribution, Cauchy–Lorentz distribution, Lorentz(ian) function, or Breit–Wigner distribution. The Cauchy distribution is the distribution of the x-intercept of a ray issuing from with a uniformly distributed angle. It is also the distribution of the ratio of two independent normally distributed random variables with mean zero.
In probability theory and statistics, kurtosis is a measure of the "tailedness" of the probability distribution of a real-valued random variable. Like skewness, kurtosis describes a particular aspect of a probability distribution. There are different ways to quantify kurtosis for a theoretical distribution, and there are corresponding ways of estimating it using a sample from a population. Different measures of kurtosis may have different interpretations.

In probability theory and statistics, skewness is a measure of the asymmetry of the probability distribution of a real-valued random variable about its mean. The skewness value can be positive, zero, negative, or undefined.

In probability theory and statistics, the Weibull distribution is a continuous probability distribution. It models a broad range of random variables, largely in the nature of a time to failure or time between events. Examples are maximum one-day rainfalls and the time a user spends on a web page.

In probability theory and statistics, the beta distribution is a family of continuous probability distributions defined on the interval [0, 1] or in terms of two positive parameters, denoted by alpha (α) and beta (β), that appear as exponents of the variable and its complement to 1, respectively, and control the shape of the distribution.

In probability theory and statistics, the gamma distribution is a two-parameter family of continuous probability distributions. The exponential distribution, Erlang distribution, and chi-squared distribution are special cases of the gamma distribution. There are two equivalent parameterizations in common use:
- With a shape parameter and a scale parameter .
- With a shape parameter and an inverse scale parameter , called a rate parameter.
In mathematics, the moments of a function are certain quantitative measures related to the shape of the function's graph. If the function represents mass density, then the zeroth moment is the total mass, the first moment is the center of mass, and the second moment is the moment of inertia. If the function is a probability distribution, then the first moment is the expected value, the second central moment is the variance, the third standardized moment is the skewness, and the fourth standardized moment is the kurtosis. The mathematical concept is closely related to the concept of moment in physics.
In probability theory and statistics, the logistic distribution is a continuous probability distribution. Its cumulative distribution function is the logistic function, which appears in logistic regression and feedforward neural networks. It resembles the normal distribution in shape but has heavier tails. The logistic distribution is a special case of the Tukey lambda distribution.
In probability theory and statistics, a scale parameter is a special kind of numerical parameter of a parametric family of probability distributions. The larger the scale parameter, the more spread out the distribution.

In probability and statistics, the Yule–Simon distribution is a discrete probability distribution named after Udny Yule and Herbert A. Simon. Simon originally called it the Yule distribution.
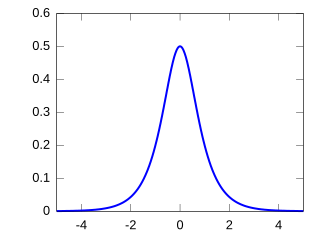
In probability theory and statistics, the hyperbolic secant distribution is a continuous probability distribution whose probability density function and characteristic function are proportional to the hyperbolic secant function. The hyperbolic secant function is equivalent to the reciprocal hyperbolic cosine, and thus this distribution is also called the inverse-cosh distribution.
The normal-inverse Gaussian distribution is a continuous probability distribution that is defined as the normal variance-mean mixture where the mixing density is the inverse Gaussian distribution. The NIG distribution was noted by Blaesild in 1977 as a subclass of the generalised hyperbolic distribution discovered by Ole Barndorff-Nielsen. In the next year Barndorff-Nielsen published the NIG in another paper. It was introduced in the mathematical finance literature in 1997.

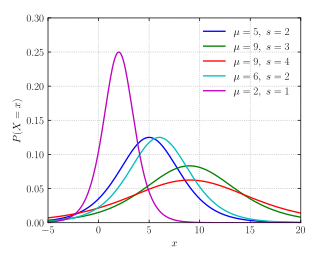
In probability and statistics, the log-logistic distribution is a continuous probability distribution for a non-negative random variable. It is used in survival analysis as a parametric model for events whose rate increases initially and decreases later, as, for example, mortality rate from cancer following diagnosis or treatment. It has also been used in hydrology to model stream flow and precipitation, in economics as a simple model of the distribution of wealth or income, and in networking to model the transmission times of data considering both the network and the software.
The term generalized logistic distribution is used as the name for several different families of probability distributions. For example, Johnson et al. list four forms, which are listed below.
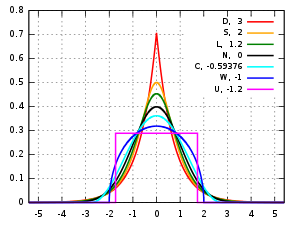
The generalized normal distribution or generalized Gaussian distribution (GGD) is either of two families of parametric continuous probability distributions on the real line. Both families add a shape parameter to the normal distribution. To distinguish the two families, they are referred to below as "symmetric" and "asymmetric"; however, this is not a standard nomenclature.
In statistics, L-moments are a sequence of statistics used to summarize the shape of a probability distribution. They are linear combinations of order statistics (L-statistics) analogous to conventional moments, and can be used to calculate quantities analogous to standard deviation, skewness and kurtosis, termed the L-scale, L-skewness and L-kurtosis respectively. Standardised L-moments are called L-moment ratios and are analogous to standardized moments. Just as for conventional moments, a theoretical distribution has a set of population L-moments. Sample L-moments can be defined for a sample from the population, and can be used as estimators of the population L-moments.

The Lomax distribution, conditionally also called the Pareto Type II distribution, is a heavy-tail probability distribution used in business, economics, actuarial science, queueing theory and Internet traffic modeling. It is named after K. S. Lomax. It is essentially a Pareto distribution that has been shifted so that its support begins at zero.

In probability theory and statistics, the harmonic distribution is a continuous probability distribution. It was discovered by Étienne Halphen, who had become interested in the statistical modeling of natural events. His practical experience in data analysis motivated him to pioneer a new system of distributions that provided sufficient flexibility to fit a large variety of data sets. Halphen restricted his search to distributions whose parameters could be estimated using simple statistical approaches. Then, Halphen introduced for the first time what he called the harmonic distribution or harmonic law. The harmonic law is a special case of the generalized inverse Gaussian distribution family when .