In statistics, a central tendency is a central or typical value for a probability distribution.

In descriptive statistics, the interquartile range (IQR) is a measure of statistical dispersion, which is the spread of the data. The IQR may also be called the midspread, middle 50%, fourth spread, or H‑spread. It is defined as the difference between the 75th and 25th percentiles of the data. To calculate the IQR, the data set is divided into quartiles, or four rank-ordered even parts via linear interpolation. These quartiles are denoted by Q1 (also called the lower quartile), Q2 (the median), and Q3 (also called the upper quartile). The lower quartile corresponds with the 25th percentile and the upper quartile corresponds with the 75th percentile, so IQR = Q3 − Q1.
In probability theory and statistics, kurtosis is a measure of the "tailedness" of the probability distribution of a real-valued random variable. Like skewness, kurtosis describes a particular aspect of a probability distribution. There are different ways to quantify kurtosis for a theoretical distribution, and there are corresponding ways of estimating it using a sample from a population. Different measures of kurtosis may have different interpretations.

In statistics, the standard deviation is a measure of the amount of variation of a random variable expected about its mean. A low standard deviation indicates that the values tend to be close to the mean of the set, while a high standard deviation indicates that the values are spread out over a wider range. The standard deviation is commonly used in the determination of what constitutes an outlier and what does not.

In probability theory and statistics, variance is the expected value of the squared deviation from the mean of a random variable. The standard deviation (SD) is obtained as the square root of the variance. Variance is a measure of dispersion, meaning it is a measure of how far a set of numbers is spread out from their average value. It is the second central moment of a distribution, and the covariance of the random variable with itself, and it is often represented by , , , , or .

In statistics, correlation or dependence is any statistical relationship, whether causal or not, between two random variables or bivariate data. Although in the broadest sense, "correlation" may indicate any type of association, in statistics it usually refers to the degree to which a pair of variables are linearly related. Familiar examples of dependent phenomena include the correlation between the height of parents and their offspring, and the correlation between the price of a good and the quantity the consumers are willing to purchase, as it is depicted in the so-called demand curve.
In probability theory and statistics, a standardized moment of a probability distribution is a moment that is normalized, typically by a power of the standard deviation, rendering the moment scale invariant. The shape of different probability distributions can be compared using standardized moments.

In statistics, the standard score is the number of standard deviations by which the value of a raw score is above or below the mean value of what is being observed or measured. Raw scores above the mean have positive standard scores, while those below the mean have negative standard scores.
In statistics and optimization, errors and residuals are two closely related and easily confused measures of the deviation of an observed value of an element of a statistical sample from its "true value". The error of an observation is the deviation of the observed value from the true value of a quantity of interest. The residual is the difference between the observed value and the estimated value of the quantity of interest. The distinction is most important in regression analysis, where the concepts are sometimes called the regression errors and regression residuals and where they lead to the concept of studentized residuals. In econometrics, "errors" are also called disturbances.
The standard error (SE) of a statistic is the standard deviation of its sampling distribution or an estimate of that standard deviation. If the statistic is the sample mean, it is called the standard error of the mean (SEM). The standard error is a key ingredient in producing confidence intervals.
In statistics, propagation of uncertainty is the effect of variables' uncertainties on the uncertainty of a function based on them. When the variables are the values of experimental measurements they have uncertainties due to measurement limitations which propagate due to the combination of variables in the function.
In probability theory and statistics, the coefficient of variation (CV), also known as normalized root-mean-square deviation (NRMSD), percent RMS, and relative standard deviation (RSD), is a standardized measure of dispersion of a probability distribution or frequency distribution. It is defined as the ratio of the standard deviation to the mean , and often expressed as a percentage ("%RSD"). The CV or RSD is widely used in analytical chemistry to express the precision and repeatability of an assay. It is also commonly used in fields such as engineering or physics when doing quality assurance studies and ANOVA gauge R&R, by economists and investors in economic models, and in psychology/neuroscience.
This glossary of statistics and probability is a list of definitions of terms and concepts used in the mathematical sciences of statistics and probability, their sub-disciplines, and related fields. For additional related terms, see Glossary of mathematics and Glossary of experimental design.
The mean absolute difference (univariate) is a measure of statistical dispersion equal to the average absolute difference of two independent values drawn from a probability distribution. A related statistic is the relative mean absolute difference, which is the mean absolute difference divided by the arithmetic mean, and equal to twice the Gini coefficient. The mean absolute difference is also known as the absolute mean difference and the Gini mean difference (GMD). The mean absolute difference is sometimes denoted by Δ or as MD.
In statistics, standardized (regression) coefficients, also called beta coefficients or beta weights, are the estimates resulting from a regression analysis where the underlying data have been standardized so that the variances of dependent and independent variables are equal to 1. Therefore, standardized coefficients are unitless and refer to how many standard deviations a dependent variable will change, per standard deviation increase in the predictor variable.
The root mean square deviation (RMSD) or root mean square error (RMSE) is either one of two closely related and frequently used measures of the differences between true or predicted values on the one hand and observed values or an estimator on the other.
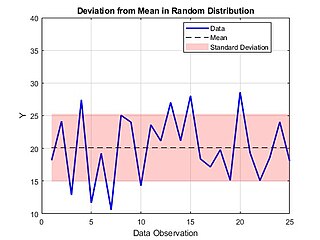
In mathematics and statistics, deviation serves as a measure to quantify the disparity between an observed value of a variable and another designated value, frequently the mean of that variable. Deviations with respect to the sample mean and the population mean are called errors and residuals, respectively. The sign of the deviation reports the direction of that difference: the deviation is positive when the observed value exceeds the reference value. The absolute value of the deviation indicates the size or magnitude of the difference. In a given sample, there are as many deviations as sample points. Summary statistics can be derived from a set of deviations, such as the standard deviation and the mean absolute deviation, measures of dispersion, and the mean signed deviation, a measure of bias.
In probability and statistics, the Tweedie distributions are a family of probability distributions which include the purely continuous normal, gamma and inverse Gaussian distributions, the purely discrete scaled Poisson distribution, and the class of compound Poisson–gamma distributions which have positive mass at zero, but are otherwise continuous. Tweedie distributions are a special case of exponential dispersion models and are often used as distributions for generalized linear models.
In probability theory and statistics, the index of dispersion, dispersion index,coefficient of dispersion,relative variance, or variance-to-mean ratio (VMR), like the coefficient of variation, is a normalized measure of the dispersion of a probability distribution: it is a measure used to quantify whether a set of observed occurrences are clustered or dispersed compared to a standard statistical model.


