One- and two-tailed tests

Last updated
A two-tailed test applied to the normal distribution. DisNormal06.svg
A two-tailed test applied to the normal distribution.
A one-tailed test, showing the p-value as the size of one tail. P-value Graph.png
A one-tailed test, showing the p-value as the size of one tail.

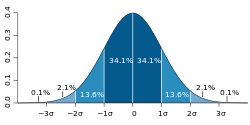
In statistical significance testing, a one-tailed test and a two-tailed test are alternative ways of computing the statistical significance of a parameter inferred from a data set, in terms of a test statistic. A two-tailed test is appropriate if the estimated value is greater or less than a certain range of values, for example, whether a test taker may score above or below a specific range of scores. This method is used for null hypothesis testing and if the estimated value exists in the critical areas, the alternative hypothesis is accepted over the null hypothesis. A one-tailed test is appropriate if the estimated value may depart from the reference value in only one direction, left or right, but not both. An example can be whether a machine produces more than one-percent defective products. In this situation, if the estimated value exists in one of the one-sided critical areas, depending on the direction of interest (greater than or less than), the alternative hypothesis is accepted over the null hypothesis. Alternative names are one-sided and two-sided tests; the terminology "tail" is used because the extreme portions of distributions, where observations lead to rejection of the null hypothesis, are small and often "tail off" toward zero as in the normal distribution, colored in yellow, or "bell curve", pictured on the right and colored in green.

Contents

Applications

One-tailed tests are used for asymmetric distributions that have a single tail, such as the chi-squared distribution, which are common in measuring goodness-of-fit, or for one side of a distribution that has two tails, such as the normal distribution, which is common in estimating location; this corresponds to specifying a direction. Two-tailed tests are only applicable when there are two tails, such as in the normal distribution, and correspond to considering either direction significant. [1] [2]

In the approach of Ronald Fisher, the null hypothesis H0 will be rejected when the p-value of the test statistic is sufficiently extreme (vis-a-vis the test statistic's sampling distribution) and thus judged unlikely to be the result of chance. This is usually done by comparing the resulting p-value with the specified significance level, denoted by , when computing the statistical significance of a parameter. In a one-tailed test, "extreme" is decided beforehand as either meaning "sufficiently small" or meaning "sufficiently large" – values in the other direction are considered not significant. One may report that the left or right tail probability as the one-tailed p-value, which ultimately corresponds to the direction in which the test statistic deviates from H0. [3] In a two-tailed test, "extreme" means "either sufficiently small or sufficiently large", and values in either direction are considered significant. [4] For a given test statistic, there is a single two-tailed test, and two one-tailed tests, one each for either direction. When provided a significance level , the critical regions would exist on the two tail ends of the distribution with an area of each for a two-tailed test. Alternatively, the critical region would solely exist on the single tail end with an area of for a one-tailed test. For a given significance level in a two-tailed test for a test statistic, the corresponding one-tailed tests for the same test statistic will be considered either twice as significant (half the p-value) if the data is in the direction specified by the test, or not significant at all (p-value above ) if the data is in the direction opposite of the critical region specified by the test.

For example, if flipping a coin, testing whether it is biased towards heads is a one-tailed test, and getting data of "all heads" would be seen as highly significant, while getting data of "all tails" would be not significant at all (p = 1). By contrast, testing whether it is biased in either direction is a two-tailed test, and either "all heads" or "all tails" would both be seen as highly significant data. In medical testing, while one is generally interested in whether a treatment results in outcomes that are better than chance, thus suggesting a one-tailed test; a worse outcome is also interesting for the scientific field, therefore one should use a two-tailed test that corresponds instead to testing whether the treatment results in outcomes that are different from chance, either better or worse. [5] In the archetypal lady tasting tea experiment, Fisher tested whether the lady in question was better than chance at distinguishing two types of tea preparation, not whether her ability was different from chance, and thus he used a one-tailed test.

Coin flipping example

In coin flipping, the null hypothesis is a sequence of Bernoulli trials with probability 0.5, yielding a random variable X which is 1 for heads and 0 for tails, and a common test statistic is the sample mean (of the number of heads) If testing for whether the coin is biased towards heads, a one-tailed test would be used – only large numbers of heads would be significant. In that case a data set of five heads (HHHHH), with sample mean of 1, has a chance of occurring, (5 consecutive flips with 2 outcomes - ((1/2)^5 =1/32). This would have and would be significant (rejecting the null hypothesis) if the test was analyzed at a significance level of (the significance level corresponding to the cutoff bound). However, if testing for whether the coin is biased towards heads or tails, a two-tailed test would be used, and a data set of five heads (sample mean 1) is as extreme as a data set of five tails (sample mean 0). As a result, the p-value would be and this would not be significant (not rejecting the null hypothesis) if the test was analyzed at a significance level of .

History

p-value of chi-squared distribution for different number of degrees of freedom Chi-square distributionCDF-English.png
p-value of chi-squared distribution for different number of degrees of freedom

The p-value was introduced by Karl Pearson [6] in the Pearson's chi-squared test, where he defined P (original notation) as the probability that the statistic would be at or above a given level. This is a one-tailed definition, and the chi-squared distribution is asymmetric, only assuming positive or zero values, and has only one tail, the upper one. It measures goodness of fit of data with a theoretical distribution, with zero corresponding to exact agreement with the theoretical distribution; the p-value thus measures how likely the fit would be this bad or worse.

Normal distribution, showing two tails Standard deviation diagram.svg
Normal distribution, showing two tails

The distinction between one-tailed and two-tailed tests was popularized by Ronald Fisher in the influential book Statistical Methods for Research Workers, [7] where he applied it especially to the normal distribution, which is a symmetric distribution with two equal tails. The normal distribution is a common measure of location, rather than goodness-of-fit, and has two tails, corresponding to the estimate of location being above or below the theoretical location (e.g., sample mean compared with theoretical mean). In the case of a symmetric distribution such as the normal distribution, the one-tailed p-value is exactly half the two-tailed p-value: [7]

Some confusion is sometimes introduced by the fact that in some cases we wish to know the probability that the deviation, known to be positive, shall exceed an observed value, whereas in other cases the probability required is that a deviation, which is equally frequently positive and negative, shall exceed an observed value; the latter probability is always half the former.

Fisher emphasized the importance of measuring the tail – the observed value of the test statistic and all more extreme – rather than simply the probability of specific outcome itself, in his The Design of Experiments (1935). [8] He explains this as because a specific set of data may be unlikely (in the null hypothesis), but more extreme outcomes likely, so seen in this light, the specific but not extreme unlikely data should not be considered significant.

Specific tests

If the test statistic follows a Student's t-distribution in the null hypothesis – which is common where the underlying variable follows a normal distribution with unknown scaling factor, then the test is referred to as a one-tailed or two-tailed t-test. If the test is performed using the actual population mean and variance, rather than an estimate from a sample, it would be called a one-tailed or two-tailed Z-test.

The statistical tables for t and for Z provide critical values for both one- and two-tailed tests. That is, they provide the critical values that cut off an entire region at one or the other end of the sampling distribution as well as the critical values that cut off the regions (of half the size) at both ends of the sampling distribution.

See also

Related Research Articles

<span class="mw-page-title-main">Kolmogorov–Smirnov test</span> Non-parametric statistical test between two distributions

In statistics, the Kolmogorov–Smirnov test is a nonparametric test of the equality of continuous, one-dimensional probability distributions that can be used to test whether a sample came from a given reference probability distribution, or to test whether two samples came from the same distribution. Intuitively, the test provides a method to qualitatively answer the question "How likely is it that we would see a collection of samples like this if they were drawn from that probability distribution?" or, in the second case, "How likely is it that we would see two sets of samples like this if they were drawn from the same probability distribution?". It is named after Andrey Kolmogorov and Nikolai Smirnov.

<span class="mw-page-title-main">Statistical hypothesis test</span> Method of statistical inference

A statistical hypothesis test is a method of statistical inference used to decide whether the data sufficiently support a particular hypothesis. A statistical hypothesis test typically involves a calculation of a test statistic. Then a decision is made, either by comparing the test statistic to a critical value or equivalently by evaluating a p-value computed from the test statistic. The are around 100 specialized statistical tests.

In statistical hypothesis testing, a result has statistical significance when a result at least as "extreme" would be very infrequent if the null hypothesis were true. More precisely, a study's defined significance level, denoted by , is the probability of the study rejecting the null hypothesis, given that the null hypothesis is true; and the p-value of a result, , is the probability of obtaining a result at least as extreme, given that the null hypothesis is true. The result is statistically significant, by the standards of the study, when . The significance level for a study is chosen before data collection, and is typically set to 5% or much lower—depending on the field of study.

In scientific research, the null hypothesis is the claim that the effect being studied does not exist. Note that the term "effect" here is not meant to imply a causative relationship.

In statistics, the power of a binary hypothesis test is the probability that the test correctly rejects the null hypothesis when a specific alternative hypothesis is true. It is commonly denoted by , and represents the chances of a true positive detection conditional on the actual existence of an effect to detect. Statistical power ranges from 0 to 1, and as the power of a test increases, the probability of making a type II error by wrongly failing to reject the null hypothesis decreases.

<i>F</i>-test Statistical hypothesis test, mostly using multiple restrictions

An F-test is any statistical test used to compare the variances of two samples or the ratio of variances between multiple samples. The test statistic, random variable F, is used to determine if the tested data has an F-distribution under the true null hypothesis, and true customary assumptions about the error term (ε). It is most often used when comparing statistical models that have been fitted to a data set, in order to identify the model that best fits the population from which the data were sampled. Exact "F-tests" mainly arise when the models have been fitted to the data using least squares. The name was coined by George W. Snedecor, in honour of Ronald Fisher. Fisher initially developed the statistic as the variance ratio in the 1920s.

<i>Z</i>-test Statistical test

A Z-test is any statistical test for which the distribution of the test statistic under the null hypothesis can be approximated by a normal distribution. Z-test tests the mean of a distribution. For each significance level in the confidence interval, the Z-test has a single critical value which makes it more convenient than the Student's t-test whose critical values are defined by the sample size. Both the Z-test and Student's t-test have similarities in that they both help determine the significance of a set of data. However, the z-test is rarely used in practice because the population deviation is difficult to determine.

Student's t-test is a statistical test used to test whether the difference between the response of two groups is statistically significant or not. It is any statistical hypothesis test in which the test statistic follows a Student's t-distribution under the null hypothesis. It is most commonly applied when the test statistic would follow a normal distribution if the value of a scaling term in the test statistic were known. When the scaling term is estimated based on the data, the test statistic—under certain conditions—follows a Student's t distribution. The t-test's most common application is to test whether the means of two populations are significantly different. In many cases, a Z-test will yield very similar results to a t-test since the latter converges to the former as the size of the dataset increases.

In null-hypothesis significance testing, the -value is the probability of obtaining test results at least as extreme as the result actually observed, under the assumption that the null hypothesis is correct. A very small p-value means that such an extreme observed outcome would be very unlikely under the null hypothesis. Even though reporting p-values of statistical tests is common practice in academic publications of many quantitative fields, misinterpretation and misuse of p-values is widespread and has been a major topic in mathematics and metascience. In 2016, the American Statistical Association (ASA) made a formal statement that "p-values do not measure the probability that the studied hypothesis is true, or the probability that the data were produced by random chance alone" and that "a p-value, or statistical significance, does not measure the size of an effect or the importance of a result" or "evidence regarding a model or hypothesis." That said, a 2019 task force by ASA has issued a statement on statistical significance and replicability, concluding with: "p-values and significance tests, when properly applied and interpreted, increase the rigor of the conclusions drawn from data."

In statistical hypothesis testing, the alternative hypothesis is one of the proposed proposition in the hypothesis test. In general the goal of hypothesis test is to demonstrate that in the given condition, there is sufficient evidence supporting the credibility of alternative hypothesis instead of the exclusive proposition in the test. It is usually consistent with the research hypothesis because it is constructed from literature review, previous studies, etc. However, the research hypothesis is sometimes consistent with the null hypothesis.

Fisher's exact test is a statistical significance test used in the analysis of contingency tables. Although in practice it is employed when sample sizes are small, it is valid for all sample sizes. It is named after its inventor, Ronald Fisher, and is one of a class of exact tests, so called because the significance of the deviation from a null hypothesis can be calculated exactly, rather than relying on an approximation that becomes exact in the limit as the sample size grows to infinity, as with many statistical tests.

In statistics, the binomial test is an exact test of the statistical significance of deviations from a theoretically expected distribution of observations into two categories using sample data.

<span class="mw-page-title-main">Kruskal–Wallis test</span> Non-parametric method for testing whether samples originate from the same distribution

The Kruskal–Wallis test by ranks, Kruskal–Wallis test, or one-way ANOVA on ranks is a non-parametric method for testing whether samples originate from the same distribution. It is used for comparing two or more independent samples of equal or different sample sizes. It extends the Mann–Whitney U test, which is used for comparing only two groups. The parametric equivalent of the Kruskal–Wallis test is the one-way analysis of variance (ANOVA).

<span class="mw-page-title-main">Test statistic</span> Statistic used in statistical hypothesis testing

Test statistic is a quantity derived from the sample for statistical hypothesis testing. A hypothesis test is typically specified in terms of a test statistic, considered as a numerical summary of a data-set that reduces the data to one value that can be used to perform the hypothesis test. In general, a test statistic is selected or defined in such a way as to quantify, within observed data, behaviours that would distinguish the null from the alternative hypothesis, where such an alternative is prescribed, or that would characterize the null hypothesis if there is no explicitly stated alternative hypothesis.

A permutation test is an exact statistical hypothesis test making use of the proof by contradiction. A permutation test involves two or more samples. The null hypothesis is that all samples come from the same distribution . Under the null hypothesis, the distribution of the test statistic is obtained by calculating all possible values of the test statistic under possible rearrangements of the observed data. Permutation tests are, therefore, a form of resampling.

Exact (significance) test is a test such that if the null hypothesis is true, then all assumptions made during the derivation of the distribution of the test statistic are met. Using an exact test provides a significance test that maintains the type I error rate of the test at the desired significance level of the test. For example, an exact test at a significance level of , when repeated over many samples where the null hypothesis is true, will reject at most of the time. This is in contrast to an approximate test in which the desired type I error rate is only approximately maintained, while this approximation may be made as close to as desired by making the sample size sufficiently large.

The sign test is a statistical method to test for consistent differences between pairs of observations, such as the weight of subjects before and after treatment. Given pairs of observations for each subject, the sign test determines if one member of the pair tends to be greater than the other member of the pair.

In statistical hypothesis testing, a type I error is the mistaken rejection of a null hypothesis that is actually true. A type I error is also known as a "false positive" finding or conclusion; example: "an innocent person is convicted". A type II error is the failure to reject a null hypothesis that is actually false. A type II error is also known as a "false negative" finding or conclusion; example: "a guilty person is not convicted". Much of statistical theory revolves around the minimization of one or both of these errors, though the complete elimination of either is a statistical impossibility if the outcome is not determined by a known, observable causal process. By selecting a low threshold (cut-off) value and modifying the alpha (α) level, the quality of the hypothesis test can be increased. The knowledge of type I errors and type II errors is widely used in medical science, biometrics and computer science.

<span class="mw-page-title-main">Fisher's method</span> Statistical method

In statistics, Fisher's method, also known as Fisher's combined probability test, is a technique for data fusion or "meta-analysis" (analysis of analyses). It was developed by and named for Ronald Fisher. In its basic form, it is used to combine the results from several independence tests bearing upon the same overall hypothesis (H0).

Additive disequilibrium (D) is a statistic that estimates the difference between observed genotypic frequencies and the genotypic frequencies that would be expected under Hardy–Weinberg equilibrium. At a biallelic locus with alleles 1 and 2, the additive disequilibrium exists according to the equations

References

  1. Mundry, R.; Fischer, J. (1998). "Use of Statistical Programs for Nonparametric Tests of Small Samples Often Leads to Incorrect P Values: Examples from Animal Behaviour". Animal Behaviour. 56 (1): 256–259. doi:10.1006/anbe.1998.0756. PMID   9710485. S2CID   40169869.
  2. Pillemer, D. B. (1991). "One-versus two-tailed hypothesis tests in contemporary educational research". Educational Researcher. 20 (9): 13–17. doi:10.3102/0013189X020009013. S2CID   145478007.
  3. A modern introduction to probability and statistics : understanding why and how . Dekking, Michel, 1946-. London: Springer. 2005. pp.  389–390. ISBN   9781852338961. OCLC   262680588.{{cite book}}: CS1 maint: others (link)
  4. John E. Freund, (1984) Modern Elementary Statistics, sixth edition. Prentice hall. ISBN   0-13-593525-3 (Section "Inferences about Means", chapter "Significance Tests", page 289.)
  5. J M Bland, D G Bland (BMJ, 1994) Statistics Notes: One and two sided tests of significance
  6. Pearson, Karl (1900). "On the criterion that a given system of deviations from the probable in the case of a correlated system of variables is such that it can be reasonably supposed to have arisen from random sampling" (PDF). Philosophical Magazine. Series 5. 50 (302): 157–175. doi:10.1080/14786440009463897.
  7. 1 2 Fisher, Ronald (1925). Statistical Methods for Research Workers. Edinburgh: Oliver & Boyd. ISBN   0-05-002170-2.
  8. Fisher, Ronald A. (1971) [1935]. The Design of Experiments (9th ed.). Macmillan. ISBN   0-02-844690-9.