Whereas a mediator is a factor in the causal chain (above), a confounder is a spurious factor incorrectly implying causation (bottom)
In causal inference, a confounder is traditionally understood to be a variable that (1) independently predicts the outcome (or dependent variable), (2) is associated with the exposure (or independent variable), and (3) is not on the causal pathway between the exposure and the outcome.[1][2][3] Failure to control for a confounder results in a spurious association between exposure and outcome.
Confounding is a causal concept rather than a purely statistical one, and therefore cannot be fully described by correlations or associations alone.[4] The presence of confounders helps explain why correlation does not imply causation, and why careful study design and analytical methods (such as randomization, statistical adjustment, or causal diagrams) are required to distinguish causal effects from spurious associations.
Several notation systems and formal frameworks, such as causal directed acyclic graphs (DAGs), have been developed to represent and detect confounding, making it possible to identify when a variable must be controlled for in order to obtain an unbiased estimate of a causal effect.
Confounding is defined in terms of the data generating model. Let X be an exposure (or independent variable), and let Y be the outcome (or dependent variable). Traditionally, a variable Z was considered to confound the relationship between X and Y if Z (1) independently predicts Y, (2) is associated with X, and (3) is not on the causal pathway between X and Y.[1][2][3] Not controlling for Z introduces a spurious relationship between X and Y.
However, several developments in causal inference over the past decades have shown that this definition of confounding is inadequate[6][7]. This is because there can be pre-exposure variables associated with the outcome that, when controlled for, introduce rather than eliminate bias.
Modern causal inference therefore typically defines a confounder in terms of the minimally sufficient adjustment set.[8][1] Formally, a set of variables Z is a sufficient adjustment set for the effect of X on Y if, conditional on Z, the potential outcomes are independent of X. I.e. after adjusting for Z, the exposed and unexposed groups are exchangeable with respect to the outcome. A minimally sufficient adjustment set is an adjustment set Z where every member of Z is required to control for confounding. Under this framework, a confounder is defined as a member of the minimally sufficient adjustment set.
In the language of directed acyclic graphs, confounding corresponds to the presence of one or more open backdoor paths between X and Y.[9] A set of variables Z is a sufficient adjustment set if conditioning on Z blocks all backdoor paths from X to Y. The set is minimally sufficient if no proper subset of Z satisfies this property. Removing any variable from a minimally sufficient set reopens at least one backdoor path.
Examples
Simple Example
A trucking company compares the fuel economy of trucks from two manufacturers (“A” and “B”) by measuring miles per gallon over one month. They find that A trucks appear more fuel-efficient. However, A trucks are more often assigned highway routes while B trucks are more often assigned city routes. Here, truck make is the independent variable, MPG is the dependent variable, and route type (or proportion of city driving) is the confounder. Because route type affects MPG and the route type differs across truck make, it confounds the comparison. Thus the observed difference likely reflects highway vs. city driving rather than truck make.
Relationship between birth order and Down Syndrome
A scientist is studying the relationship between birth order (1st child, 2nd child, etc.) and the presence of Down syndrome in the child. However, it is known that:
Higher maternal age is directly associated with Down Syndrome in the child
Higher maternal age is directly associated with Down Syndrome, regardless of birth order (a mother having her 1st vs 3rd child at age 50 confers the same risk)
Maternal age is directly associated with birth order (the 2nd child, except in the case of twins, is born when the mother is older than she was for the birth of the 1st child)
Maternal age is not a consequence of birth order (having a 2nd child does not change the mother's age)
In this scenario, maternal age is a confounding variable, as it influences both the independent variable (birth order), and the dependent variable (Down syndrome).
Relationship between smoking and lung disease
A scientist is studying the relationship between smoking status (smoker vs. non-smoker) and the presence of lung disease. However, it is known that:
Alcohol consumption and diet are directly associated with lung disease and overall health.
Alcohol consumption and diet affect health regardless of smoking status (a smoker and non-smoker with similar alcohol use and diet may have similar health risks).
Alcohol consumption and diet are associated with smoking status (smokers are, on average, more likely to drink alcohol or have less healthy diets than non-smokers).
Alcohol consumption and diet are not consequences of smoking itself (smoking does not necessarily cause higher alcohol intake or poor diet, even if they are correlated).
In this scenario, alcohol consumption or diet is a confounding variable, because it influences both the independent variable (smoking status) and the dependent variable (health outcome). If these factors are not controlled, the observed association between smoking and lung disease may be partly or entirely due to differences in alcohol use or diet rather than smoking itself.
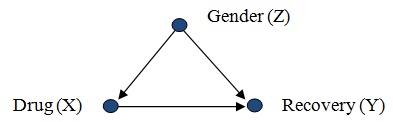
Consider a researcher attempting to assess the effectiveness of drug X, from population data in which drug usage was a patient's choice. The data shows that gender (Z) influences a patient's choice of drug as well as their chances of recovery (Y). In this scenario, gender Z confounds the relation between X and Y since Z is a cause of both X and Y:
Causal diagram of Gender as common cause of Drug use and Recovery
We have that
2
because the observational quantity contains information about the correlation between X and Z, and the interventional quantity does not (since X is not correlated with Z in a randomized experiment). It can be shown[10] that, in cases where only observational data is available, an unbiased estimate of the desired quantity , can be obtained by "adjusting" for all confounding factors, namely, conditioning on their various values and averaging the result. In the case of a single confounder Z, this leads to the "adjustment formula":
3
which gives an unbiased estimate for the causal effect of X on Y. The same adjustment formula works when there are multiple confounders except, in this case, the choice of a set Z of variables that would guarantee unbiased estimates must be done with caution. The criterion for a proper choice of variables is called the Back-Door[10][11] and requires that the chosen set Z "blocks" (or intercepts) every path between X and Y that contains an arrow into X. Such sets are called "Back-Door admissible" and may include variables which are not common causes of X and Y, but merely proxies thereof.
Returning to the drug use example, since Z complies with the Back-Door requirement (i.e., it intercepts the one Back-Door path ), the Back-Door adjustment formula is valid:
4
In this way the physician can predict the likely effect of administering the drug from observational studies in which the conditional probabilities appearing on the right-hand side of the equation can be estimated by regression.
Contrary to common beliefs, adding covariates to the adjustment set Z can introduce bias.[12] A typical counterexample occurs when Z is a common effect of X and Y,[13] a case in which Z is not a confounder (i.e., the null set is Back-door admissible) and adjusting for Z would create bias known as "collider bias" or "Berkson's paradox." Controls that are not good confounders are sometimes called bad controls.
In general, confounding can be controlled by adjustment if and only if there is a set of observed covariates that satisfies the Back-Door condition. Moreover, if Z is such a set, then the adjustment formula of Eq. (3) is valid.[10][11] Pearl's do-calculus provides all possible conditions under which can be estimated, not necessarily by adjustment.[14]
History
According to Morabia (2011),[15] the word confounding derives from the Medieval Latin verb "confundere", which meant "mixing", and was probably chosen to represent the confusion (from Latin: con=with + fusus=mix or fuse together) between the cause one wishes to assess and other causes that may affect the outcome and thus confuse, or stand in the way of the desired assessment. Greenland, Robins and Pearl[16] note an early use of the term "confounding" in causal inference by John Stuart Mill in 1843.
Fisher introduced the word "confounding" in his 1935 book "The Design of Experiments"[17] to refer specifically to a consequence of blocking (i.e., partitioning) the set of treatment combinations in a factorial experiment, whereby certain interactions may be "confounded with blocks". This popularized the notion of confounding in statistics, although Fisher was concerned with the control of heterogeneity in experimental units, not with causal inference.
According to Vandenbroucke (2004)[18] it was Kish[19] who used the word "confounding" in the sense of "incomparability" of two or more groups (e.g., exposed and unexposed) in an observational study. Formal conditions defining what makes certain groups "comparable" and others "incomparable" were later developed in epidemiology by Greenland and Robins (1986)[20] using the counterfactual language of Neyman (1935)[21] and Rubin (1974).[22] These were later supplemented by graphical criteria such as the Back-Door condition (Pearl 1993; Greenland, Robins and Pearl 1999).[16][10]
Graphical criteria were shown to be formally equivalent to the counterfactual definition[23] but more transparent to researchers relying on process models.
Types
In the case of risk assessments evaluating the magnitude and nature of risk to humanhealth, it is important to control for confounding to isolate the effect of a particular hazard such as a food additive, pesticide, or new drug. For prospective studies, it is difficult to recruit and screen for volunteers with the same background (age, diet, education, geography, etc.), and in historical studies, there can be similar variability. Due to the inability to control for variability of volunteers and human studies, confounding is a particular challenge. For these reasons, experiments offer a way to avoid most forms of confounding.
In some disciplines, confounding is categorized into different types. In epidemiology, one type is "confounding by indication",[24] which relates to confounding from observational studies. Because prognostic factors may influence treatment decisions (and bias estimates of treatment effects), controlling for known prognostic factors may reduce this problem, but it is always possible that a forgotten or unknown factor was not included or that factors interact complexly. Confounding by indication has been described as the most important limitation of observational studies. Randomized trials are not affected by confounding by indication due to random assignment.
Confounding variables may also be categorised according to their source. The choice of measurement instrument (operational confound), situational characteristics (procedural confound), or inter-individual differences (person confound).
An operational confounding can occur in both experimental and non-experimental research designs. This type of confounding occurs when a measure designed to assess a particular construct inadvertently measures something else as well.[25]
A procedural confounding can occur in a laboratory experiment or a quasi-experiment. This type of confound occurs when the researcher mistakenly allows another variable to change along with the manipulated independent variable.[25]
A person confounding occurs when two or more groups of units are analyzed together (e.g., workers from different occupations), despite varying according to one or more other (observed or unobserved) characteristics (e.g., gender).[26]
Decreasing the potential for confounding
A reduction in the potential for the occurrence and effect of confounding factors can be obtained by increasing the types and numbers of comparisons performed in an analysis. If measures or manipulations of core constructs are confounded (i.e. operational or procedural confounds exist), subgroup analysis may not reveal problems in the analysis. Additionally, increasing the number of comparisons can create other problems (see multiple comparisons).
Peer review is a process that can assist in reducing instances of confounding, either before study implementation or after analysis has occurred. Peer review relies on collective expertise within a discipline to identify potential weaknesses in study design and analysis, including ways in which results may depend on confounding. Similarly, replication can test for the robustness of findings from one study under alternative study conditions or alternative analyses (e.g., controlling for potential confounds not identified in the initial study).
Confounding effects may be less likely to occur and act similarly at multiple times and locations.[citation needed] In selecting study sites, the environment can be characterized in detail at the study sites to ensure sites are ecologically similar and therefore less likely to have confounding variables. Lastly, the relationship between the environmental variables that possibly confound the analysis and the measured parameters can be studied. The information pertaining to environmental variables can then be used in site-specific models to identify residual variance that may be due to real effects.[27]
Depending on the type of study design in place, there are various ways to modify that design to actively exclude or control confounding variables:[28]
Case-control studies assign confounders to both groups, cases and controls, equally. For example, if somebody wanted to study the cause of myocardial infarct and thinks that the age is a probable confounding variable, each 67-year-old infarct patient will be matched with a healthy 67-year-old "control" person. In case-control studies, matched variables most often are the age and sex. Drawback: Case-control studies are feasible only when it is easy to find controls, i.e. persons whose status vis-à-vis all known potential confounding factors is the same as that of the case's patient: Suppose a case-control study attempts to find the cause of a given disease in a person who is 1) 45 years old, 2) African-American, 3) from Alaska, 4) an avid football player, 5) vegetarian, and 6) working in education. A theoretically perfect control would be a person who, in addition to not having the disease being investigated, matches all these characteristics and has no diseases that the patient does not also have—but finding such a control would be an enormous task.
Cohort studies: A degree of matching is also possible and it is often done by only admitting certain age groups or a certain sex into the study population, creating a cohort of people who share similar characteristics and thus all cohorts are comparable in regard to the possible confounding variable. For example, if age and sex are thought to be confounders, only 40 to 50 years old males would be involved in a cohort study that would assess the myocardial infarct risk in cohorts that either are physically active or inactive. Drawback: In cohort studies, the overexclusion of input data may lead researchers to define too narrowly the set of similarly situated persons for whom they claim the study to be useful, such that other persons to whom the causal relationship does in fact apply may lose the opportunity to benefit from the study's recommendations. Similarly, "over-stratification" of input data within a study may reduce the sample size in a given stratum to the point where generalizations drawn by observing the members of that stratum alone are not statistically significant.
Double blinding: conceals from the trial population and the observers the experiment group membership of the participants. By preventing the participants from knowing if they are receiving treatment or not, the placebo effect should be the same for the control and treatment groups. By preventing the observers from knowing of their membership, there should be no bias from researchers treating the groups differently or from interpreting the outcomes differently.
Randomized controlled trial: A method where the study population is divided randomly in order to mitigate the chances of self-selection by participants or bias by the study designers. Before the experiment begins, the testers will assign the members of the participant pool to their groups (control, intervention, parallel), using a randomization process such as the use of a random number generator. For example, in a study on the effects of exercise, the conclusions would be less valid if participants were given a choice if they wanted to belong to the control group which would not exercise or the intervention group which would be willing to take part in an exercise program. The study would then capture other variables besides exercise, such as pre-experiment health levels and motivation to adopt healthy activities. From the observer's side, the experimenter may choose candidates who are more likely to show the results the study wants to see or may interpret subjective results (more energetic, positive attitude) in a way favorable to their desires.
Stratification: As in the example above, physical activity is thought to be a behaviour that protects from myocardial infarct; and age is assumed to be a possible confounder. The data sampled is then stratified by age group – this means that the association between activity and infarct would be analyzed per each age group. If the different age groups (or age strata) yield much different risk ratios, age must be viewed as a confounding variable. There exist statistical tools, among them Mantel–Haenszel methods, that account for stratification of data sets.
Controlling for confounding by measuring the known confounders and including them as covariates is multivariable analysis such as regression analysis. Multivariate analyses reveal much less information about the strength or polarity of the confounding variable than do stratification methods. For example, if multivariate analysis controls for antidepressant, and it does not stratify antidepressants for TCA and SSRI, then it will ignore that these two classes of antidepressant have opposite effects on myocardial infarction, and one is much stronger than the other.
All these methods have their drawbacks:
The best available defense against the possibility of spurious results due to confounding is often to dispense with efforts at stratification and instead conduct a randomized study of a sufficiently large sample taken as a whole, such that all potential confounding variables (known and unknown) will be distributed by chance across all study groups and hence will be uncorrelated with the binary variable for inclusion/exclusion in any group.
Ethical considerations: In double-blind and randomized controlled trials, participants are not aware that they are recipients of sham treatments and may be denied effective treatments.[29] There is a possibility that patients only agree to invasive surgery (which carry real medical risks) under the understanding that they are receiving treatment. Although this is an ethical concern, it is not a complete account of the situation. For surgeries that are currently being performed regularly, but for which there is no concrete evidence of a genuine effect, there may be ethical issues to continue such surgeries. In such circumstances, many of people are exposed to the real risks of surgery yet these treatments may possibly offer no discernible benefit. Sham-surgery control is a method that may allow medical science to determine whether a surgical procedure is efficacious or not. Given that there are known risks associated with medical operations, it is questionably ethical to allow unverified surgeries to be conducted ad infinitum into the future.
Criticism
Concerns have been raised that confounding in medical research can product false null results due to decreasing exposure reliability and increasing sibling-correlations.[30][31]
Artifacts
Artifacts are variables that should have been systematically varied, either within or across studies, but that were accidentally held constant. Artifacts are thus threats to external validity. Artifacts are factors that covary with the treatment and the outcome. Campbell and Stanley[32] identify several artifacts. The major threats to internal validity are history, maturation, testing, instrumentation, statistical regression, selection, experimental mortality, and selection-history interactions.
One way to minimize the influence of artifacts is to use a pretest-posttest control group design. Within this design, "groups of people who are initially equivalent (at the pretest phase) are randomly assigned to receive the experimental treatment or a control condition and then assessed again after this differential experience (posttest phase)".[33] Thus, any effects of artifacts are (ideally) equally distributed in participants in both the treatment and control conditions.
↑Pearl, J. (2009). Causality: Models, Reasoning and Inference (2nd ed.). New York: Cambridge University Press. Chapter: "Simpson's Paradox, Confounding, and Collapsibility".
↑Shadish, W. R.; Cook, T. D.; Campbell, D. T. (2002). Experimental and quasi-experimental designs for generalized causal inference. Boston, MA: Houghton-Mifflin.
↑Pearl, Judea (2022). Causality: models, reasoning, and inference (Second edition, reprinted with correctionsed.). Cambridge New York, NY Port Melbourne New Delhi Singapore: Cambridge University Press. ISBN978-0-521-89560-6.
1234Pearl, J., (1993). "Aspects of Graphical Models Connected With Causality", In Proceedings of the 49th Session of the International Statistical Science Institute, pp. 391–401.
12Pearl, J. (2009). Causal Diagrams and the Identification of Causal Effects In Causality: Models, Reasoning and Inference (2nd ed.). New York, NY, US: Cambridge University Press.
↑Neyman, J., with cooperation of K. Iwaskiewics and St. Kolodziejczyk (1935). Statistical problems in agricultural experimentation (with discussion). Suppl J Roy Statist Soc Ser B 2 107-180.
↑Rubin, D. B. (1974). "Estimating causal effects of treatments in randomized and nonrandomized studies". Journal of Educational Psychology. 66 (5): 688–701. doi:10.1037/h0037350. S2CID52832751.
↑Pearl, J., (2009). Causality: Models, Reasoning and Inference (2nd ed.). New York, NY, US: Cambridge University Press.
12Pelham, Brett (2006). Conducting Research in Psychology. Belmont: Wadsworth. ISBN978-0-534-53294-9.
↑Steg, L.; Buunk, A. P.; Rothengatter, T. (2008). "Chapter 4". Applied Social Psychology: Understanding and managing social problems. Cambridge, UK: Cambridge University Press.
↑Calow, Peter P. (2009) Handbook of Environmental Risk Assessment and Management, Wiley
Montgomery, D. C. (2001). "Blocking and Confounding in the Factorial Design". Design and Analysis of Experiments (5thed.). Wiley. pp.287–302. This textbook has an overview of confounding factors and how to account for them in design of experiments.{{cite book}}: CS1 maint: postscript (link)
This page is based on this Wikipedia article Text is available under the CC BY-SA 4.0 license; additional terms may apply. Images, videos and audio are available under their respective licenses.