
Statistical inference is the process of using data analysis to infer properties of an underlying distribution of probability. Inferential statistical analysis infers properties of a population, for example by testing hypotheses and deriving estimates. It is assumed that the observed data set is sampled from a larger population.
The likelihood function is the joint probability mass of observed data viewed as a function of the parameters of a statistical model. Intuitively, the likelihood function is the probability of observing data assuming is the actual parameter.

In probability and statistics, Student's t distribution is a continuous probability distribution that generalizes the standard normal distribution. Like the latter, it is symmetric around zero and bell-shaped.
In statistics, point estimation involves the use of sample data to calculate a single value which is to serve as a "best guess" or "best estimate" of an unknown population parameter. More formally, it is the application of a point estimator to the data to obtain a point estimate.
In statistics, interval estimation is the use of sample data to estimate an interval of possible values of a parameter of interest. This is in contrast to point estimation, which gives a single value.
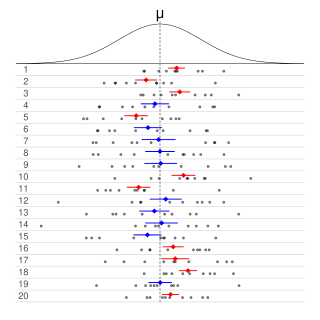
Informally, in frequentist statistics, a confidence interval (CI) is an interval which is expected to typically contain the parameter being estimated. More specifically, given a confidence level , a CI is a random interval which contains the parameter being estimated % of the time. The confidence level, degree of confidence or confidence coefficient represents the long-run proportion of CIs that theoretically contain the true value of the parameter; this is tantamount to the nominal coverage probability. For example, out of all intervals computed at the 95% level, 95% of them should contain the parameter's true value.
In statistical inference, specifically predictive inference, a prediction interval is an estimate of an interval in which a future observation will fall, with a certain probability, given what has already been observed. Prediction intervals are often used in regression analysis.

In probability theory and statistics, the continuous uniform distributions or rectangular distributions are a family of symmetric probability distributions. Such a distribution describes an experiment where there is an arbitrary outcome that lies between certain bounds. The bounds are defined by the parameters, and which are the minimum and maximum values. The interval can either be closed or open. Therefore, the distribution is often abbreviated where stands for uniform distribution. The difference between the bounds defines the interval length; all intervals of the same length on the distribution's support are equally probable. It is the maximum entropy probability distribution for a random variable under no constraint other than that it is contained in the distribution's support.
In Bayesian statistics, a maximum a posteriori probability (MAP) estimate is an estimate of an unknown quantity, that equals the mode of the posterior distribution. The MAP can be used to obtain a point estimate of an unobserved quantity on the basis of empirical data. It is closely related to the method of maximum likelihood (ML) estimation, but employs an augmented optimization objective which incorporates a prior distribution over the quantity one wants to estimate. MAP estimation can therefore be seen as a regularization of maximum likelihood estimation.
This glossary of statistics and probability is a list of definitions of terms and concepts used in the mathematical sciences of statistics and probability, their sub-disciplines, and related fields. For additional related terms, see Glossary of mathematics and Glossary of experimental design.
Fiducial inference is one of a number of different types of statistical inference. These are rules, intended for general application, by which conclusions can be drawn from samples of data. In modern statistical practice, attempts to work with fiducial inference have fallen out of fashion in favour of frequentist inference, Bayesian inference and decision theory. However, fiducial inference is important in the history of statistics since its development led to the parallel development of concepts and tools in theoretical statistics that are widely used. Some current research in statistical methodology is either explicitly linked to fiducial inference or is closely connected to it.
Neyman construction, named after Jerzy Neyman, is a frequentist method to construct an interval at a confidence level such that if we repeat the experiment many times the interval will contain the true value of some parameter a fraction of the time.
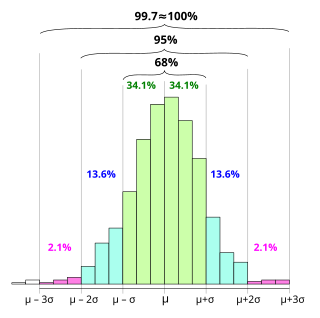
In statistics, the 68–95–99.7 rule, also known as the empirical rule, is a shorthand used to remember the percentage of values that lie within an interval estimate in a normal distribution: 68%, 95%, and 99.7% of the values lie within one, two, and three standard deviations of the mean, respectively.
Frequentist inference is a type of statistical inference based in frequentist probability, which treats “probability” in equivalent terms to “frequency” and draws conclusions from sample-data by means of emphasizing the frequency or proportion of findings in the data. Frequentist inference underlies frequentist statistics, in which the well-established methodologies of statistical hypothesis testing and confidence intervals are founded.
Algorithmic inference gathers new developments in the statistical inference methods made feasible by the powerful computing devices widely available to any data analyst. Cornerstones in this field are computational learning theory, granular computing, bioinformatics, and, long ago, structural probability . The main focus is on the algorithms which compute statistics rooting the study of a random phenomenon, along with the amount of data they must feed on to produce reliable results. This shifts the interest of mathematicians from the study of the distribution laws to the functional properties of the statistics, and the interest of computer scientists from the algorithms for processing data to the information they process.
In statistical inference, the concept of a confidence distribution (CD) has often been loosely referred to as a distribution function on the parameter space that can represent confidence intervals of all levels for a parameter of interest. Historically, it has typically been constructed by inverting the upper limits of lower sided confidence intervals of all levels, and it was also commonly associated with a fiducial interpretation, although it is a purely frequentist concept. A confidence distribution is NOT a probability distribution function of the parameter of interest, but may still be a function useful for making inferences.
In Bayesian inference, the Bernstein–von Mises theorem provides the basis for using Bayesian credible sets for confidence statements in parametric models. It states that under some conditions, a posterior distribution converges in the limit of infinite data to a multivariate normal distribution centered at the maximum likelihood estimator with covariance matrix given by , where is the true population parameter and is the Fisher information matrix at the true population parameter value:
In probability theory and statistics, an inverse distribution is the distribution of the reciprocal of a random variable. Inverse distributions arise in particular in the Bayesian context of prior distributions and posterior distributions for scale parameters. In the algebra of random variables, inverse distributions are special cases of the class of ratio distributions, in which the numerator random variable has a degenerate distribution.
In statistics, almost sure hypothesis testing or a.s. hypothesis testing utilizes almost sure convergence in order to determine the validity of a statistical hypothesis with probability one. This is to say that whenever the null hypothesis is true, then an a.s. hypothesis test will fail to reject the null hypothesis w.p. 1 for all sufficiently large samples. Similarly, whenever the alternative hypothesis is true, then an a.s. hypothesis test will reject the null hypothesis with probability one, for all sufficiently large samples. Along similar lines, an a.s. confidence interval eventually contains the parameter of interest with probability 1. Dembo and Peres (1994) proved the existence of almost sure hypothesis tests.
In statistics, when selecting a statistical model for given data, the relative likelihood compares the relative plausibilities of different candidate models or of different values of a parameter of a single model.


