Time domain

Last updated
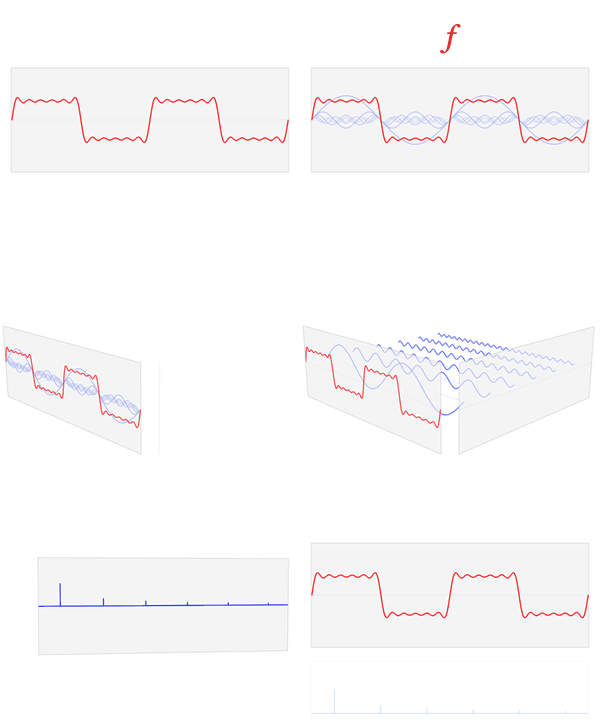
The Fourier transform relates the function in the time domain, shown in red, to the function in the frequency domain, shown in blue. The component frequencies, spread across the frequency spectrum, are represented as peaks in the frequency domain. Fourier transform time and frequency domains (small).gif
The Fourier transform relates the function in the time domain, shown in red, to the function in the frequency domain, shown in blue. The component frequencies, spread across the frequency spectrum, are represented as peaks in the frequency domain.

Time domain refers to the analysis of mathematical functions, physical signals or time series of economic or environmental data, with respect to time. In the time domain, the signal or function's value is known for all real numbers, for the case of continuous time, or at various separate instants in the case of discrete time. An oscilloscope is a tool commonly used to visualize real-world signals in the time domain. A time-domain graph shows how a signal changes with time, whereas a frequency-domain graph shows how much of the signal lies within each given frequency band over a range of frequencies.

Contents

Though most precisely referring to time in physics, the term time domain may occasionally informally refer to position in space when dealing with spatial frequencies, as a substitute for the more precise term spatial domain.
Origin of term

The use of the contrasting terms time domain and frequency domain developed in U.S. communication engineering in the late 1940s, with the terms appearing together without definition by 1950. [1] When an analysis uses the second or one of its multiples as a unit of measurement, then it is in the time domain. When analysis concerns the reciprocal units such as Hertz, then it is in the frequency domain.

See also

Related Research Articles

Digital signal processing (DSP) is the use of digital processing, such as by computers or more specialized digital signal processors, to perform a wide variety of signal processing operations. The digital signals processed in this manner are a sequence of numbers that represent samples of a continuous variable in a domain such as time, space, or frequency. In digital electronics, a digital signal is represented as a pulse train, which is typically generated by the switching of a transistor.

Linear filters process time-varying input signals to produce output signals, subject to the constraint of linearity. In most cases these linear filters are also time invariant in which case they can be analyzed exactly using LTI system theory revealing their transfer functions in the frequency domain and their impulse responses in the time domain. Real-time implementations of such linear signal processing filters in the time domain are inevitably causal, an additional constraint on their transfer functions. An analog electronic circuit consisting only of linear components will necessarily fall in this category, as will comparable mechanical systems or digital signal processing systems containing only linear elements. Since linear time-invariant filters can be completely characterized by their response to sinusoids of different frequencies, they are sometimes known as frequency filters.

<span class="mw-page-title-main">Fourier analysis</span> Branch of mathematics

In mathematics, Fourier analysis is the study of the way general functions may be represented or approximated by sums of simpler trigonometric functions. Fourier analysis grew from the study of Fourier series, and is named after Joseph Fourier, who showed that representing a function as a sum of trigonometric functions greatly simplifies the study of heat transfer.

Harmonic analysis is a branch of mathematics concerned with the representation of functions or signals as the superposition of basic waves, and the study of and generalization of the notions of Fourier series and Fourier transforms. In the past two centuries, it has become a vast subject with applications in areas as diverse as number theory, representation theory, signal processing, quantum mechanics, tidal analysis and neuroscience.

In engineering, a transfer function of a system, sub-system, or component is a mathematical function that theoretically models the system's output for each possible input. They are widely used in electronics and control systems. In some simple cases, this function is a two-dimensional graph of an independent scalar input versus the dependent scalar output, called a transfer curve or characteristic curve. Transfer functions for components are used to design and analyze systems assembled from components, particularly using the block diagram technique, in electronics and control theory.

<span class="mw-page-title-main">Fourier transform</span> Mathematical transform that expresses a function of time as a function of frequency

A Fourier transform (FT) is a mathematical transform that decomposes functions depending on space or time into functions depending on spatial frequency or temporal frequency. That process is also called analysis. An example application would be decomposing the waveform of a musical chord into terms of the intensity of its constituent pitches. The term Fourier transform refers to both the frequency domain representation and the mathematical operation that associates the frequency domain representation to a function of space or time.

<span class="mw-page-title-main">Aliasing</span> Signal processing effect

In signal processing and related disciplines, aliasing is an effect that causes different signals to become indistinguishable when sampled. It also often refers to the distortion or artifact that results when a signal reconstructed from samples is different from the original continuous signal.

In mathematics and signal processing, the Z-transform converts a discrete-time signal, which is a sequence of real or complex numbers, into a complex frequency-domain representation.

<span class="mw-page-title-main">Spectral density</span> Relative importance of certain frequencies in a composite signal

The power spectrum of a time series describes the distribution of power into frequency components composing that signal. According to Fourier analysis, any physical signal can be decomposed into a number of discrete frequencies, or a spectrum of frequencies over a continuous range. The statistical average of a certain signal or sort of signal as analyzed in terms of its frequency content, is called its spectrum.

<span class="mw-page-title-main">Window function</span> Function used in signal processing

In signal processing and statistics, a window function is a mathematical function that is zero-valued outside of some chosen interval, normally symmetric around the middle of the interval, usually near a maximum in the middle, and usually tapering away from the middle. Mathematically, when another function or waveform/data-sequence is "multiplied" by a window function, the product is also zero-valued outside the interval: all that is left is the part where they overlap, the "view through the window". Equivalently, and in actual practice, the segment of data within the window is first isolated, and then only that data is multiplied by the window function values. Thus, tapering, not segmentation, is the main purpose of window functions.

In signal processing and electronics, the frequency response of a system is the quantitative measure of the magnitude and phase of the output as a function of input frequency. The frequency response is widely used in the design and analysis of systems, such as audio and control systems, where they simplify mathematical analysis by converting governing differential equations into algebraic equations. In an audio system, it may be used to minimize audible distortion by designing components so that the overall response is as flat (uniform) as possible across the system's bandwidth. In control systems, such as a vehicle's cruise control, it may be used to assess system stability, often through the use of Bode plots. Systems with a specific frequency response can be designed using analog and digital filters.

<span class="mw-page-title-main">Frequency domain</span> Signal representation

In physics, electronics, control systems engineering, and statistics, the frequency domain refers to the analysis of mathematical functions or signals with respect to frequency, rather than time. Put simply, a time-domain graph shows how a signal changes over time, whereas a frequency-domain graph shows how much of the signal lies within each given frequency band over a range of frequencies. A frequency-domain representation can also include information on the phase shift that must be applied to each sinusoid in order to be able to recombine the frequency components to recover the original time signal.

Analog signal processing is a type of signal processing conducted on continuous analog signals by some analog means. "Analog" indicates something that is mathematically represented as a set of continuous values. This differs from "digital" which uses a series of discrete quantities to represent signal. Analog values are typically represented as a voltage, electric current, or electric charge around components in the electronic devices. An error or noise affecting such physical quantities will result in a corresponding error in the signals represented by such physical quantities.

<span class="mw-page-title-main">Time series</span> Sequence of data points over time

In mathematics, a time series is a series of data points indexed in time order. Most commonly, a time series is a sequence taken at successive equally spaced points in time. Thus it is a sequence of discrete-time data. Examples of time series are heights of ocean tides, counts of sunspots, and the daily closing value of the Dow Jones Industrial Average.

<span class="mw-page-title-main">Spectral leakage</span> Effect in signal processing

The Fourier transform of a function of time, s(t), is a complex-valued function of frequency, S(f), often referred to as a frequency spectrum. Any linear time-invariant operation on s(t) produces a new spectrum of the form H(f)•S(f), which changes the relative magnitudes and/or angles (phase) of the non-zero values of S(f). Any other type of operation creates new frequency components that may be referred to as spectral leakage in the broadest sense. Sampling, for instance, produces leakage, which we call aliases of the original spectral component. For Fourier transform purposes, sampling is modeled as a product between s(t) and a Dirac comb function. The spectrum of a product is the convolution between S(f) and another function, which inevitably creates the new frequency components. But the term 'leakage' usually refers to the effect of windowing, which is the product of s(t) with a different kind of function, the window function. Window functions happen to have finite duration, but that is not necessary to create leakage. Multiplication by a time-variant function is sufficient.

<span class="mw-page-title-main">Impulse response</span>

In signal processing, the impulse response, or impulse response function (IRF), of a dynamic system is its output when presented with a brief input signal, called an impulse. More generally, an impulse response is the reaction of any dynamic system in response to some external change. In both cases, the impulse response describes the reaction of the system as a function of time.

In signal processing, time–frequency analysis comprises those techniques that study a signal in both the time and frequency domains simultaneously, using various time–frequency representations. Rather than viewing a 1-dimensional signal and some transform, time–frequency analysis studies a two-dimensional signal – a function whose domain is the two-dimensional real plane, obtained from the signal via a time–frequency transform.

<span class="mw-page-title-main">Spatial frequency</span> Characteristic of any structure that is periodic across a position in space

In mathematics, physics, and engineering, spatial frequency is a characteristic of any structure that is periodic across position in space. The spatial frequency is a measure of how often sinusoidal components of the structure repeat per unit of distance. The SI unit of spatial frequency is cycles per meter (m). In image-processing applications, spatial frequency is often expressed in units of cycles per millimeter (mm) or equivalently line pairs per mm.

<span class="mw-page-title-main">Optical transfer function</span> Function that specifies how different spatial frequencies are handled by an optical system

The optical transfer function (OTF) of an optical system such as a camera, microscope, human eye, or projector specifies how different spatial frequencies are handled by the system. It is used by optical engineers to describe how the optics project light from the object or scene onto a photographic film, detector array, retina, screen, or simply the next item in the optical transmission chain. A variant, the modulation transfer function (MTF), neglects phase effects, but is equivalent to the OTF in many situations.

References

  1. Lee, Y. W.; Cheatham, T. P., Jr.; Wiesner, J. B. (1950). "Application of Correlation Analysis to the Detection of Periodic Signals in Noise". Proceedings of the IRE. 38 (10): 1165–1171. doi:10.1109/JRPROC.1950.233423. S2CID   51671133.