Discrete time and continuous time

Last updated

In mathematical dynamics, discrete time and continuous time are two alternative frameworks within which variables that evolve over time are modeled.

Contents

Discrete time

Discrete sampled signal Sampled.signal.svg
Discrete sampled signal

Discrete time views values of variables as occurring at distinct, separate "points in time", or equivalently as being unchanged throughout each non-zero region of time ("time period")that is, time is viewed as a discrete variable. Thus a non-time variable jumps from one value to another as time moves from one time period to the next. This view of time corresponds to a digital clock that gives a fixed reading of 10:37 for a while, and then jumps to a new fixed reading of 10:38, etc. In this framework, each variable of interest is measured once at each time period. The number of measurements between any two time periods is finite. Measurements are typically made at sequential integer values of the variable "time".

A discrete signal or discrete-time signal is a time series consisting of a sequence of quantities.

Unlike a continuous-time signal, a discrete-time signal is not a function of a continuous argument; however, it may have been obtained by sampling from a continuous-time signal. When a discrete-time signal is obtained by sampling a sequence at uniformly spaced times, it has an associated sampling rate.

Discrete-time signals may have several origins, but can usually be classified into one of two groups: [1]

Continuous time

In contrast, continuous time views variables as having a particular value only for an infinitesimally short amount of time. Between any two points in time there are an infinite number of other points in time. The variable "time" ranges over the entire real number line, or depending on the context, over some subset of it such as the non-negative reals. Thus time is viewed as a continuous variable.

A continuous signal or a continuous-time signal is a varying quantity (a signal) whose domain, which is often time, is a continuum (e.g., a connected interval of the reals). That is, the function's domain is an uncountable set. The function itself need not to be continuous. To contrast, a discrete-time signal has a countable domain, like the natural numbers.

A signal of continuous amplitude and time is known as a continuous-time signal or an analog signal. This (a signal) will have some value at every instant of time. The electrical signals derived in proportion with the physical quantities such as temperature, pressure, sound etc. are generally continuous signals. Other examples of continuous signals are sine wave, cosine wave, triangular wave etc.

The signal is defined over a domain, which may or may not be finite, and there is a functional mapping from the domain to the value of the signal. The continuity of the time variable, in connection with the law of density of real numbers, means that the signal value can be found at any arbitrary point in time.

A typical example of an infinite duration signal is:

A finite duration counterpart of the above signal could be:

and otherwise.

The value of a finite (or infinite) duration signal may or may not be finite. For example,

and otherwise,

is a finite duration signal but it takes an infinite value for .

In many disciplines, the convention is that a continuous signal must always have a finite value, which makes more sense in the case of physical signals.

For some purposes, infinite singularities are acceptable as long as the signal is integrable over any finite interval (for example, the signal is not integrable at infinity, but is).

Any analog signal is continuous by nature. Discrete-time signals, used in digital signal processing, can be obtained by sampling and quantization of continuous signals.

Continuous signal may also be defined over an independent variable other than time. Another very common independent variable is space and is particularly useful in image processing, where two space dimensions are used.

Relevant contexts

Discrete time is often employed when empirical measurements are involved, because normally it is only possible to measure variables sequentially. For example, while economic activity actually occurs continuously, there being no moment when the economy is totally in a pause, it is only possible to measure economic activity discretely. For this reason, published data on, for example, gross domestic product will show a sequence of quarterly values.

When one attempts to empirically explain such variables in terms of other variables and/or their own prior values, one uses time series or regression methods in which variables are indexed with a subscript indicating the time period in which the observation occurred. For example, yt might refer to the value of income observed in unspecified time period t, y3 to the value of income observed in the third time period, etc.

Moreover, when a researcher attempts to develop a theory to explain what is observed in discrete time, often the theory itself is expressed in discrete time in order to facilitate the development of a time series or regression model.

On the other hand, it is often more mathematically tractable to construct theoretical models in continuous time, and often in areas such as physics an exact description requires the use of continuous time. In a continuous time context, the value of a variable y at an unspecified point in time is denoted as y(t) or, when the meaning is clear, simply as y.

Types of equations

Discrete time

Discrete time makes use of difference equations, also known as recurrence relations. An example, known as the logistic map or logistic equation, is

in which r is a parameter in the range from 2 to 4 inclusive, and x is a variable in the range from 0 to 1 inclusive whose value in period t nonlinearly affects its value in the next period, t+1. For example, if and , then for t=1 we have , and for t=2 we have .

Another example models the adjustment of a price P in response to non-zero excess demand for a product as

where is the positive speed-of-adjustment parameter which is less than or equal to 1, and where is the excess demand function.

Continuous time

Continuous time makes use of differential equations. For example, the adjustment of a price P in response to non-zero excess demand for a product can be modeled in continuous time as

where the left side is the first derivative of the price with respect to time (that is, the rate of change of the price), is the speed-of-adjustment parameter which can be any positive finite number, and is again the excess demand function.

Graphical depiction

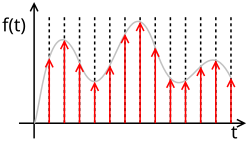
A variable measured in discrete time can be plotted as a step function, in which each time period is given a region on the horizontal axis of the same length as every other time period, and the measured variable is plotted as a height that stays constant throughout the region of the time period. In this graphical technique, the graph appears as a sequence of horizontal steps. Alternatively, each time period can be viewed as a detached point in time, usually at an integer value on the horizontal axis, and the measured variable is plotted as a height above that time-axis point. In this technique, the graph appears as a set of dots.

The values of a variable measured in continuous time are plotted as a continuous function, since the domain of time is considered to be the entire real axis or at least some connected portion of it.

See also

Related Research Articles

<span class="mw-page-title-main">Autocorrelation</span> Correlation of a signal with a time-shifted copy of itself, as a function of shift

Autocorrelation, sometimes known as serial correlation in the discrete time case, is the correlation of a signal with a delayed copy of itself as a function of delay. Informally, it is the similarity between observations of a random variable as a function of the time lag between them. The analysis of autocorrelation is a mathematical tool for finding repeating patterns, such as the presence of a periodic signal obscured by noise, or identifying the missing fundamental frequency in a signal implied by its harmonic frequencies. It is often used in signal processing for analyzing functions or series of values, such as time domain signals.

Linear filters process time-varying input signals to produce output signals, subject to the constraint of linearity. In most cases these linear filters are also time invariant in which case they can be analyzed exactly using LTI system theory revealing their transfer functions in the frequency domain and their impulse responses in the time domain. Real-time implementations of such linear signal processing filters in the time domain are inevitably causal, an additional constraint on their transfer functions. An analog electronic circuit consisting only of linear components will necessarily fall in this category, as will comparable mechanical systems or digital signal processing systems containing only linear elements. Since linear time-invariant filters can be completely characterized by their response to sinusoids of different frequencies, they are sometimes known as frequency filters.

<span class="mw-page-title-main">Fourier analysis</span> Branch of mathematics

In mathematics, Fourier analysis is the study of the way general functions may be represented or approximated by sums of simpler trigonometric functions. Fourier analysis grew from the study of Fourier series, and is named after Joseph Fourier, who showed that representing a function as a sum of trigonometric functions greatly simplifies the study of heat transfer.

<span class="mw-page-title-main">Probability theory</span> Branch of mathematics concerning probability

Probability theory or probability calculus is the branch of mathematics concerned with probability. Although there are several different probability interpretations, probability theory treats the concept in a rigorous mathematical manner by expressing it through a set of axioms. Typically these axioms formalise probability in terms of a probability space, which assigns a measure taking values between 0 and 1, termed the probability measure, to a set of outcomes called the sample space. Any specified subset of the sample space is called an event.

<span class="mw-page-title-main">Probability distribution</span> Mathematical function for the probability a given outcome occurs in an experiment

In probability theory and statistics, a probability distribution is the mathematical function that gives the probabilities of occurrence of different possible outcomes for an experiment. It is a mathematical description of a random phenomenon in terms of its sample space and the probabilities of events.

<span class="mw-page-title-main">Random variable</span> Variable representing a random phenomenon

A random variable is a mathematical formalization of a quantity or object which depends on random events. The term 'random variable' can be misleading as its mathematical definition is not actually random nor a variable, but rather it is a function from possible outcomes in a sample space to a measurable space, often to the real numbers.

<span class="mw-page-title-main">Signal processing</span> Field of electrical engineering

Signal processing is an electrical engineering subfield that focuses on analyzing, modifying and synthesizing signals, such as sound, images, potential fields, seismic signals, altimetry processing, and scientific measurements. Signal processing techniques are used to optimize transmissions, digital storage efficiency, correcting distorted signals, subjective video quality, and to also detect or pinpoint components of interest in a measured signal.

<span class="mw-page-title-main">White noise</span> Type of signal in signal processing

In signal processing, white noise is a random signal having equal intensity at different frequencies, giving it a constant power spectral density. The term is used with this or similar meanings in many scientific and technical disciplines, including physics, acoustical engineering, telecommunications, and statistical forecasting. White noise refers to a statistical model for signals and signal sources, rather than to any specific signal. White noise draws its name from white light, although light that appears white generally does not have a flat power spectral density over the visible band.

In mathematics and signal processing, the Z-transform converts a discrete-time signal, which is a sequence of real or complex numbers, into a complex valued frequency-domain representation.

<span class="mw-page-title-main">Spectral density</span> Relative importance of certain frequencies in a composite signal

In signal processing, the power spectrum of a continuous time signal describes the distribution of power into frequency components composing that signal. According to Fourier analysis, any physical signal can be decomposed into a number of discrete frequencies, or a spectrum of frequencies over a continuous range. The statistical average of any sort of signal as analyzed in terms of its frequency content, is called its spectrum.

<span class="mw-page-title-main">Signal</span> Varying physical quantity that conveys information

Signal refers to both the process and the result of transmission of data over some media accomplished by embedding some variation. Signals are important in multiple subject fields including signal processing, information theory and biology.

In mathematics and statistics, a stationary process is a stochastic process whose unconditional joint probability distribution does not change when shifted in time. Consequently, parameters such as mean and variance also do not change over time. If you draw a line through the middle of a stationary process then it should be flat; it may have 'seasonal' cycles around the trend line, but overall it does not trend up nor down.

Analog signal processing is a type of signal processing conducted on continuous analog signals by some analog means. "Analog" indicates something that is mathematically represented as a set of continuous values. This differs from "digital" which uses a series of discrete quantities to represent signal. Analog values are typically represented as a voltage, electric current, or electric charge around components in the electronic devices. An error or noise affecting such physical quantities will result in a corresponding error in the signals represented by such physical quantities.

In numerical analysis, computational physics, and simulation, discretization error is the error resulting from the fact that a function of a continuous variable is represented in the computer by a finite number of evaluations, for example, on a lattice. Discretization error can usually be reduced by using a more finely spaced lattice, with an increased computational cost.

Infinite impulse response (IIR) is a property applying to many linear time-invariant systems that are distinguished by having an impulse response that does not become exactly zero past a certain point but continues indefinitely. This is in contrast to a finite impulse response (FIR) system, in which the impulse response does become exactly zero at times for some finite , thus being of finite duration. Common examples of linear time-invariant systems are most electronic and digital filters. Systems with this property are known as IIR systems or IIR filters.

<span class="mw-page-title-main">Comb filter</span> Signal processing filter

In signal processing, a comb filter is a filter implemented by adding a delayed version of a signal to itself, causing constructive and destructive interference. The frequency response of a comb filter consists of a series of regularly spaced notches in between regularly spaced peaks giving the appearance of a comb.

In mathematics, the discrete-time Fourier transform (DTFT) is a form of Fourier analysis that is applicable to a sequence of discrete values.

In probability theory, random element is a generalization of the concept of random variable to more complicated spaces than the simple real line. The concept was introduced by Maurice Fréchet who commented that the “development of probability theory and expansion of area of its applications have led to necessity to pass from schemes where (random) outcomes of experiments can be described by number or a finite set of numbers, to schemes where outcomes of experiments represent, for example, vectors, functions, processes, fields, series, transformations, and also sets or collections of sets.”

<span class="mw-page-title-main">Gaussian filter</span> Filter in electronics and signal processing

In electronics and signal processing, mainly in digital signal processing, a Gaussian filter is a filter whose impulse response is a Gaussian function. Gaussian filters have the properties of having no overshoot to a step function input while minimizing the rise and fall time. This behavior is closely connected to the fact that the Gaussian filter has the minimum possible group delay. A Gaussian filter will have the best combination of suppression of high frequencies while also minimizing spatial spread, being the critical point of the uncertainty principle. These properties are important in areas such as oscilloscopes and digital telecommunication systems.

<span class="mw-page-title-main">Continuous or discrete variable</span> Types of quantitative variables in mathematics

In mathematics and statistics, a quantitative variable may be continuous or discrete if they are typically obtained by measuring or counting, respectively. If it can take on two particular real values such that it can also take on all real values between them, the variable is continuous in that interval. If it can take on a value such that there is a non-infinitesimal gap on each side of it containing no values that the variable can take on, then it is discrete around that value. In some contexts a variable can be discrete in some ranges of the number line and continuous in others.

References

  1. "Digital Signal Processing", Prentice Hall - pages 11–12
  2. "Digital Signal Processing: Instant access", Butterworth-Heinemann - page 8