Cluster sampling

Last updated
Cluster sampling. A group of twelve people are divided into pairs, and two pairs are then selected at random. Cluster sampling.PNG
Cluster sampling. A group of twelve people are divided into pairs, and two pairs are then selected at random.

In statistics, cluster sampling is a sampling plan used when mutually homogeneous yet internally heterogeneous groupings are evident in a statistical population. It is often used in marketing research.

Contents

In this sampling plan, the total population is divided into these groups (known as clusters) and a simple random sample of the groups is selected. The elements in each cluster are then sampled. If all elements in each sampled cluster are sampled, then this is referred to as a "one-stage" cluster sampling plan. If a simple random subsample of elements is selected within each of these groups, this is referred to as a "two-stage" cluster sampling plan. A common motivation for cluster sampling is to reduce the total number of interviews and costs given the desired accuracy. For a fixed sample size, the expected random error is smaller when most of the variation in the population is present internally within the groups, and not between the groups.

Cluster elemental

The population within a cluster should ideally be as heterogeneous as possible, but there should be homogeneity between clusters. Each cluster should be a small-scale representation of the total population. The clusters should be mutually exclusive and collectively exhaustive. A random sampling technique is then used on any relevant clusters to choose which clusters to include in the study. In single-stage cluster sampling, all the elements from each of the selected clusters are sampled. In two-stage cluster sampling, a random sampling technique is applied to the elements from each of the selected clusters.

The main difference between cluster sampling and stratified sampling is that in cluster sampling the cluster is treated as the sampling unit so sampling is done on a population of clusters (at least in the first stage). In stratified sampling, the sampling is done on elements within each stratum. In stratified sampling, a random sample is drawn from each of the strata, whereas in cluster sampling only the selected clusters are sampled. A common motivation for cluster sampling is to reduce costs by increasing sampling efficiency. This contrasts with stratified sampling where the motivation is to increase precision.

There is also multistage cluster sampling, where at least two stages are taken in selecting elements from clusters.

When clusters are of different sizes

Without modifying the estimated parameter, cluster sampling is unbiased when the clusters are approximately the same size. In this case, the parameter is computed by combining all the selected clusters. When the clusters are of different sizes there are several options:

One method is to sample clusters and then survey all elements in that cluster. Another method is a two-stage method of sampling a fixed proportion of units (be it 5% or 50%, or another number, depending on cost considerations) from within each of the selected clusters. Relying on the sample drawn from these options will yield an unbiased estimator. However, the sample size is no longer fixed upfront. This leads to a more complicated formula for the standard error of the estimator, as well as issues with the optics of the study plan (since the power analysis and the cost estimations often relate to a specific sample size).

A third possible solution is to use probability proportionate to size sampling. In this sampling plan, the probability of selecting a cluster is proportional to its size, so a large cluster has a greater probability of selection than a small cluster. The advantage here is that when clusters are selected with probability proportionate to size, the same number of interviews should be carried out in each sampled cluster so that each unit sampled has the same probability of selection.

Applications of cluster sampling

An example of cluster sampling is area sampling or geographical cluster sampling. Each cluster is a geographical area in an area sampling frame. Because a geographically dispersed population can be expensive to survey, greater economy than simple random sampling can be achieved by grouping several respondents within a local area into a cluster. It is usually necessary to increase the total sample size to achieve equivalent precision in the estimators, but cost savings may make such an increase in sample size feasible.

For the organization of a population census, the first step is usually dividing the overall geographic area into enumeration areas or census tracts for the field work organization. Enumeration areas may be also useful as first-stage units for cluster sampling in many types of surveys. When a population census is outdated, the list of individuals should not be directly used as sampling frame for a socio-economic survey. Updating the whole census is economically unfeasible. A good alternative may be keeping the old enumeration areas, with some update in highly dynamic areas, such as urban suburbs, selecting a sample of enumeration areas and updating the list of individuals or households only in the selected enumeration areas. [1]

Cluster sampling is used to estimate low mortalities in cases such as wars, famines and natural disasters. [2]

Fisheries science

It is almost impossible to take a simple random sample of fish from a population, which would require that individuals are captured individually and at random. [3] This is because fishing gears capture fish in groups (or clusters).

In commercial fisheries sampling, the costs of operating at sea are often too large to select hauls individually and at random. Therefore, observations are further clustered by either vessel or fishing trip.

Advantages

Major use: when the sampling frame of all elements is not available we can resort only to cluster sampling.

Disadvantages

More on cluster sampling

Two-stage cluster sampling

Two-stage cluster sampling, a simple case of multistage sampling, is obtained by selecting cluster samples in the first stage and then selecting a sample of elements from every sampled cluster. Consider a population of N clusters in total. In the first stage, n clusters are selected using the ordinary cluster sampling method. In the second stage, simple random sampling is usually used. [5] It is used separately in every cluster and the numbers of elements selected from different clusters are not necessarily equal. The total number of clusters N, the number of clusters selected n, and the numbers of elements from selected clusters need to be pre-determined by the survey designer. Two-stage cluster sampling aims at minimizing survey costs and at the same time controlling the uncertainty related to estimates of interest. [6] This method can be used in health and social sciences. For instance, researchers used two-stage cluster sampling to generate a representative sample of the Iraqi population to conduct mortality surveys. [7] Sampling in this method can be quicker and more reliable than other methods, which is why this method is now used frequently.

Inference when the number of clusters is small

Cluster sampling methods can lead to significant bias when working with a small number of clusters. For instance, it can be necessary to cluster at the state or city-level, units that may be small and fixed in number. Microeconometrics methods for panel data often use short panels, which is analogous to having few observations per clusters and many clusters. The small cluster problem can be viewed as an incidental parameter problem. [8] While the point estimates can be reasonably precisely estimated, if the number of observations per cluster is sufficiently high, we need the number of clusters for the asymptotics to kick in. If the number of clusters is low the estimated covariance matrix can be downward biased. [9]

Small numbers of clusters are a risk when there is serial correlation or when there is intraclass correlation as in the Moulton context. When having few clusters, we tend to underestimate serial correlation across observations when a random shock occurs, or the intraclass correlation in a Moulton setting. [10] Several studies have highlighted the consequences of serial correlation and highlighted the small-cluster problem. [11] [12]

In the framework of the Moulton factor, an intuitive explanation of the small cluster problem can be derived from the formula for the Moulton factor. Assume for simplicity that the number of observations per cluster is fixed at n. Below, stands for the covariance matrix adjusted for clustering, stands for the covariance matrix not adjusted for clustering, and ρ stands for the intraclass correlation:

The ratio on the left-hand side indicates how much the unadjusted scenario overestimates the precision. Therefore, a high number means a strong downward bias of the estimated covariance matrix. A small cluster problem can be interpreted as a large n: when the data is fixed and the number of clusters is low, the number of data within a cluster can be high. It follows that inference, when the number of clusters is small, will not have the correct coverage. [10]

Several solutions for the small cluster problem have been proposed. One can use a bias-corrected cluster-robust variance matrix, make T-distribution adjustments, or use bootstrap methods with asymptotic refinements, such as the percentile-t or wild bootstrap, that can lead to improved finite sample inference. [9] Cameron, Gelbach and Miller (2008) provide microsimulations for different methods and find that the wild bootstrap performs well in the face of a small number of clusters. [13]

See also

Related Research Articles

<span class="mw-page-title-main">Stratified sampling</span> Sampling from a population which can be partitioned into subpopulations

In statistics, stratified sampling is a method of sampling from a population which can be partitioned into subpopulations.

The weighted arithmetic mean is similar to an ordinary arithmetic mean, except that instead of each of the data points contributing equally to the final average, some data points contribute more than others. The notion of weighted mean plays a role in descriptive statistics and also occurs in a more general form in several other areas of mathematics.

In statistics, multistage sampling is the taking of samples in stages using smaller and smaller sampling units at each stage.

<span class="mw-page-title-main">Sampling (statistics)</span> Selection of data points in statistics.

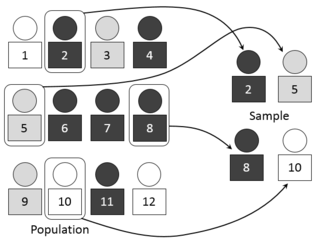
In statistics, quality assurance, and survey methodology, sampling is the selection of a subset or a statistical sample of individuals from within a statistical population to estimate characteristics of the whole population. Statisticians attempt to collect samples that are representative of the population. Sampling has lower costs and faster data collection compared to recording data from the entire population, and thus, it can provide insights in cases where it is infeasible to measure an entire population.

<span class="mw-page-title-main">Pearson correlation coefficient</span> Measure of linear correlation

In statistics, the Pearson correlation coefficient (PCC) is a correlation coefficient that measures linear correlation between two sets of data. It is the ratio between the covariance of two variables and the product of their standard deviations; thus, it is essentially a normalized measurement of the covariance, such that the result always has a value between −1 and 1. As with covariance itself, the measure can only reflect a linear correlation of variables, and ignores many other types of relationships or correlations. As a simple example, one would expect the age and height of a sample of teenagers from a high school to have a Pearson correlation coefficient significantly greater than 0, but less than 1.

In statistics, sometimes the covariance matrix of a multivariate random variable is not known but has to be estimated. Estimation of covariance matrices then deals with the question of how to approximate the actual covariance matrix on the basis of a sample from the multivariate distribution. Simple cases, where observations are complete, can be dealt with by using the sample covariance matrix. The sample covariance matrix (SCM) is an unbiased and efficient estimator of the covariance matrix if the space of covariance matrices is viewed as an extrinsic convex cone in Rp×p; however, measured using the intrinsic geometry of positive-definite matrices, the SCM is a biased and inefficient estimator. In addition, if the random variable has a normal distribution, the sample covariance matrix has a Wishart distribution and a slightly differently scaled version of it is the maximum likelihood estimate. Cases involving missing data, heteroscedasticity, or autocorrelated residuals require deeper considerations. Another issue is the robustness to outliers, to which sample covariance matrices are highly sensitive.

This glossary of statistics and probability is a list of definitions of terms and concepts used in the mathematical sciences of statistics and probability, their sub-disciplines, and related fields. For additional related terms, see Glossary of mathematics and Glossary of experimental design.

In statistics, resampling is the creation of new samples based on one observed sample. Resampling methods are:

  1. Permutation tests
  2. Bootstrapping
  3. Cross validation

Bootstrapping is any test or metric that uses random sampling with replacement, and falls under the broader class of resampling methods. Bootstrapping assigns measures of accuracy to sample estimates. This technique allows estimation of the sampling distribution of almost any statistic using random sampling methods.

<span class="mw-page-title-main">Intraclass correlation</span> Descriptive statistic

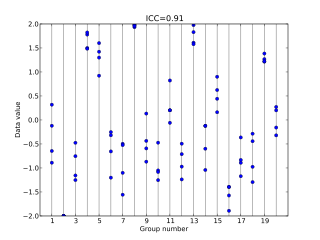
In statistics, the intraclass correlation, or the intraclass correlation coefficient (ICC), is a descriptive statistic that can be used when quantitative measurements are made on units that are organized into groups. It describes how strongly units in the same group resemble each other. While it is viewed as a type of correlation, unlike most other correlation measures, it operates on data structured as groups rather than data structured as paired observations.

Forest inventory is the systematic collection of data and forest information for assessment or analysis. An estimate of the value and possible uses of timber is an important part of the broader information required to sustain ecosystems. When taking forest inventory the following are important things to measure and note: species, diameter at breast height (DBH), height, site quality, age, and defects. From the data collected one can calculate the number of trees per acre, the basal area, the volume of trees in an area, and the value of the timber. Inventories can be done for other reasons than just calculating the value. A forest can be cruised to visually assess timber and determine potential fire hazards and the risk of fire. The results of this type of inventory can be used in preventive actions and also awareness. Wildlife surveys can be undertaken in conjunction with timber inventory to determine the number and type of wildlife within a forest. The aim of the statistical forest inventory is to provide comprehensive information about the state and dynamics of forests for strategic and management planning. Merely looking at the forest for assessment is called taxation.

The Heckman correction is a statistical technique to correct bias from non-randomly selected samples or otherwise incidentally truncated dependent variables, a pervasive issue in quantitative social sciences when using observational data. Conceptually, this is achieved by explicitly modelling the individual sampling probability of each observation together with the conditional expectation of the dependent variable. The resulting likelihood function is mathematically similar to the tobit model for censored dependent variables, a connection first drawn by James Heckman in 1974. Heckman also developed a two-step control function approach to estimate this model, which avoids the computational burden of having to estimate both equations jointly, albeit at the cost of inefficiency. Heckman received the Nobel Memorial Prize in Economic Sciences in 2000 for his work in this field.

In statistics, a simple random sample is a subset of individuals chosen from a larger set in which a subset of individuals are chosen randomly, all with the same probability. It is a process of selecting a sample in a random way. In SRS, each subset of k individuals has the same probability of being chosen for the sample as any other subset of k individuals. Simple random sampling is a basic type of sampling and can be a component of other more complex sampling methods.

In survey methodology, the design effect is a measure of the expected impact of a sampling design on the variance of an estimator for some parameter. It is calculated as the ratio of the variance of an estimator based on a sample from an (often) complex sampling design, to the variance of an alternative estimator based on a simple random sample (SRS) of the same number of elements. The can be used to adjust the variance of an estimator in cases where the sample is not drawn using simple random sampling. It may also be useful in sample size calculations and for quantifying the representativeness of a sample. The term "design effect" was coined by Leslie Kish in 1965.

In statistics, the Horvitz–Thompson estimator, named after Daniel G. Horvitz and Donovan J. Thompson, is a method for estimating the total and mean of a pseudo-population in a stratified sample by applying inverse probability weighting to account for the difference in the sampling distribution between the collected data and the a target population. The Horvitz–Thompson estimator is frequently applied in survey analyses and can be used to account for missing data, as well as many sources of unequal selection probabilities.

The ratio estimator is a statistical estimator for the ratio of means of two random variables. Ratio estimates are biased and corrections must be made when they are used in experimental or survey work. The ratio estimates are asymmetrical and symmetrical tests such as the t test should not be used to generate confidence intervals.

Out-of-bag (OOB) error, also called out-of-bag estimate, is a method of measuring the prediction error of random forests, boosted decision trees, and other machine learning models utilizing bootstrap aggregating (bagging). Bagging uses subsampling with replacement to create training samples for the model to learn from. OOB error is the mean prediction error on each training sample xi, using only the trees that did not have xi in their bootstrap sample.

<span class="mw-page-title-main">Stratified randomization</span>

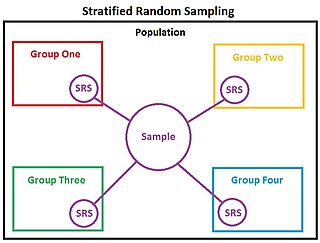
In statistics, stratified randomization is a method of sampling which first stratifies the whole study population into subgroups with same attributes or characteristics, known as strata, then followed by simple random sampling from the stratified groups, where each element within the same subgroup are selected unbiasedly during any stage of the sampling process, randomly and entirely by chance. Stratified randomization is considered a subdivision of stratified sampling, and should be adopted when shared attributes exist partially and vary widely between subgroups of the investigated population, so that they require special considerations or clear distinctions during sampling. This sampling method should be distinguished from cluster sampling, where a simple random sample of several entire clusters is selected to represent the whole population, or stratified systematic sampling, where a systematic sampling is carried out after the stratification process. Stratified random sampling is sometimes also known as "quota random sampling".

<span class="mw-page-title-main">Homoscedasticity and heteroscedasticity</span> Statistical property

In statistics, a sequence of random variables is homoscedastic if all its random variables have the same finite variance; this is also known as homogeneity of variance. The complementary notion is called heteroscedasticity, also known as heterogeneity of variance. The spellings homoskedasticity and heteroskedasticity are also frequently used. Assuming a variable is homoscedastic when in reality it is heteroscedastic results in unbiased but inefficient point estimates and in biased estimates of standard errors, and may result in overestimating the goodness of fit as measured by the Pearson coefficient.

References

  1. "HANDBOOK ON Master Sampling Frames for Agricultural Statistics - PDF Free Download". docplayer.net. Retrieved 2024-01-10.
  2. David Brown, Study Claims Iraq's 'Excess' Death Toll Has Reached 655,000, Washington Post, Wednesday, October 11, 2006. Retrieved September 14, 2010.
  3. Nelson, Gary A. (July 2014). "Cluster Sampling: A Pervasive, Yet Little Recognized Survey Design in Fisheries Research". Transactions of the American Fisheries Society. 143 (4): 926–938. Bibcode:2014TrAFS.143..926N. doi:10.1080/00028487.2014.901252.
  4. Kerry and Bland (1998). Statistics notes: The intracluster correlation coefficient in cluster randomization. British Medical Journal, 316, 1455–1460.
  5. Ahmed, Saifuddin (2009). Methods in Sample Surveys (PDF). The Johns Hopkins University and Saifuddin Ahmed. Archived (PDF) from the original on 2013-09-28.
  6. Daniel Pfeffermann; C. Radhakrishna Rao (2009). Handbook of Statistics Vol.29A Sample Surveys: Theory, Methods and Infernece. Elsevier B.V. ISBN   978-0-444-53124-7.
  7. LP Galway; Nathaniel Bell; Al S SAE; Amy Hagopian; Gilbert Burnham; Abraham Flaxman; Wiliam M Weiss; Julie Rajaratnam; Tim K Takaro (27 April 2012). "A two-stage cluster sampling method using gridded population data, a GIS, and Google EarthTM imagery in a population-based mortality survey in Iraq". International Journal of Health Geographics. 11: 12. doi: 10.1186/1476-072X-11-12 . PMC   3490933 . PMID   22540266.
  8. Cameron A. C. and P. K. Trivedi (2005): Microeconometrics: Methods and Applications. Cambridge University Press, New York.
  9. 1 2 Cameron, C. and D. L. Miller (2015): A Practitioner's Guide to Cluster-Robust Inference. Journal of Human Resources 50(2), pp. 317–372.
  10. 1 2 Angrist, J.D. and J.-S. Pischke (2009): Mostly Harmless Econometrics. An empiricist's companion. Princeton University Press, New Jersey.
  11. Bertrand, M., E. Duflo and S. Mullainathan (2004): How Much Should We Trust Differences-in-Differences Estimates? Quarterly Journal of Economics 119(1), pp. 249–275.
  12. Kezdi, G. (2004): Robust Standard Error Estimation in Fixed-Effect Panel Models. Hungarian Statistical Review 9, pp. 95–116.
  13. Cameron, C., J. Gelbach and D. L. Miller (2008): Bootstrap-Based Improvements for Inference with Clustered Errors. The Review of Economics and Statistics 90, pp. 414–427.