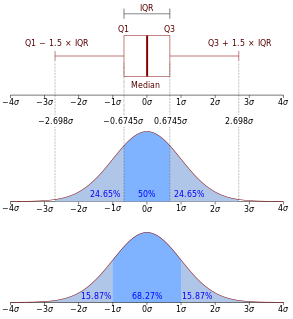
In descriptive statistics, the interquartile range (IQR), also called the midspread, middle 50%, or H‑spread, is a measure of statistical dispersion, being equal to the difference between 75th and 25th percentiles, or between upper and lower quartiles, IQR = Q3 − Q1. In other words, the IQR is the third quartile subtracted from the first quartile; these quartiles can be clearly seen on a box plot on the data. It is a trimmed estimator, defined as the 25% trimmed range, and is a commonly used robust measure of scale.

In statistics and probability theory, the median is the value separating the higher half from the lower half of a data sample, a population, or a probability distribution. For a data set, it may be thought of as "the middle" value. The basic feature of the median in describing data compared to the mean is that it is not skewed by a small proportion of extremely large or small values, and therefore provides a better representation of a "typical" value. Median income, for example, may be a better way to suggest what a "typical" income is, because income distribution can be very skewed. The median is of central importance in robust statistics, as it is the most resistant statistic, having a breakdown point of 50%: so long as no more than half the data are contaminated, the median is not an arbitrarily large or small result.
In statistics, a quartile is a type of quantile which divides the number of data points into four parts, or quarters, of more-or-less equal size. The data must be ordered from smallest to largest to compute quartiles; as such, quartiles are a form of order statistic. The three main quartiles are as follows:

In statistics, the standard deviation is a measure of the amount of variation or dispersion of a set of values. A low standard deviation indicates that the values tend to be close to the mean of the set, while a high standard deviation indicates that the values are spread out over a wider range.

In probability theory and statistics, skewness is a measure of the asymmetry of the probability distribution of a real-valued random variable about its mean. The skewness value can be positive, zero, negative, or undefined.

In probability theory and statistics, variance is the expectation of the squared deviation of a random variable from its mean. In other words, it measures how far a set of numbers is spread out from their average value. Variance has a central role in statistics, where some ideas that use it include descriptive statistics, statistical inference, hypothesis testing, goodness of fit, and Monte Carlo sampling. Variance is an important tool in the sciences, where statistical analysis of data is common. The variance is the square of the standard deviation, the second central moment of a distribution, and the covariance of the random variable with itself, and it is often represented by , , or .
The interquartile mean (IQM) is a statistical measure of central tendency based on the truncated mean of the interquartile range. The IQM is very similar to the scoring method used in sports that are evaluated by a panel of judges: discard the lowest and the highest scores; calculate the mean value of the remaining scores.

In descriptive statistics, a box plot or boxplot is a method for graphically depicting groups of numerical data through their quartiles. Box plots may also have lines extending from the boxes (whiskers) indicating variability outside the upper and lower quartiles, hence the terms box-and-whisker plot and box-and-whisker diagram. Outliers may be plotted as individual points. Box plots are non-parametric: they display variation in samples of a statistical population without making any assumptions of the underlying statistical distribution. The spacings between the different parts of the box indicate the degree of dispersion (spread) and skewness in the data, and show outliers. In addition to the points themselves, they allow one to visually estimate various L-estimators, notably the interquartile range, midhinge, range, mid-range, and trimean. Box plots can be drawn either horizontally or vertically. Box plots received their name from the box in the middle, and from the plot that they are.
The five-number summary is a set of descriptive statistics that provides information about a dataset. It consists of the five most important sample percentiles:
- the sample minimum (smallest observation)
- the lower quartile or first quartile
- the median
- the upper quartile or third quartile
- the sample maximum
In statistics, the mean squared error (MSE) or mean squared deviation (MSD) of an estimator measures the average of the squares of the errors—that is, the average squared difference between the estimated values and the actual value. MSE is a risk function, corresponding to the expected value of the squared error loss. The fact that MSE is almost always strictly positive is because of randomness or because the estimator does not account for information that could produce a more accurate estimate.
The average absolute deviation (AAD) of a data set is the average of the absolute deviations from a central point. It is a summary statistic of statistical dispersion or variability. In the general form, the central point can be a mean, median, mode, or the result of any other measure of central tendency or any reference value related to the given data set. AAD includes the mean absolute deviation and the median absolute deviation.
In statistics, the mid-range or mid-extreme is a measure of central tendency of a sample (statistics) defined as the arithmetic mean of the maximum and minimum values of the data set:
In statistics, M-estimators are a broad class of extremum estimators for which the objective function is a sample average. Both non-linear least squares and maximum likelihood estimation are special cases of M-estimators. The definition of M-estimators was motivated by robust statistics, which contributed new types of M-estimators. The statistical procedure of evaluating an M-estimator on a data set is called M-estimation. 48 samples of robust M-estimators can be founded in a recent review study.
The root-mean-square deviation (RMSD) or root-mean-square error (RMSE) is a frequently used measure of the differences between values predicted by a model or an estimator and the values observed. The RMSD represents the square root of the second sample moment of the differences between predicted values and observed values or the quadratic mean of these differences. These deviations are called residuals when the calculations are performed over the data sample that was used for estimation and are called errors when computed out-of-sample. The RMSD serves to aggregate the magnitudes of the errors in predictions for various data points into a single measure of predictive power. RMSD is a measure of accuracy, to compare forecasting errors of different models for a particular dataset and not between datasets, as it is scale-dependent.
In statistics the trimean (TM), or Tukey's trimean, is a measure of a probability distribution's location defined as a weighted average of the distribution's median and its two quartiles:
The sample mean and the sample covariance are statistics computed from a sample of data on one or more random variables.
In statistics, the median absolute deviation (MAD) is a robust measure of the variability of a univariate sample of quantitative data. It can also refer to the population parameter that is estimated by the MAD calculated from a sample.
In statistics, an L-estimator is an estimator which is a linear combination of order statistics of the measurements. This can be as little as a single point, as in the median, or as many as all points, as in the mean.
In statistics, a trimmed estimator is an estimator derived from another estimator by excluding some of the extreme values, a process called truncation. This is generally done to obtain a more robust statistic, and the extreme values are considered outliers. Trimmed estimators also often have higher efficiency for mixture distributions and heavy-tailed distributions than the corresponding untrimmed estimator, at the cost of lower efficiency for other distributions, such as the normal distribution.
In statistics, a robust measure of scale is a robust statistic that quantifies the statistical dispersion in a set of numerical data. The most common such statistics are the interquartile range (IQR) and the median absolute deviation (MAD). These are contrasted with conventional measures of scale, such as sample variance or sample standard deviation, which are non-robust, meaning greatly influenced by outliers.


