Spanish Salvadorans
A
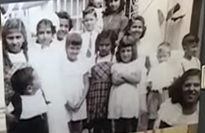
Galician Spanish family in the Chalatenango Department of El Salvador
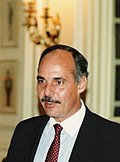
Salarrué and his mother. Salarrué was an important Salvadoran writer, poet, and painter. Of Spanish descent, his father Alejandro Arrué Jimenez came to El Salvador from the
Basque Country.
Conquistador
Pedro de Alvarado and his army first entered territories of what is now El Salvador in 1524, founding the city of San Salvador in 1525.
General
Manuel José Arce; decorated Salvadoran General and president of the
Federal Republic of Central America from 1825 to 1829
Spaniards began to settle in El Salvador in the mid-1520s. Some 12.7% of Salvadorans are white. [14] This population is made up of those of Spanish origin, while there are also Salvadorans of French, German, Swiss, English, Irish, and Italian descent. A majority of Central European settlers in El Salvador arrived during World War II as refugees from the Czech Republic, Germany, Hungary, Poland, and Switzerland with many settling in the region that is now Chalatenango in the late 18th century. [15] In 1789, Francisco Luis Héctor de Carondelet was named governor of El Salvador. Because the local indigenous population working in the indigo industry had declined greatly, Carondolet recruited Spanish laborers from northern Spain to settle in El Salvador. In 1790, de Carondelet, ordered families from the north of Spain (Galicia, Asturias, the Basque Country, Cantabria and Navarra) to settle in the area to compensate for the lack of indigenous people to work the land; important settlements of these Spaniards were the Northern and Central parts of El Salvador. Their descendants are among the blonde and fair-skinned people of today's Chalatenango Department. [16]
During 1880 to 1920, El Salvador had its Migratory Peak of Immigrants from Europe, as well as immigrants from nearby countries, Asians and other North Americans, when more than 120,000 arrived in El Salvador, the demographic weight was unprecedented, in 1880 the Population was of 480,000 inhabitants and by 1920 it was already 1,170,000. the main groups were the Spanish, Italians, Germans and some French, Polish and British [17] [18] [19] [20]
French Salvadorans
French family in San Salvador,
c. 1910–1915
Salvador Llort Choussy and his family. Salvador Llort and his brother
Fernando Llort were artists, painters and sculpturists who are noted for their contribution in modern Salvadoran art often dubbed "El Salvador's National Artist".
The French Immigration to the Republic of El Salvador was an important movement that the country received between the 19th century and the middle of the 20th century. Between 1850 and 1870, the French formed the largest foreign group in El Salvador. Later in 1940 to 1950, they formed one of the largest groups in the country, only surpassed by the Spanish and Italians. Between 1850 and 1870, El Salvador was the main recipient of French in Central America, most were merchants and businessmen together with their families.
It is estimated that between 1850 and 1950, more than 7,000 French emigrated to El Salvador, the majority came from Aquitaine, Occitania and the Alps. Between 1850 and 1870, 2,000 French arrived in El Salvador; between 1911 and 1937, 2,000 French entered the country, and finally in 1938 to 1945, 2,500 French entered the country. French immigration at that time greatly influenced the economy and education.
Since the colonial period there is a record of French in Salvadoran territory, in which several French corsairs and French pirates stand out In 1850. Several French businessmen and merchants left for El Salvador to work in different types of jobs such as commerce, planting of sugar cane, industry and cultivation of coffee. During that time 2,000 French arrived in the territory, most were wealthy families and merchants. Most of the French who would arrive between 1880 and 1910 were merchants and professionals, but from 1911 to 1937, immigration would begin to shine again for various reasons. Many businessmen and merchants arrived in Salvadoran territory, at that time French investment in El Salvador was equal to that of the United States. During that period of time 2,000 French entered El Salvador. According to historical records, the French were the third largest group of foreigners in the country, only surpassed by the Spanish and Italians.
The majority of the French who arrived in the national territory first came from Corsica later in 1850 to 1950, the majority of the French who arrived in the territory were from Aquitaine, Occitanie and Rhône-Alpes but also Paris and other parts of the Alps, most of the French settled in San Salvador, however the City of Santa Tecla in the La Libertad Department (El Salvador) historically received large numbers of French Immigrants, other places with significant numbers are Santa Ana and Antiguo Cuscatlán.
German Salvadorans
German immigration to El Salvador was a migratory movement that began between 1880 and 1940, when the largest influx of Germans is recorded. The first Germans in El Salvador joined their mostly wealthy families in 1870 establishing coffee shops. At that time El Salvador had implemented the liberal reforms that attracted thousands of immigrants from Europe, Middle East and Asia, as well as the German immigration in the country, more families migrated to El Salvador and the agricultural land was also distributed. The main settlements of these families were the coffee-growing areas and also large cities like Nueva San Salvador now known as Santa Tecla, San Salvador, Chalatenango, Cuscatlan, Usulután and other areas where German immigrants saw economic opportunities in the country, they excelled in industry, commerce and farming. [21] [20]
One of the most famous Germans who immigrated to El Salvador was Walter Thilo Deininger, who moved to the Cuscatlan department in 1885. He soon built his coffee estate and other industries. Soon after, arrived more German families to Cuscatlán, as well as important people like Jürgen Hübner, a German historian and author of "Die Deutschen und El Salvador (The Germans and El Salvador). [22] [23]
By 1890, Germans were one of the country's largest immigrant groups and were able to settle and stand out from the crowd of other European immigrants. Germans numbers in El Salvador later increased, their descendants were much more than the number of German immigrants living in El Salvador. There were cities founded by German families, like Berlín, Usulután which is a very clear example of a settlement founded by a German. Later other Germans families came to the area. North of El Salvador, specifically what is now north of Metapan and Chalatenango, existed German settlements.
The Usulutan department was the area with the greatest presence of Germans in El Salvador. The Germans started arriving in the early 1900s and settled down to produce coffee.
The book, “The Population of El Salvador”, by Rodolfo Barón Castro, published in 1942, shows one of the first Statistical Census published by the Central Office of Migration in 1937; there it indicated that the four largest groups of immigrants in El Salvador, at that time, were made up of Spaniards, Palestinians, Italians and Germans. Germans arrived in the country in the early 1900s and, along with Italians, French and other Europeans, helped develop roads and build the Port of El Triunfo.
In addition, from the municipality of Berlín, Usulután there was a direct route to reach Puerto El Triunfo; an ideal route to transport the merchandise they produced and to obtain work materials.
It was the meeting point where German descendants and those close to Germany met to do their business because the farms were somewhat distant. They found in this part of El Salvador a center of excellence to live or develop, but they also needed to have a place to meet on weekends, to go and talk, which is typical of the cultures of these peoples: to have a meeting point.
The settlement was also agricultural. In 1958, the German Embassy in El Salvador founded the "Círculo Cultural Salvadoreño-Alemán", (German-Salvadoran cultural circle) to promote cultural exchange between Germany and El Salvador. The German School was dedicated on March 3, 1965, the Salvadoran German Cultural Forum has been celebrating every second Friday in November since 2006 Gardens of the Hilton Princess Hotel Oktoberfest. More than 700 people/families take part participate in a typically German dinner, German music and a typically German parade enjoy costumes. The traditional "Beer Festival" will continue thanks to the sponsorship of La Constancia and organized by German companies. The city of San Salvador, since 2011 in the third October week the Oktoberfest Pilsener celebrated in the exhibition and congress center. More than 27,000 people attended the 2013 edition, which became the largest Octoberfest in Central America. Over four days of festivities, participants enjoy traditional German cuisine and music, as well as a large selection of beers, some of which are made exclusively for the event.
Germany is one of the main European Union trading partners of El Salvador and is the largest importer of Salvadoran coffee. The Chamber of Commerce German-Salvadoran consists of around 85 companies. In addition to a German school in San Salvador. [24]
Italian Salvadorans
Massive documentation of Italian immigrants in
San Salvador, during the 20th century
Alfredo Cristiani, former president of El Salvador, descendant of Italian immigrants
Italian Immigration in El Salvador refers to the movement of Italians to the Republic of El Salvador and one of the most historically important movements in El Salvador. The Italo-Salvadorans are one of the largest European communities in the country, and one of the largest in Central America and the Caribbean, as well as one of those with the greatest social and cultural weight in America.
During the mid-nineteenth century to the mid-twentieth century, waves of Italian immigrants from all regions of Italy were registered and arrived, mainly from northern Italy and southern Italy, the first Italians who arrived in the country were mainly from the Kingdom of Sardinia-Piedmont, and also from the Kingdom of the Two Sicilies, which include several Italians from different cities and provinces, since 1880, there has been a flow from all Italian regions but mainly from the south of the peninsula. highlighting regions such as Campania, Basilicata, Apulia and Sicily.
There is a record of Italians residing and arriving in the country since 1850, who came from the Kingdom of Sardinia-Piedmont and the Kingdom of the Two Sicilies, several intellectuals, merchants and other lower-middle class Italians stand out, during those years several boats arrived to the country mainly from important port cities of Italy, which include Naples, Genoa and Palermo, most of these Italians entered through the port of La Libertad and in the East of the country, during that time the Italians in the country did not exceed 2,000, however in the following years the number of arrivals would grow more.
By 1870, more boats arrived from Naples and Genoa, ranging from 30 to 60 Italian immigrants, but many merchants also entered the country every day. During that period of time, the country created very free immigration reforms, which attracted more immigrants from the world, many Italians arrived between 1876 and 1879, several boats to the country stand out, mainly from Campania and Liguria, between 1870 and 1879, it is estimated that more than 2,500 Italians entered the country, at that time El Salvador was the main receiver of Italians in Central America, mainly attracted by various agricultural opportunities. In 1880 to 1889, more than 2,000 Italians arrived in the country mainly from Campania and Piedmont, many boats of more than 100 Italian immigrants arrived at the Salvadoran coasts, these boats sailed from Naples and Liguria, this time was highlighted by arrivals of lower-class Italians and some professionals, however, also there were nuns and priests who came to the country to found several churches, schools and important organizations. In 1890, Italian immigration grew exponentially, it is estimated that between 1890 and 1899, more than 6,500 Italians arrived in the country, the vast majority arrived at the port of La Libertad, several architects and other Italian professionals arrived, such as those who built the Santa Ana Theater.
In 1890, many Salesians arrived in the country from Turin, they set sail on ships full of Italian immigrants and arrived at the port of La Libertad Department (El Salvador), many stayed in the city of Santa Tecla, El Salvador, where they founded various organizations and schools such as the Colegio Santa Cecilia, which It was founded in 1899 by Italians.
In 1898, the first Italian organization was founded in El Salvador and the first in Central America, the Sociedad de Asistencia y Beneficencia entre Italianos en El Salvador, better known as the Italian Assistenza, the objective of this organization is to help newly arrived Italians to get a job and help them financially while they got it.
Twentieth century
The time was characterized by the massive entry of Italians into the country, between 1900 and 1909 more than 10,000 Italians arrived in the country from all Italian regions, at that time, El Salvador was the second largest recipient of Italian immigrants in Central America, many seeking better opportunities for their businesses and improve their quality of life, where several merchants and Italians entering the country stand out, many standing out in areas such as Education, Music, Agriculture, Industry, Commerce and infrastructure.
Between 1910 and 1919, other thousands of Italians enter as they register more than 6,000 arrivals in the country, the Italians easily adapted to the country and more Italians arrived in the country every day, El Salvador at that time managed to reach the main recipient of Italians in Central America, between 1920 and 1929, several Italian merchants and professionals arrived, but also lower-class Italians, many set up their businesses, in 1930, Italian immigration was paralyzed for various reasons, between 1930 and 1939, it is estimated that more than 1,000 Italians They arrived in the country and many set up their businesses.
In 1940, due to the Second World War, a large migratory wave of thousands of Italians emigrating to the country begins, where several merchants and Italians who wanted to improve their quality of life stand out, this time was characterized by the entry of several refugees, and Italians, most of whom came from northern Italy.
Between 1960 and 1980, several Franciscans arrived in the country, many founded schools and organizations to help the Salvadoran people, and also to reactivate the Italian culture in the country.
In 1989 a son of Italians, Alfredo Cristiani, was elected President of El Salvador. After five difficult years, his term ended in 1994, leaving his nation stabilized from the civil war that had plagued it for 20 years.
Italian immigration to El Salvador was a very large movement that the country received, from 1850 to 1929, it is estimated that more than 32,000 Italians arrived in the small country, looking for job opportunities and improvements in their quality of life, but the migratory peak It was between 1880 and 1930, when thousands of Italians from all regions arrived in El Salvador, the main recipients of Italians in America were the United States, Argentina, Brazil, Uruguay and other countries in the region, although El Salvador received large amounts of Italian immigrants and at the American level is one that has had more weight socially and culturally.
Italian immigrants occupations and age
The Italians who arrived in the mid-nineteenth century were mostly middle class or poor, many were farmers and workers who came to the country to look for work, several merchants also arrived, according to some records, the Italians who arrived in the country between 1850 and 1870, were many families, who on average were between 22 and 26 years old, more 60% of immigrants who arrived in the country were men and 40% were women.
From 1870 to 1879, 2,5000 Italians arrived in the country, 63.5% were men, the average age was around 20 to 30 years and the majority were merchants, workers and farmers, between 1880 and 1889, they emigrated to the country around 2,000 Italians, 64% men and 44% women, age ranged widely, from 2 years to 50 years old, most were merchants, laborers and farmers, with increasing arrivals of priests, nuns and preachers. Between 1890 and 1891, the second highest peak was recorded, when 6,500 Italians entered El Salvador, the average age was around 20 to 30 years, and the most numerous occupations were merchants, workers, farmers, priests, nuns, teachers. and architects. The highest peak of Italian immigration in the country occurred between 1900 and 1909, when 10,000 Italians emigrated to the country looking for a better future, 60% were men and 40% women, and the average age was around 20 years. 30 years of age, the most numerous occupations were workers, merchants and some teachers, for 1910 to 1919, more than 6,000 Italians entered El Salvador, this year is distinguished by a growth of immigrants who are women with around 43% and 57% are men, the age varies between 3 years and 50 years, later, between 1920 and 1930, the majority who arrived in the country were engaged in commerce, agriculture and other businesses and activities.
Italian settlements in El Salvador
The first Italians who entered the country settled in Santa Ana and San Miguel. Others settled mainly in the east of the country, in San Miguel, Usulután and La Unión. In the north of the country, in Chalatenango, several groups of Italians also settled.
The southern Italians settled mainly in San Miguel, Santa Ana, San Salvador and other departments of the country, where several cities stand out. Santa Tecla was the one that received the greatest demographic weight due to Italian immigration, since it became the capital, they arrived various Italian communities.
The Lucanians, Campanians, Sicilians and Pulleses, had their main destinations in San Salvador, Santa Ana and San Miguel Department (El Salvador), while the northern Italians: the Piedmontese, Venetians, Ligurians and Lombards settled mainly in La Libertad, San Salvador, Chalatenango, Santa Ana and San Miguel. Several Italians settled in the department of Sonsonate, particularly from Castelnuovo di Conza in the Campania region, and Usulután received several Italian farmers from northern Italy, also in La Unión where several southerners and northerners settled, mainly Piedmontese and Calabrian. In the other departments of the country, minority but visible groups of Italians settled. succeeding in trade and agriculture.