According to the 2022 revision of the World Population Prospects[3][4] the total population was 10,278,345 in 2021, compared to 1,487,000 in 1950 (a fivefold increase in 60 years). The proportion of the population aged below 15 in 2010 was 36.8%, 58.9% were aged between 15 and 65 years of age, and 4.3% were aged 65 years or older.[5]
As of 2014, 60% of Hondurans live below the poverty line.[6] More than 30% of the population is divided between the lower middle and upper middle class, less than 10% are wealthy or belong to the higher social class (most live in Tegucigalpa and San Pedro Sula).
Year
Total population ( × 1000)
Proportion percentage
aged 0–14
aged 15–64
aged 65+
1950
1 487
42.2%
53.8%
4.0%
1955
1 717
44.3%
52.3%
3.4%
1960
2 002
46.1%
50.8%
3.2%
1965
2 353
47.1%
49.8%
3.1%
1970
2 691
47.7%
49.2%
3.1%
1975
3 108
47.5%
49.3%
3.2%
1980
3 636
47.0%
49.8%
3.2%
1985
4 238
46.2%
50.6%
3.2%
1990
4 904
45.5%
51.1%
3.4%
1995
5 592
44.3%
52.1%
3.6%
2000
6 575
42.8%
53.5%
3.7%
2005
7 459
40.6%
55.6%
3.8%
2010
8 317
37.6%
58.4%
4.0%
2015
9 113
33.7%
61.9%
4.3%
2020
9 905
30.6%
64.4%
5.0%
Structure of the population
Population Estimates by Sex and Age Group (01.VII.2007) (Data refer to projections based on the 2001 Population Census.):[7]
Age group
Male
Female
Total
%
Total
3 717 577
3 819 375
7 536 952
100
0–4
541 070
522 177
1 063 247
14.11
5–9
511 733
497 666
1 009 399
13.39
10–14
464 403
456 447
920 850
12.22
15–19
402 792
400 001
802 793
10.65
20–24
353 317
357 434
710 751
9.43
25–29
308 283
318 130
626 413
8.31
30–34
255 818
266 861
522 679
6.93
35–39
205 171
219 874
425 045
5.64
40–44
157 492
177 140
334 632
4.44
45–49
128 813
147 464
276 277
3.67
50–54
105 428
121 993
227 421
3.02
55–59
83 643
97 033
180 676
2.40
60–64
63 863
73 789
137 652
1.83
65–69
49 404
58 136
107 540
1.43
70–74
37 134
44 984
82 118
1.09
75–79
24 368
30 225
54 593
0.72
80+
24 845
30 021
54 866
0.73
Age group
Male
Female
Total
Percent
0–14
1 517 206
1 476 290
2 993 496
39.72
15–64
2 064 620
2 179 719
4 244 339
56.31
65+
135 751
163 366
299 117
3.97
Population Estimates by Sex and Age Group (01.VII.2010) (Data refer to projections based on the 2001 Population Census.):
Age group
Male
Female
Total
%
Total
3 965 430
4 080 560
8 045 990
100
0–4
549 179
530 110
1 079 289
13.41
5–9
525 938
509 139
1 035 077
12.86
10–14
492 090
481 523
973 613
12.10
15–19
434 856
431 337
866 193
10.77
20–24
371 818
375 696
747 514
9.29
25–29
326 377
337 526
663 903
8.25
30–34
282 042
295 519
577 561
7.18
35–39
230 506
244 378
474 884
5.90
40–44
181 554
200 161
381 715
4.74
45–49
140 031
161 534
301 565
3.75
50–54
116 240
135 378
251 618
3.13
55–59
93 205
109 982
203 187
2.53
60–64
72 071
85 246
157 317
1.96
65–69
53 835
63 955
117 790
1.46
70–74
40 470
49 655
90 125
1.12
75–79
27 381
34 757
62 138
0.77
80+
27 837
34 664
62 501
0.78
Age group
Male
Female
Total
Percent
0–14
1 567 207
1 520 772
3 087 979
38.38
15–64
2 248 700
2 376 757
4 625 457
57.49
65+
149 523
183 031
332 554
4.13
Population by Sex and Age Group (Census 10.VIII.2013):[8]
Age group
Male
Female
Total
%
Total
4 052 316
4 251 456
8 303 771
100
0–4
494 034
476 980
971 015
11.69
5–9
489 821
468 723
958 543
11.54
10–14
520 842
499 564
1 020 406
12.29
15–19
487 949
494 215
982 164
11.83
20–24
398 093
442 708
840 800
10.13
25–29
303 379
353 065
656 443
7.91
30–34
262 951
304 416
567 367
6.83
35–39
224 965
259 775
484 740
5.84
40–44
190 323
209 232
399 555
4.81
45–49
150 635
167 391
318 026
3.83
50–54
141 174
152 082
293 256
3.53
55–59
101 062
109 646
210 708
2.54
60–64
91 291
98 345
189 636
2.28
65–69
64 441
71 267
135 709
1.63
70–74
51 803
54 762
106 566
1.28
75–79
38 419
39 988
78 407
0.94
80–84
22 977
25 988
48 965
0.59
85–89
13 681
15 851
29 532
0.36
90–94
3 162
5 079
8 241
0.10
95+
1 313
2 379
3 692
0.04
Age group
Male
Female
Total
Percent
0–14
1 504 697
1 445 267
2 949 964
35.53
15–64
2 351 823
2 590 875
4 942 698
59.52
65+
195 796
215 314
411 110
4.95
Population Estimates by Sex and Age Group (01.VII.2021) (Projections based on the 2013 Population Census.):[9]
Age group
Male
Female
Total
%
Total
4 599 323
4 851 388
9 450 711
100
0–4
499 399
481 326
980 725
10.38
5–9
487 201
470 343
957 544
10.13
10–14
498 226
483 892
982 118
10.39
15–19
479 112
485 063
964 175
10.20
20–24
439 748
465 939
905 687
9.58
25–29
403 089
436 407
839 496
8.88
30–34
361 467
397 429
758 896
8.03
35–39
304 818
339 274
644 092
6.82
40–44
246 965
278 001
524 966
5.55
45–49
205 536
232 492
438 028
4.63
50–54
168 437
191 093
359 530
3.80
55–59
139 061
157 969
297 030
3.14
60–64
112 471
128 236
240 707
2.55
65–69
88 488
102 590
191 078
2.02
70–74
65 693
77 874
143 567
1.52
75–79
45 441
54 983
100 424
1.06
80–84
28 378
35 119
63 497
0.67
85–89
15 164
19 214
34 378
0.36
90–94
7 624
9 864
17 488
0.19
95+
3 005
4 280
7 285
0.08
Age group
Male
Female
Total
Percent
0–14
1 484 826
1 435 561
2 920 387
30.90
15–64
2 860 704
3 111 903
5 972 607
63.20
65+
253 793
303 924
557 717
5.90
Vital statistics
UN estimates
Registration of vital events is in Honduras not complete. The Population Department of the United Nations prepared the following estimates. [5]
Period
Live births per year
Deaths per year
Natural change per year
CBR*
CDR*
NC*
TFR*
IMR*
Life expectancy
total
for males
for females
1950–1955
84 000
40 000
44 000
52.1
24.7
27.4
7.50
169
41.8
40.5
43.1
1955–1960
95 000
40 000
55 000
51.1
21.5
29.6
7.50
154
44.6
43.0
46.3
1960–1965
108 000
40 000
68 000
49.5
18.3
31.2
7.42
136
48.0
46.3
49.8
1965–1970
122 000
40 000
82 000
48.4
16.0
32.4
7.42
119
51.0
49.2
53.0
1970–1975
133 000
40 000
93 000
45.9
13.7
32.2
7.05
104
54.1
52.1
56.2
1975–1980
150 000
38 000
112 000
44.5
11.4
33.1
6.60
81
57.7
55.6
59.9
1980–1985
166 000
36 000
130 000
42.3
9.2
33.1
6.00
65
61.6
59.4
63.8
1985–1990
180 000
33 000
147 000
39.5
7.3
32.2
5.37
53
65.4
63.2
67.7
1990–1995
195 000
33 000
162 000
37.1
6.3
30.8
4.92
43
67.7
65.4
70.1
1995–2000
198 000
33 000
165 000
33.4
5.5
27.9
4.30
35
69.8
67.5
72.3
2000–2005
197 000
35 000
163 000
31.4
5.0
26.4
3.87
31
71.0
68.6
73.4
2005–2010
201 000
37 000
164 000
27.1
4.7
22.4
3.24
28
72.1
69.7
74.5
2010–2015
23.4
4.5
18.9
2.73
2015–2020
21.8
4.4
17.4
2.49
2020–2025
20.3
4.5
15.8
2.32
2025–2030
18.6
4.6
14.0
2.19
* CBR = crude birth rate (per 1000); CDR = crude death rate (per 1000); NC = natural change (per 1000); IMR = infant mortality rate per 1000 births; TFR = total fertility rate (number of children per woman)
The Amerindian population is the largest minority group in Honduras. The largest Amerindian group are the Lencan people. These people have been living in Honduran territory since before the colonization of the Americas, developing their own societies and civilizations. They still have many communities across the country. The indigenous population would begin to decline from the mid-16th century, mainly due to the various diseases brought by the Europeans in addition to the growing mestizo population after the founding of towns and cities. According to the 2001 census the Amerindian population in Honduras included 381,495 people (6.3% of the total population).[14] With the exception of the Lenca and the Ch'orti' they still keep their language.
Six different Amerindian groups were counted at the 2001 census:
the Lenca (279,507 in 2001;4.6% of the total population) living in the La Paz, Intibucá, and Lempira departments;
the Miskito (51,607 in 2001; 0.8%) living on the northeast coast along the border with Nicaragua.
the Ch'orti' (34,453 in 2001;0.6% of the total population), a Mayan group living in the northwest on the border with Guatemala;
the Tolupan (also called Jicaque, "Xicaque", or Tol; 9,617 in 2001; 0.2% of the total population), living in the reserve of the Montaña de la Flor and parts of the department of Yoro;
the Pech or Paya Indians (3,848 in 2001; 0.1% of the total population) living in a small area in the Olancho department;
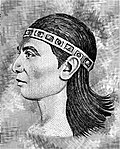
Examples of Honduran natives are the many Mayan rules of Copan and other Mayan cities, native chiefs such as Lempira and Cicumba, and environmental and feminist activist Berta Cáceres.
Copan founder, king Knich Yax Kuk Moo
Mayan ruler, Kʼakʼ Yipyaj Chan Kʼawiil
Lencan ruler, Lempira
Lencan environmental activist, Berta Cáceres
Mestizos
Mestizos (meaning mixed European and Amerindian) have been reported by the CIA World Factbook to be about 87% of the population of Honduras.[15] As in other Latin American countries, the question of racial breakdown of a national population is contentious. Since the beginning of the 20th century at least, Honduras has publicly framed itself as a mestizo nation, along with other Latin American countries such as Guatemala or Mexico, ignoring and at times disparaging both the European component of the population and the surviving Amerindian population that was still regarded as "pure blooded". It's well known that many Hondurans of European or almost entirely Amerindian background consider themselves mestizo.[16][17]
Because of social stigmas attached, many Honduran people denied having African ancestry, and after African descended Caribbean workers arrived in Honduras, an active campaign to denigrate all people of African descent, made persons of mixed race anxious to deny any African ancestry. Hence official statistics quite uniformly under-represent those people who have ancestry in favor of a "two race" solution.[16]
A genetic admixture study focusing on kidney disease in Hispanic populations in the United States found an average genetic mix of 40% European, 39% Indigenous, and 21% African ancestry in the Honduran-American diaspora population, from a sample of 295 US residents who reported all four grandparents born in Honduras.[18]
The Afro-Honduran population consist of people of Afro-Descendants with roots in colonial Honduras, Garifuna, Miskito, and Creoles. Most of them are descendants of African people brought by the Spanish and other European colonizers between the 16th and 18th centuries. Many of them came from the west African coast, from places like Angola or Senegambia, where European bought slaves for their colonies, while others came from the other colonies in the Caribbean.
According to some reports around 230,000 enslaved Africans arrived to Honduras during colonial times, directly from Africa and other colonies in the Americas.
Scholars and private universities claim ranges from 20-30% of the Honduran population being Afro-descendants due to many Black Hondurans or Afro-descendants, Mulattos, Afro-Indigenous and people with significant African descent identifying as Mestizo due to oppression from society and the government and Mestizaje, wide-spread mixing amongst other things.
The Miskito are an Afro-indigenous ethnic group in Central America, of whom many are mixed race. In the northern end of their territory, the people are primarily of African-Native American ancestry; others are of mixed African-Native American and English descent. Their territory extends from Cape Camarón, Honduras, to Río Grande de Matagalpa, Nicaragua, along the Mosquito Coast, in the Western Caribbean Zone.[19]
The Garifuna are descendants of Carib, Arawak, and West African people. This ethnic group has its origins in a group from St. Vincent islands in the Caribbean, who came in 1797. At the 2001 census 46,448 people were registered as Garifuna, 0.8% of the total population of Honduras.[14] The Garifuna speak an Arawakan language. They live along the entire Caribbean coastline of Honduras, and in the Bay Islands.
The Creole people are descendants of Afro-Caribbean people who arrived originally with the introduction of enslaved Africans brought by the British to Honduras in the 16th and 17th century. Creoles also arrived with the immigration of black workers from Jamaica, Cayman Island, Trinidad and Tobago and other English-speaking islands, who arrived in the early twentieth century to work in transnational banana companies, workers in the construction of railways, dockworkers and in some cases "scabs", are concentrated mainly in the Bay Islands, especially the Roatan Island and Guanaja and Caribbean coastal Honduran cities like Puerto Cortes, Tela and La Ceiba. In the 1800s, five years before independence, the Mayor Don Juan Antonio Tomos issued a report of his visit in 1815, in which he indicated 100,000 inhabitants in the cities of Puerto Cortés, San Pedro Sula, Tela, La Ceiba, and 39 curatos and 8 villages of Caribbean blacks from countries like Jamaica, Trinidad and Tobago, Saint Lucia, Belize, and Haiti. Plus additional inhabitants near Trujillo (estimate does at 10,000) for a total of 110,000 inhabitants. After independence" the population of 1826 (200,000 people) is based on the calculation made by Mr. Dionisio de Herrera, former head of the state of Honduras. By the early 1900s more than 300,000 people had come to Honduras to work mainly in the booming banana cultivation and other agricultural sectors.[20]
Honduras of European descent or White Hondurans, along with Afro-descendants and Amerindians belong to the minorities of Honduras. Most of the white population are descendants of the Spanish settlers, who mainly came from southern Spain, and inhabit most of the western part of the country. Other populations include descendants of European immigrants who arrived at the beginning of the 20th century. In 2014, there were about 14,000 Hondurans of Italian descent, while there were around 400 Italian citizens.[21] Percentages of whites varied between 2.1% and 7%,[22] due to the fact that the majority of Hondurans identify themselves as mestizos, regardless of their ethnic and racial category.[23] This makes it more difficult to study the number of people who fit into the white category in Honduras.
The census states that only 89,000 people in Honduras labeled themselves as white, which is equal to around 1% of the total population at the time.[24] Another study has stated that around 210,000 people in Honduras fit this category, which would make the Honduran white population to be around 2.1%.[citation needed]
However, other studies report that the percentage could rise much more, reaching close to a half a million white people in Honduras, which according to official national sources would make a percentage of between 5% and 6.9% of whites in Hondurans.[25] This is because the majority of whites in Honduras do not identify themselves as Euro-descendants as such, adopting and feeling more identified with the mestizo identity.[26]
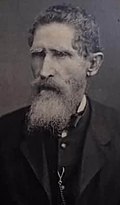
Central American president, General Francisco Morazán
General, Florencio Xatruch
Ex-President, Francisco Bertrand
Sir. Salvador Moncada, Honduran pharmacologist
Juan Carlos Fanconi, film director
Ex president, José Simón Azcona del Hoyo
East Asians
There is a small Chinese community in Honduras. A lawyer of the Committee for the Defense of Human Rights in Honduras (CODEH) stated that the Chinese community in Honduras is rather small. Many of the Chinese are immigrants who arrived from China after the revolution and their descendants.[27]
Hajime Waki, Honduran-Japanese singer.
Arabs
Honduras hosts a significant Palestinian community (the vast majority of whom are Christian Arabs).[28] These Arab-Hondurans are sometimes called "Turcos", because they arrived in Honduras using Turkish travel documents, as their homeland was then under the control of the Ottoman Empire. The Palestinians arrived in the country in the late 19th and early 20th centuries, establishing themselves especially in the city of San Pedro Sula.[29] As mentioned earlier, they are also considered whites in the country's censuses, in total the Arab-Hondurans make up 3% of the Honduran population.
Businessman Miguel Facusse, son of immigrants from the Ottoman Empire
Spanish immigration to Honduras[es] during the colonial era was the main source of the country's current white and mestizo population. It was later followed by African immigration, first brought over as slaves and later as free people of color.
12Dario Euraque, "The Threat of Blackness to the Mestizo Nation: Race and Ethnicity in the Honduran Banana Economy, 1920s and 1930s," in Steve Striffler and Mark Moberg, eds. Banana Wars: Power, Production and History in the Americas (Duke University Press, 2003), pp. 229–49.
↑Dario Euraque, "Antropólogos, archaeólogos, imperialismo y la mayanicación de Honduras, 1890–1940," Revista Historia 45 (2002): 73–103
↑"Honduras", The World Factbook, Central Intelligence Agency, 28 October 2024, archived from the original on 13 October 2024, retrieved 17 November 2024
↑Honduras - XVII Censo de Población y VI de Vivienda 2013». Instituto Nacional de Estadística de Honduras. 16 de noviembre de 2015
This page is based on this Wikipedia article Text is available under the CC BY-SA 4.0 license; additional terms may apply. Images, videos and audio are available under their respective licenses.