Demographics of Bolivia | |
---|---|
![]() Bolivia population pyramid in 2020 | |
Population | 11,312,620 (2024 census) [1] |
Density | 11.36/km2 (2024 est.) |
Growth rate | 1.2% (2022 est.) |
Birth rate | 16.7 per 1,000 pop. (2023 est.) |
Death rate | 4.6 per 1,000 pop. (2023 est.) |
Life expectancy | 68.87 years (2014) |
• male | 65.4 years (2013) |
• female | 71.1 years (2013) |
Fertility rate | 2.24 children born/woman (2023 est.) |
Infant mortality rate | 39.7 deaths/1,000 live births (2013) |
Net migration rate | -1.00 migrant(s)/1,000 population |
Age structure | |
0–14 years | 30.30% (2024 est.) |
15–64 years | 64.77% (2024 est.) |
65 and over | 4.93% (2024 est.) |
Sex ratio | |
Total | 0.99 male/female (2012) |
Under 15 | 1.05 male/female (2012) |
15–64 years | 0.96 male/female (2012) |
65 and over | 0.88 male/female (2012) |
Nationality | |
Nationality | Bolivian |
Major ethnic |
|
Minor ethnic | |
Language | |
Official | Spanish (44.89%) Quechua (25.08%) Aymara (16.77%) Guarani (0.69%) 34 other native languages |
Spoken | Languages of Bolivia |
The demographic characteristics of the population of Bolivia are known from censuses, with the first census undertaken in 1826 and the most recent in 2024. The National Institute of Statistics of Bolivia (INE) has performed this task since 1950. The population of Bolivia in 2024 reached 11 million for the first time in history. The population density is 11.36 inhabitants per square kilometer, and the overall life expectancy in Bolivia at birth is 68.2 years. The population has steadily risen from the late 1800s to the present time. The natural growth rate of the population is positive, which has been a continuing trend since the 1950s; in 2012, Bolivia's birth rate continued to be higher than the death rate. Bolivia is in the third stage of demographic transition. In terms of age structure, the population is dominated by the 15–64 segment. The median age of the population is 23.1, and the gender ratio of the total population is 0.99 males per female.
Bolivia is inhabited mostly by Mestizo, Quechua and Aymara, while minorities include 37 indigenous groups (0.3% average per group). Spanish, Quechua, Aymara, Guarani languages, as well as 34 other native languages are the official languages of Bolivia. Spanish is the most-spoken language (60.7%) within the population. The main religions of Bolivia are the Catholic Church (81.8%), Evangelicalism (11.5%), and Protestantism (2.6%). There is a literacy rate of 91.2%. An estimated 7.6% of the country's gross domestic product (GDP) is spent on education. The average monthly household income was Bs.1,378 ($293) in 1994. In December 2013 the unemployment rate was 3.2% of the working population. The average urbanization rate in Bolivia is 67%.
The first true estimate of the population of Bolivia came in 1826, in which 997,427 inhabitants were estimated. This number was calculated from the 1796 census organized by Francisco Gil de Taboada, which consisted of several Bolivian cities. [3] The first modern census was completed in 1831, and ten have been completed since then. The organizer of Bolivia's censuses has changed throughout the years—Andrés de Santa Cruz (1831), The Bolivian Statistical Office (1835, 1854, 1882), The Bolivian Statistical Commission (1845), The National Immigration Bureau and The Statistics and Geographic Propaganda (1900), and The Department of Statistics and Censuses (1950)—with the INE conducting the census since 1976. [3] The national census is supposed to be conducted every ten years, however, the 2012 census was late because of "climatic factors and the financing." The 2012 census was conducted on 21 November 2012, in which 10,027,254 inhabitants were in the country. The estimated cost of the census was $50 million. [4] [5]
With a population of 10.0 million in 2012, Bolivia ranks 87th in the world by population. [6] Its population density is 9.13 inhabitants per square kilometer. The overall life expectancy in Bolivia is 65.4. The total fertility rate is 2.87 children per mother. Since 1950, the World Health Organization (WHO) estimates the birth rate exceeded the death rate of the country. [7] The population of Bolivia has been increasing since 1900, and has only had a negative per annum growth rate twice in its history (1835 and 1882). Bolivia is in the third stage of demographic transition. There were 562,461 immigrants in Bolivia in 2012, with the most (40.5%) coming from Argentina. [8] In 2008, there were 48,809 marriages in Bolivia, and 5,887 divorces throughout the country in 2011. [9] [10]
|
| ||||||||||||||||||||||||||||||||||||||||||||||||||||||
Source: 1500–1800, [11] 1826, [3] 1831–2001, [12] 2012 [6] |
Age Group | Male | Female | Total | % |
---|---|---|---|---|
Total | 5,019,447 | 5,040,409 | 10,059,856 | 100 |
0–4 | 556 294 | 533 654 | 1,089,948 | 10.83 |
5–9 | 504 623 | 488 031 | 992 654 | 9.87 |
10–14 | 549 866 | 528 298 | 1,078,164 | 10.72 |
15–19 | 559 285 | 546 999 | 1,106,284 | 11.00 |
20–24 | 493 018 | 485 588 | 978 606 | 9.73 |
25–29 | 407 293 | 410 102 | 817 395 | 8.13 |
30–34 | 372 197 | 381 634 | 753 831 | 7.49 |
35–39 | 310 162 | 320 870 | 631 032 | 6.27 |
40–44 | 270 971 | 273 730 | 544 701 | 5.41 |
45–49 | 228 006 | 233 978 | 461 984 | 4.59 |
50–54 | 199 526 | 203 694 | 403 220 | 4.01 |
55–59 | 159 128 | 164 897 | 324 025 | 3.22 |
60–64 | 134 457 | 145 410 | 279 867 | 2.78 |
65–69 | 98 098 | 106 431 | 204 529 | 2.03 |
70–74 | 71 902 | 80 521 | 152 423 | 1.52 |
75–79 | 44 974 | 54 302 | 99 276 | 0.99 |
80–84 | 36 230 | 46 633 | 81 095 | 0.81 |
85–89 | 15 884 | 22 039 | 37 923 | 0.38 |
90–94 | 5 996 | 8 669 | 14 665 | 0.15 |
95+ | 3 305 | 4 929 | 8 234 | 0.08 |
Age group | Male | Female | Total | Percent |
0–14 | 1,610,783 | 1,549,983 | 3,160,766 | 31.42 |
15–64 | 3,134,043 | 3,166,902 | 6,300,945 | 62.63 |
65+ | 274 621 | 323 524 | 598 145 | 5.95 |
Age Group | Male | Female | Total | % |
---|---|---|---|---|
Total | 5,942,680 | 5,899,275 | 11,841,955 | 100 |
0–4 | 606 704 | 579 895 | 1,186,599 | 10.02 |
5–9 | 601 078 | 575 782 | 1,176,860 | 9.94 |
10–14 | 597 961 | 573 142 | 1,171,103 | 9.89 |
15–19 | 581 257 | 558 347 | 1,139,604 | 9.62 |
20–24 | 550 323 | 532 134 | 1,082,457 | 9.14 |
25–29 | 501 680 | 489 601 | 991 281 | 8.37 |
30–34 | 447 560 | 440 794 | 888 354 | 7.50 |
35–39 | 395 180 | 392 667 | 787 847 | 6.65 |
40–44 | 343 308 | 344 277 | 687 585 | 5.81 |
45–49 | 292 693 | 296 530 | 589 223 | 4.98 |
50–54 | 245 514 | 251 305 | 496 819 | 4.20 |
55–59 | 204 273 | 211 440 | 415 713 | 3.51 |
60–64 | 168 434 | 177 590 | 346 024 | 2.92 |
65–69 | 137 622 | 148 843 | 286 465 | 2.42 |
70–74 | 109 295 | 121 554 | 230 849 | 1.95 |
75–79 | 77 830 | 91 134 | 168 964 | 1.43 |
80–84 | 46 014 | 58 571 | 104 585 | 0.88 |
85–89 | 23 748 | 33 817 | 57 565 | 0.49 |
90–94 | 9 464 | 15 808 | 25 272 | 0.21 |
95+ | 2 742 | 6 044 | 8 786 | 0.07 |
Age group | Male | Female | Total | Percent |
0–14 | 1,805,743 | 1,728,819 | 3,534,562 | 29.85 |
15–64 | 3,730,222 | 3,694,685 | 7,424,907 | 62.70 |
65+ | 406 715 | 475 771 | 882 486 | 7.45 |
Year | Population | Births | Deaths | Natural change | Crude birth rate | Crude death rate | Natural change | Fertility rates |
---|---|---|---|---|---|---|---|---|
1950 | 2,714 | 134 | 70 | 64 | 46.9 | 24.4 | 22.5 | 6.75 |
1955 | 3,100 | 149 | 73 | 76 | 46.8 | 23.0 | 23.8 | 6.75 |
1960 | 3,353 | 163 | 77 | 86 | 45.9 | 21.5 | 24.4 | 6.63 |
1965 | 3,751 | 181 | 81 | 100 | 45.4 | 20.2 | 25.2 | 6.56 |
1970 | 4,217 | 203 | 85 | 118 | 45.3 | 19.0 | 26.3 | 6.50 |
1975 | 4,786 | 208 | 81 | 127 | 41.1 | 16.0 | 25.1 | 5.80 |
1980 | 5,369 | 220 | 76 | 144 | 38.6 | 13.3 | 25.3 | 5.30 |
1985 | 6,041 | 238 | 72 | 166 | 37.1 | 11.3 | 25.8 | 5.00 |
1990 | 6,794 | 259 | 71 | 188 | 36.0 | 9.9 | 25.1 | 4.8 |
1995 | 7,635 | 263 | 71 | 192 | 32.7 | 8.9 | 23.8 | 4.32 |
2000 | 8,495 | 270 | 72 | 198 | 30.3 | 8.1 | 22.2 | 3.96 |
2005 | 9,355 | 267 | 73 | 194 | 27.3 | 7.5 | 19.8 | 3.50 |
2010 | 10,157 | 274 | 76 | 198 | 25.9 | 7.1 | 18.8 | 3.25 |
2015 | 11,025 | 282 | 79 | 203 | 24.5 | 6.9 | 17.6 | 3.04 |
•All statistics are per 1,000 inhabitants •All data comes from estimations from the United Nations. [7] |
Year | Population | Live births | Deaths | Natural increase | Crude birth rate | Crude death rate | Rate of natural increase | Crude migration rate | TFR |
---|---|---|---|---|---|---|---|---|---|
2010 | 10,029,115 | 299,426 | 45,349 | 254,077 | 29.9 | 4.5 | 25.3 | ||
2011 | 10,192,885 | 312,349 | 45,579 | 266,770 | 30.6 | 4.5 | 26.2 | ||
2012 | 10,356,978 | 310,954 | 48,427 | 262,527 | 30.0 | 4.7 | 25.3 | 3.05 | |
2013 | 10,521,247 | 304,895 | 50,120 | 254,775 | 29.0 | 4.8 | 24.2 | -8.6 | 2.98 |
2014 | 10,685,994 | 294,117 | 50,847 | 243,270 | 27.5 | 4.8 | 22.7 | -7.3 | 2.92 |
2015 | 10,851,103 | 283,011 | 50,476 | 232,535 | 26.1 | 4.7 | 21.4 | -6.2 | 2.86 |
2016 | 11,016,438 | 261,122 | 51,875 | 209,247 | 23.7 | 4.7 | 19.0 | -4.0 | 2.80 |
2017 | 11,181,861 | 251,232 | 50,847 | 200,385 | 22.5 | 4.5 | 18.0 | -3.2 | 2.74 |
2018 | 11,347,241 | 219,790 | 52,380 | 167,410 | 19.4 | 4.6 | 14.8 | -0.2 | 2.69 |
2019 | 11,512,468 | 229,906 | 53,194 | 176,712 | 20.0 | 4.6 | 15.4 | -1.0 | 2.63 |
2020 | 11,677,406 | 213,247 | 79,613 | 133,634 | 18.3 | 6.8 | 11.5 | 2.6 | 2.58 |
2021 | 11,841,955 | 225,439 | 86,461 | 138,978 | 19.0 | 7.3 | 11.7 | 2.2 | 2.54 |
2022 | 12,006,031 | 214,599 | 66,611 | 147,988 | 17.9 | 5.6 | 12.3 | 2.41(e) | |
2023 | 12,169,501 | 199,263 | 54,408 | 144,855 | 16.7 | 4.6 | 12.1 | 2.24(e) | |
2024(c) | 11,312,620 | 183,876 | 58,588 | 125,288 | 16.3 | 5.2 | 11.1 | ||
(c) = Census results.
Total Fertility Rate (TFR) (Wanted Fertility Rate) and Crude Birth Rate (CBR): [16]
Year | CBR (Total) | TFR (Total) | CBR (Urban) | TFR (Urban) | CBR (Rural) | TFR (Rural) |
---|---|---|---|---|---|---|
1989 | 5,0 (3,2) | 4,0 (2,6) | 6,4 (4,1) | |||
1994 | 34 | 4,8 (2,7) | 32 | 3,8 (2,4) | 37 | 6,3 (3,3) |
1998 | 30.4 | 4,2 (2,5) | 27.4 | 3,3 (2,2) | 35.4 | 6,4 (3,2) |
2003 | 28 | 3,8 (2,1) | 26 | 3,1 (1,9) | 32 | 5,5 (2,6) |
2008 | 26 | 3,5 (2,0) | 24 | 2,8 (1,9) | 28 | 4,9 (2,4) |
Period | Life expectancy in Years | Period | Life expectancy in Years |
---|---|---|---|
1950–1955 | 40.0 | 1985–1990 | 53.8 |
1955–1960 | 41.4 | 1990–1995 | 56.5 |
1960–1965 | 43.0 | 1995–2000 | 59.3 |
1965–1970 | 44.7 | 2000–2005 | 62.1 |
1970–1975 | 46.7 | 2005–2010 | 65.0 |
1975–1980 | 48.9 | 2010–2015 | 67.7 |
1980–1985 | 51.2 |
Source: UN World Population Prospects [17]
According to a genetic study done on Bolivians, average values of Native American, European and African ancestry are 86%, 12.5%, and 1.5%, in individuals from La Paz and 76.8%, 21.4%, and 1.8% in individuals from Chuquisaca; respectively. [19]
The vast majority of Bolivians are mestizo (with the indigenous component higher than the European one), although the government has not included the cultural self-identification "mestizo" in the November 2012 census. [20] There are approximately three dozen native groups totaling approximately half of the Bolivian population – the largest proportion of indigenous people in the Americas. Exact numbers vary based on the wording of the ethnicity question and the available response choices. For example, the 2001 census did not provide the racial category "mestizo" as a response choice, resulting in a much higher proportion of respondents identifying themselves as belonging to one of the available indigenous ethnicity choices. Mestizos are distributed throughout the entire country and make up 26% of the Bolivian population, with the predominantly mestizo departments being Beni, Santa Cruz, and Tarija. Most people assume their mestizo identity while at the same time identifying themselves with one or more indigenous cultures. A 2018 estimate of racial classification put mestizo (mixed white and Amerindian) at 68%, indigenous at 20%, white at 5%, cholo at 2%, black at 1%, other at 4%, while 2% were unspecified; 44% attributed themselves to some indigenous group, predominantly the linguistic categories of Quechuas or Aymaras. [18] White Bolivians comprised about 14% of the population in 2006, and are usually concentrated in the largest cities: La Paz, Santa Cruz de la Sierra and Cochabamba, but as well in some minor cities like Tarija and Sucre. The ancestry of whites and the white ancestry of mestizos lies most notably Spain, Italy, Germany, and Croatia. In the Santa Cruz Department, there are several dozen colonies of German-speaking Mennonites from Russia totaling around 40,000 inhabitants (as of 2012 [update] ). [21]
Afro-Bolivians, descendants of African slaves who arrived in the time of the Spanish Empire, inhabit the department of La Paz, and are located mainly in the provinces of Nor Yungas and Sud Yungas. Slavery was abolished in Bolivia in 1831. [22] There are also important communities of Japanese (14,000 [23] ) and Lebanese (12,900 [24] ).
Indigenous peoples, also called "originarios" ("native" or "original") and less frequently, Amerindians, could be categorized by geographic area, such as Andean, like the Aymaras and Quechuas (who formed the ancient Inca Empire), who are concentrated in the western departments of La Paz, Potosí, Oruro, Cochabamba and Chuquisaca. There also are ethnic populations in the east, composed of the Chiquitano, Chané, Guaraní and Moxos, among others, who inhabit the departments of Santa Cruz, Beni, Tarija and Pando.
There are small numbers of European citizens from Germany, France, Italy and Portugal, as well as from other countries of the Americas, as Argentina, Brazil, Chile, Colombia, Cuba, Ecuador, the United States, Paraguay, Peru, Mexico and Venezuela, among others. There are important Peruvian colonies in La Paz, El Alto and Santa Cruz de la Sierra.
There are around 140,000 Mennonites in Bolivia of Friesian, Flemish and German ethnic origins. [25] [26]
A few Bolivians carry some Middle Eastern ancestry, mainly from Syria & Lebanon.
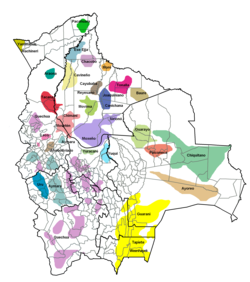
The Indigenous peoples of Bolivia can be divided into two categories of ethnic groups: the Andeans, who are located in the Andean Altiplano and the valley region; and the lowland groups, who inhabit the warm regions of central and eastern Bolivia, including the valleys of Cochabamba Department, the Amazon Basin areas of northern La Paz Department, and the lowland departments of Beni, Pando, Santa Cruz, and Tarija (including the Gran Chaco region in the southeast of the country). Large numbers of Andean peoples have also migrated to form Quechua, Aymara, and intercultural communities in the lowlands.
The official languages of Bolivia are Spanish [27] (60.7%), Quechua [27] (21.2%), Aymara [27] (14.6), and Guaraní [27] (0.6%), plus another 33 native languages. [27] Originally only Spanish, Aymara, and Quechua were the official languages until the 2009 Constitution was passed. [28] [29] According to the 2001 census, 60.7% of the population over six years old are able to speak Spanish and/or speaks it as a native language.
In a 2012 Gallup poll, 87% answered affirmatively when asked "Is religion important in your daily life?" [30] Christianity is the largest religion in Bolivia, with Roman Catholicism being the largest denomination. [31]
Bolivia, officially the Plurinational State of Bolivia, is a landlocked country located in central South America. The country features diverse geography, including vast Amazonian plains, tropical lowlands, mountains, the Gran Chaco Province, warm valleys, high-altitude Andean plateaus, and snow-capped peaks, encompassing a wide range of climates and biomes across its regions and cities. It includes part of the Pantanal, the largest tropical wetland in the world, along its eastern border. It is bordered by Brazil to the north and east, Paraguay to the southeast, Argentina to the south, Chile to the southwest, and Peru to the west. The seat of government is La Paz, which contains the executive, legislative, and electoral branches of government, while the constitutional capital is Sucre, the seat of the judiciary. The largest city and principal industrial center is Santa Cruz de la Sierra, located on the Llanos Orientales, a mostly flat region in the east of the country with a diverse non-Andean culture.
This is a demography of the population of Peru including population density, ethnicity, religious affiliations and other aspects of the population.
The Bolivian Gas War or Bolivian gas conflict was a social confrontation in Bolivia reaching its peak in 2003, centering on the exploitation of the country's vast natural gas reserves. The expression can be extended to refer to the general conflict in Bolivia over the exploitation of gas resources, thus including the 2005 protests and the election of Evo Morales as president. Before these protests, Bolivia had seen a series of similar earlier protests during the Cochabamba protests of 2000, which were against the privatization of the municipal water supply.
Beni, sometimes El Beni, is a northeastern department of Bolivia, in the lowlands region of the country. It is the second-largest department in the country, covering 213,564 square kilometers, and it was created by supreme decree on November 18, 1842, during the administration of General José Ballivián. Its capital is Trinidad.
Bolivia is a unitary state consisting of nine departments. Departments are the primary subdivisions of Bolivia, and possess certain rights under the Constitution of Bolivia. Each department is represented in the Plurinational Legislative Assembly—a bicameral legislature consisting of the Senate and the Chamber of Deputies. Each department is represented by four Senators, while Deputies are awarded to each department in proportion to their total population.
Santa Cruz de la Sierra, commonly known as Santa Cruz, is the largest city in Bolivia and the capital of the Santa Cruz department.
Cochabamba, from Quechua qucha or qhucha, meaning "lake", pampa meaning "plain", is one of the nine departments of Bolivia. It is known to be the "granary" of the country because of its variety of agricultural products from its geographical position. It has an area of 55,631 km2. Its population in the 2024 census was 2,005,373. Its capital is the city of Cochabamba, known as the "City of Eternal Spring" and "The Garden City" because of its spring-like temperatures all year.
Santa Cruz is the largest of the nine constituent departments of Bolivia, occupying about one-third (33.74%) of the country's territory. With an area of 370,621 km2 (143,098 sq mi), it is slightly smaller than Japan or the US state of Montana. It is located in the eastern part of the country, sharing borders in the north and east with Brazil and with Paraguay in the south.
Cochabamba is a city and municipality in central Bolivia in a valley in the Andes mountain range. It is the capital of the Cochabamba Department and the fourth largest city in Bolivia, with a population of 630,587 according to the 2012 Bolivian census. Its name is from a compound of the Quechua words qucha "lake" and pampa, "open plain." Residents of the city and the surrounding areas are commonly referred to as cochalas or, more formally, cochabambinos.
The demographic history of Peru shows the structure of the population in different historical periods. Peru's population drastically increased in the 1900s, with a diverse range of ethnic divisions living in the country. Lima is its capital city situated along the Pacific Ocean coast, where most of its population lives, and its population size is around 9.75 million. Major cities are located near the coastal areas of Peru. In terms of population and area size, it is the fourth and third largest country in South America, a place where the ancestral transcends and all forms of art combine. Peru became an independent country on July 28, 1821. However, Peru did not have a proper national census until 1876, more than a half-century after independence. They took the data before the federal census through different mediums but not on a national level. The significant migration in Peru consisted of Indigenous people, Europeans, enslaved Africans, and Asians; Spaniards were the first European who came to Peru, arrived in 1531, and discovered the Inca culture. The Incas established pre-Columbian America's greatest and most advanced kingdom and monarchy. However, native Americans were still in a larger proportion to total population.
The Media Luna or Media Luna Ampliada refers to a group of four departments – Santa Cruz, Beni, Pando, and Tarija – in Bolivia which are home to a greater proportion of opponents to the national government led by Evo Morales and the Movement for Socialism (MAS) than the rest of the country. Pando has seen increasing support for MAS since 2009, while Tarija was initially supportive but has opposed MAS in every election after 2014. In contrast to the predominantly Indigenous Andean populations of the Andean region such as La Paz and Cochabamba, the departments in the Media Luna are majority mestizo, as well as being made up of the remaining 26 groups of lowland indigenes with white minorities, specifically in Santa Cruz de la Sierra.
The following outline is provided as an overview of and topical guide to Bolivia:
Totora, Tutura or T'utura is a town in the Carrasco Province of the Cochabamba Department in Bolivia. It is the capital and most-populous place of the Totora Municipality. As of the 2012 census, the population is 1,925. The first settlers were the Inca. Totora was officially settled in 1876, and declared a town by the Government of Bolivia in 1894.
Vacas Municipality is the second municipal section of the Arani Province in the Cochabamba Department in central Bolivia. Its capital is Vacas known as the "Land of the potato". During the Inca Empire Vacas served as a tampu along the Inca road system that led to Inkallaqta and Pocona.
Bolivians are people identified with the country of Bolivia. This connection may be residential, legal, historical or cultural. For most Bolivians, several of these connections exist and are collectively the source of their being Bolivian.
The history of the Jews in Bolivia goes back to the colonial period of Bolivia in the 16th century. In the 19th century, Jewish merchants came to Bolivia, most of them taking local women as wives and founding families that merged into the mainstream Catholic society. This was often the case in the eastern regions of Santa Cruz, Tarija, Beni and Pando, where these merchants came either from Brazil or Argentina.
The Baháʼí Faith in Bolivia begins with references to the country in Baháʼí literature as early as 1916. The first Baháʼí to arrive in Bolivia was in 1940 through the beginning of the arrival of coordinated pioneers, people who chose to move for the growth of the religion, from the United States. That same year the first Bolivian joined the religion. The first Baháʼí Local Spiritual Assembly was elected in La Paz in 1945 and the first native Bolivian formally joined the religion in 1956 which soon began spreading widely amongst indigenous Bolivians. The community elected an independent National Spiritual Assembly in 1961. By 1963 there were hundreds of local assemblies. The Baháʼí Faith is currently the largest international religious minority in Bolivia. The largest population of Baháʼís in South America is in Bolivia, a country whose general population is estimated to be 55%-70% indigenous and 30%-42% Mestizo, with a Baháʼí population estimated at 217,000 in 2005 according to the Association of Religion Data Archives.
White Bolivians, also known as Caucasian Bolivians, are Bolivians who have total or predominantly European or West Asian ancestry, most notably from Spain and Germany, and to a lesser extent, Italy and Croatia.
The Indigenous peoples in Bolivia or Native Bolivians are Bolivians who have predominantly or total Amerindian ancestry. They constitute anywhere from 20 to 60% of Bolivia's population of 11,306,341, depending on different estimates, and depending notably on the choice Mestizo being available as an answer in a given census, in which case the majority of the population identify as mestizo, and they belong to 36 recognized ethnic groups. Aymara and Quechua are the largest groups. The geography of Bolivia includes the Andes, the Gran Chaco, the Yungas, the Chiquitania and the Amazon Rainforest.