| Demographics of Argentina | |
|---|---|
 Population pyramid of Argentina in 2026 | |
| Population | |
| Density | |
| Growth rate | |
| Birth rate | |
| Death rate | |
| Life expectancy | |
| • male | |
| • female | |
| Fertility rate | |
| Infant mortality rate | |
| Net migration rate | |
| Age structure | |
| 0–14 years | |
| 15–64 years | |
| 65 and over | |
| Sex ratio | |
| Total | 0.98 male(s)/female (2023 est.) [3] |
| At birth | 1.07 male(s)/female |
| Under 15 | 1.06 male(s)/female |
| 15–64 years | 1.01 male(s)/female |
| 65 and over | 0.74 male(s)/female |
| Nationality | |
| Nationality | Argentine |
| Major ethnic | |
| Minor ethnic | |
| Language | |
| Official | Spanish (96.8%) [6] |
| Spoken | |
This is a demography of Argentina including population density, ethnicity, economic status, age and other aspects of the population.
Contents
- Population size and structure
- Cities
- Provinces and districts
- Structure of the population
- Vital statistics
- Total fertility rates by province
- UN estimates
- Ethnic groups
- White Argentines
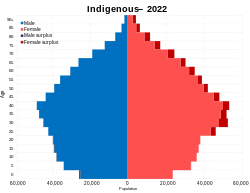
- Indigenous peoples
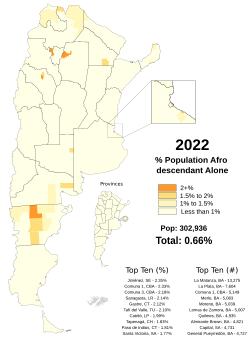
- Black Argentines
- Immigration to Argentina
- Languages
- Non-indigenous minority languages
- Religion
- Gallery
- See also
- References
- External links
As of the 2022 census [INDEC], Argentina had a population of 46,044,703 [7] - a 15.3% increase from the 40,117,096 counted in the 2010 census [INDEC]. [8]
Argentina ranks third in South America in total population and 33rd globally. The country's population density is of 16.9 people per square kilometer of land area - well below the world average of 62 people. Argentina's population growth rate in 2023 was estimated to be 0.23% annually, with a birth rate of 9.9 per 1,000 inhabitants and a mortality rate of 7.6 per 1,000 inhabitants.
The proportion of people under 15, at 20%, is well below the world average (25%), and the cohort of people 65 and older is relatively high, at 12%. [7] The percentage of senior citizens in Argentina has long been second only to Uruguay in Latin America and well above the world average, which is currently 9.8%.
The median age is approximately 34 years, [1] and life expectancy at birth is of 78 years. [9] According to an official cultural consumption survey conducted in 2006, 42.3% of Argentines speak English (though only 15.4% of those claimed to have a high level of English comprehension), 9.3% speak Portuguese [10] and 5.9% speak Italian. [11]