Brazilians are mainly concentrated in the eastern part of the country, which comprises the Southeast, South, and Northeast. But it also has a significant presence in large cities in the Center-West and North.[5] According to the 2022 census, Brazil had 88,252,121 White people, 92,083,286 Mixed people, 20,656,458 Black people, 850,132 Asian people, and 1,227,640 Indigenous people.[2]
Historical population of BrazilPopulation of Brazil, 1550–2005Life expectancy in Brazil since 1900Life expectancy in Brazil since 1960 by gender
According to the 2008 PNAD (National Household Sample Survey), conducted by the IBGE, the Brazilian Statistics bureau, there were about 189,953,000 inhabitants in 2008.[8] As of the latest (2022) census, the Brazilian government estimates its population at 203 million.
The population of Brazil is estimated based on various sources from 1550 to 1850. The first official census took place in 1872. From that year, every 10 years (with some exceptions) the population is counted.[9]
Brazil is the seventh most populated country in the world.
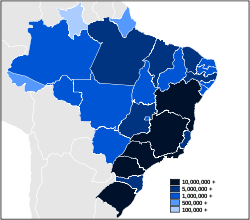
Population distribution in Brazil is very uneven. The majority of Brazilians live within 300km (190mi) of the coast, while the interior in the Amazon Basin is highly remote. Therefore, the densely populated areas are on the coast and the sparsely populated areas are in the interior.
UN estimates
According to the 2022 revision of the World Population Prospects[11][12] the population was 214,326,223 in 2021, compared to only 53,975,000 in 1950. The proportion of children below the age of 15 in 2015 was 20.7%, 69.8% was between 15 and 61 years of age, while 9.5% was 65 years or older.[13]
Year
Total population ( × 1000)
Population percentage in age bracket
aged <15
aged 15–64
aged 65+
1950
53 975
41.6%
55.5%
3.0%
1955
62 656
42.0%
55.0%
3.0%
1960
72 494
43.1%
53.7%
3.1%
1965
84 130
43.6%
53.0%
3.4%
1970
95 982
42.3%
54.2%
3.5%
1975
108 431
40.2%
56.0%
3.8%
1980
122 200
38.4%
57.6%
4.0%
1985
136 836
36.9%
59.0%
4.1%
1990
150 393
35.4%
60.1%
4.5%
1995
162 755
32.4%
62.6%
5.0%
2000
175 786
29.7%
64.7%
5.6%
2005
188 479
27.5%
66.2%
6.3%
2010
198 614
24.9%
68.4%
6.7%
2015
207 848
22.5%
69.5%
9.0%
2020
215 963
19.7%
69.8%
10.5%
Structure of the population
Population by Sex and Age Group (Census 30.VII.2010):[14]
Age group
Male
Female
Total
%
Total
93 406 990
97 348 809
190 755 799
100
0–4
7 016 987
6 779 171
13 796 158
7.23
5–9
7 624 144
7 345 231
14 969 375
7.85
10–14
8 725 413
8 441 348
17 166 761
9.00
15–19
8 558 868
8 432 004
16 990 872
8.91
20–24
8 630 229
8 614 963
17 245 192
9.04
25–29
8 460 995
8 643 419
17 104 414
8.97
30–34
7 717 658
8 026 854
15 744 512
8.25
35–39
6 766 664
7 121 915
13 888 579
7.28
40–44
6 320 568
6 688 796
13 009 364
6.82
45–49
5 692 014
6 141 338
11 833 352
6.20
50–54
4 834 995
5 305 407
10 140 402
5.32
55–59
3 902 344
4 373 877
8 276 221
4.34
60–64
3 041 035
3 468 085
6 509 120
3.41
65-69
2 224 065
2 616 745
4 840 810
2.54
70-74
1 667 372
2 074 264
3 741 636
1.96
75-79
1 090 517
1 472 930
2 563 447
1.34
80-84
668 623
998 349
1 666 972
0.87
85-89
310 759
508 724
819 483
0.43
90-94
114 964
211 594
326 558
0.17
95-99
31 529
66 806
98 335
0.05
100+
7 247
16 989
24 236
0.01
Age group
Male
Female
Total
Percent
0–14
23 366 544
22 565 750
45 932 294
24.08
15–64
63 925 370
66 816 658
130 742 028
68.54
65+
6 115 076
7 966 401
14 081 477
7.38
Population by Sex and Age Group (Census 01.VIII.2022):[2]
Age group
Male
Female
Total
%
Total
98 532 431
104 548 325
203 080 756
100
0–4
6 461 689
6 243 171
12 704 860
6.26
5–9
7 011 282
6 738 158
13 749 440
6.77
10–14
6 992 746
6 682 215
13 674 961
6.73
15–19
7 317 515
7 058 427
14 375 942
7.08
20–24
7 767 306
7 699 157
15 466 463
7.62
25–29
7 627 458
7 842 265
15 469 723
7.62
30–34
7 537 285
7 935 832
15 473 117
7.62
35–39
7 827 333
8 345 458
16 172 791
7.96
40–44
7 781 059
8 291 111
16 072 170
7.91
45–49
6 549 109
7 091 003
13 640 112
6.72
50–54
6 014 391
6 584 190
12 598 581
6.20
55–59
5 419 505
6 149 601
11 569 106
5.70
60–64
4 605 834
5 338 555
9 944 389
4.90
65-69
3 588 052
4 288 180
7 876 232
3.88
70-74
2 615 350
3 243 186
5 858 536
2.88
75-79
1 657 786
2 189 593
3 847 379
1.89
80-84
1 009 852
1 465 178
2 475 030
1.22
85-89
493 649
835 554
1 329 203
0.65
90-94
194 341
385 388
579 729
0.29
95-99
50 319
114 859
165 178
0.08
100+
10 570
27 244
37 814
0.02
Age group
Male
Female
Total
Percent
0–14
20 465 717
19 663 544
40 129 261
19.76
15–64
68 446 795
72 335 599
140 782 394
69.32
65+
9 619 919
12 549 182
22 169 101
10.92
Census 30 July 2010
Brazil 100%
European 47.73%
African 7.61%
Asian 1.09%
Pardo (Multiracial) 43.13%
Native Indigenous 0.43%
Population 0–14
45,932,294
20,460,482
2,698,639
420,952
22,055,573
295,862
Percent group 0–14 in race
24.08%
22.47%
18.59%
20.02%
26.81%
36.17%
Population 0–14 compared to racial groups
100%
44.54%
5.88%
0.92%
48.02%
0.64%
Population 15–49
105,816,285
49,381,206
8,693,350
1,178,391
46,156,227
402,079
Proportions 0–14 to 15–49
0,43407
0,41434
0,31043
0,35723
0,47785
0,73583
Age group
Brazil 100% (percent of the population)
European 47.73% (percent in the race/percent in the age group)
African 7.61% (percent in the race/percent in the age group)
Asian 1.09% (percent in the race/percent in the age group)
Pardo (Multiracial) 43.13% (percent in the race/percent in the age group)
Native Indigenous 0.43% (percent in the race/percent in the age group)
In Brazil, most important cities are on the coast or close to it. State capitals are also, commonly, the largest city of their states. Notable exceptions to this are Vitória, the capital of Espírito Santo, and Florianópolis, the capital of Santa Catarina.
São Paulo and Rio de Janeiro are far larger than any other Brazilian cities. São Paulo's influence in most economic aspects can be noted in a national (and even international) scale; Rio de Janeiro – partially due to its former status as the national capital – still host various large corporations' headquarters, besides being Brazil's cultural center with respect to film production and other such televised media. Brasília, the capital of Brazil, is its 3rd biggest city.
In some states in the North and Northeast, the fertility rate was higher than the national average in 2021. The highest rate was in Acre, with 1.98 children per woman. Other regions with high fertility include Amapá, with 1.87 children per woman, Amazonas, 1.85 in Roraima, 1.84, in Maranhão, 1.82, and Pará, 1.79.
Regarding race of mothers, between 2015 and 2021, the fertility rate of all racial groups fell below replacement rate. Black fertility fell from 2.01 to 1.76, Pardo/Mixed fertility fell from 1.95 to 1.73 and white fertility fell from 1.60 to 1.55. There was no information regarding Asian fertility rates. Indigenous fertility was calculated at 3.87 children per women in 2010.[25]
According to the 2022 census, the total fertility by race was:[26]
Registration of vital events in Brazil has considerably improved during the past decades but is still not considered complete, especially in the northern part of the country. The Population Division of the United Nations prepared the following estimates and forecasts.[13]
Period
Live births per year
Deaths per year
Natural change per year
CBR*
CDR*
NC*
TFR*
IMR*
Life expectancy
Total
Males
Females
1950–1955
2 578 000
908,000
1 670 000
44.2
15.6
28.6
6.15
135
50.9
49.2
52.6
1955–1960
2 923 000
956,000
1 967 000
43.3
14.1
29.1
6.15
122
53.3
51.5
55.2
1960–1965
3 315 000
988,000
2 327 000
42.3
12.6
29.7
6.15
109
55.7
53.8
57.6
1965–1970
3 345 000
975,000
2 370 000
37.2
10.8
26.4
5.38
100
57.6
55.7
59.6
1970–1975
3 462 000
973,000
2 489 000
33.9
9.5
24.4
4.72
91
59.5
57.3
61.8
1975–1980
3 788 000
1 035 000
2 753 000
32.9
9.0
23.9
4.31
79
61.5
59.2
63.9
1980–1985
4 006 000
1 078 000
2 928 000
28.9
8.3
22.6
3.30
63
63.4
60.4
66.8
1985–1990
3 790 000
1 079 000
2 711 000
24.4
7.5
18.9
2.95
52
65.3
61.9
69.1
1990–1995
3 547 000
1 074 000
2 473 000
22.0
6.9
15.8
2.40
43
67.3
63.6
71.2
1995–2000
3 658 000
1 052 000
2 606 000
20.6
6.2
15.4
2.21
34
70.3
66.5
74.3
2000–2005
3 370 000
1 102 000
2 268 000
17.8
5.9
13.9
2.05
27
71.9
68.2
75.8
2005–2010
3 066 000
1 149 000
1 917 000
15.4
5.9
10.5
1.81
24
73.2
69.7
76.9
2010–2015
2 975 000
1 227 000
1 748 000
13.0
5.9
9.1
1.76
19
74.8
71.2
78.5
2015–2020
2 934 000
1 338 000
1 596 000
11.8
6.3
7.5
1.63
16
76.5
73.0
80.1
2020–2025
2 763 000
1 477 000
1 286 000
10.7
6.7
6.0
2025–2030
2 585 000
1 625 000
960 000
11.7
7.1
4.6
2030–2035
2 445 000
1 781 000
664 000
10.9
7.7
3.2
2035–2040
2 318 000
1 945 000
373 000
10.3
8.3
2.0
CBR = crude birth rate (per 1000); CDR = crude death rate (per 1000); NC = natural change (per 1000); IMR = infant mortality rate per 1000 births; TFR = total fertility rate (number of children per woman)
Childlessness and education
The color or race of the woman and the level of education has also shown to influence the fact of not having children. In 2013, among white women aged 15 to 55 years, 41.5% had no children, while among black and brown women, the percentage was 35.8%.
The proportional difference is even greater among white women compared to black and brown 25–29 years. While the proportion among white women childless was 48.1% among black and brown women was 33.8%.
Regarding education, among women 15–49 years of age with more than eight years of schooling, 50% had no children in 2013, while among those with up to seven years of study this figure was 5%.
Schooling among women 25–29 years has shown an even greater disparity. Among the less educated, 16.3% had no children, while among the more educated 54.5% had no children. The proportion of women aged 45 to 49 without children was 8.2% in 2013 among those with less education and 15.1% among those with more years of schooling.
Immigration to Brazil, by national origin, periods from 1830 to 1933 Source: Brazilian Institute for Geography and Statistics (IBGE)
Origin
1830–1855
1856–1883
1884–1893
1894–1903
1904–1913
1914–1923
1924–1933
1934–2023
Portuguese
16,737
116,000
170,621
155,542
384,672
201,252
233,650
400,000
Italians
—
100,000
510,533
537,784
196,521
86,320
70,177
Spaniards
—
—
113,116
102,142
224,672
94,779
52,400
Germans
2,008
30,000
22,778
6,698
33,859
29,339
61,723
Japanese
—
—
—
—
11,868
20,398
110,191
Lebanese
—
—
96
7,124
45,803
20,400
20,400
Others
—
—
66,524
42,820
109,222
51,493
164,586
Immigration has been a very important demographic factor in the formation, structure and history of the population in Brazil, influencing culture, economy, education, racial issues, etc. Brazil has received the third largest number of immigrants in the Western Hemisphere.
Brazil's structure, legislation and settlement policies for arriving immigrants were much less organized than in Canada and the United States at the time. Nevertheless, an Immigrant Inn (Hospedaria dos Imigrantes) was built in 1886 in São Paulo, and quick admittance and recording routines for the throngs of immigrants arriving by ship at the seaports of Vitória, Rio de Janeiro, Santos, Paranaguá, Florianópolis and Porto Alegre were established. The São Paulo State alone processed more than 2.5million immigrants in its almost 100 years of continuous operation. People of more than 70 different nationalities were recorded.
Following the trend of several other countries in the Americas, which encouraged immigration from many countries, Brazil quickly became a melting pot of races and nationalities, but being peculiar in the sense of having the highest degree of intermarriage in the world. Immigrants found a strong social and cultural tolerance toward inter-racial marriage, including large numbers of Mulattoes (European and African), Caboclos (Indian and European) and mixed European, African and Indian people, though it was not accompanied by an entire lack of racism. Correspondingly, the same mentality reflected in low psychological and social barriers regarding intermarriage between Europeans, Middle Easterners and Asians of several origins, as well as between people of different religions.
History of immigration
It is postulated that the Americas were settled by three migratory waves from Northern Asia. The Native Brazilians are thought to descend from the first wave of migrants, who arrived in the region around 9000 BC. The main Native Brazilian groups are the Tupi-Guarani, the Jê, the Arawaks and the Caraibas (Kalina or Caribs). The Tupi-Guarani nation, originally from the Paraná River basin and also one of the largest of the Native-Paraguayan nations, had spread all along the Brazilian coastline from South to North and came to be known by the Portuguese as "Os Índios da Língua Geral" ("The Indians of the General Language"); the Jê nation occupied most of the interior of the country from Maranhão to Santa Catarina. The Arawaks and the Caribs, the last ones to get in contact with the Portuguese, lived in the North and Northwest of Brazil.
The European immigration to Brazil started in the 16th century, with the vast majority of them coming from Portugal. In the first two centuries of colonization, 100,000 Portuguese arrived in Brazil (around 500 colonists per year). In the 18th century, 600,000 Portuguese arrived (6,000 per year).[33] The first region to be settled by the Portuguese was Northeastern Brazil, followed by the Southeast region. The original Amerindian population of Brazil (between two and five million) largely died from disease or violence or was assimilated into the Portuguese population.[34] The Mamelucos (or Caboclos, a mixed race between Europeans and Amerindians) have always been present in many parts of Brazil.
Another important ethnic group, Africans, first arrived as slaves. Many came from Guinea-Bissau, or from West African countries – by the end of the eighteenth century many had been taken from the Kingdom of Kongo and modern-day Angola, Congo, Mozambique, Benin and Nigeria. By the time of the end of the slave trade in 1850, around six million slaves had been brought to Brazil–50% of all slave traffic between Africa and the Americas. Nowadays, there are still small immigration waves coming from the African continent. The largest influx of European immigrants to Brazil occurred in the late 19th and early 20th centuries. According to the Memorial do Imigrante statistics data, Brazil attracted nearly 5 million immigrants between 1870 and 1953.[35][36]
Notably, the first half of the 20th century saw a large inflow of Japanese (mainly from Honshū, Hokkaidō and Okinawa) and Levantine Christians from Lebanon (and few from Syria). These Christian Levantine immigrants were wrongly called "Turks" by many Brazilians because their original countries were still under Ottoman rule back in the period when their immigration to Brazil began. The number of actual Turks who immigrated to Brazil was in fact very small. Chinese, Taiwanese and Koreans influx became common after the 1950s.
IBGE's 1998 PME
On the other hand, in 1998, the IBGE, within its preparation for the 2000 census, experimentally introduced a question about "origem" (origin/ancestry) in its "Pesquisa Mensal de Emprego" (Monthly Employment Research), to test the viability of introducing that variable in the census[37]:3 (the IBGE ended by deciding against the inclusion of questions about it in the census). This research interviewed about 90,000 people in six metropolitan regions (São Paulo, Rio de Janeiro, Porto Alegre, Belo Horizonte, Salvador, and Recife).[37]:note 3,p.3 To this day, it remains the only actual published survey about the immigrant origin of Brazilians.
‡This is higher than 100% because of multiple answers. Many Brazilians are unaware of their ancestry, especially those whose ancestors migrated to Brazil long ago; hence the high number who declared themselves only as Brazilians.
Emigration
In the second half of the 1980s, Brazilians from various socioeconomic backgrounds started to emigrate to other countries in search of better economic opportunities.
By the 1990s, nearly 1.9 million Brazilians were living outside the country, mainly in the United States, Paraguay and Japan,[38] but also in Italy, Portugal, the United Kingdom, France, Canada, Australia, Switzerland, Germany, Belgium, Spain and Israel. Despite the surge in the phenomenon, there were no specific policies implemented by the government to encourage or discourage this emigration process.[39] Thanks to the favourable outlook of the Brazilian economy and due to the crisis that hit countries such as Japan, Portugal or the United States, emigration of Brazilian citizens stagnated – with many returning to their home country – until 2011, when 1,898,762 Brazilians were living abroad.
The 2000 Brazilian census provides some information about the high number of migrants returning to Brazil. For instance, of those who reported residing in another country less than 10 years before the 2000 census, 66.9 percent were Brazilians. If only the returning migrants (former Brazilian immigrants) are considered, 26.8 percent of Brazilians came from Paraguay, 17 percent came from Japan, and 15.8 percent came from the United States.[39]
As political unrest, increasing violence, inflation, soaring unemployment rates and an economic crisis hit Brazil, millions of citizens moved abroad starting in 2011, generating the largest emigration process ever witnessed in Brazilian history, since Brazil has historically been a land of immigrants. In 2021 more than 4.4 million Brazilians live abroad,[40] this is an increase of around 132% compared to the previous 10 years.
The largest Brazilian community abroad, comprising almost half of the diaspora, is the one in the US, where around 2,000,000 Brazilians live; they are present especially in Florida. Almost 300,000 Brazilians, hence 6.8% of all Brazilians living abroad, lived in other Portuguese-speaking countries (94% in Portugal). In the same year around 680,000 Brazilians, hence 15.5% of the Brazilian diaspora, lived in Spanish-speaking countries, with the majority found in neighbouring countries such as Paraguay and Uruguay.
Brazilians are one of the most diverse populations in the world, as a result of the crosses between peoples from three continents: the European colonizers, represented mainly by the Portuguese; Africans; and the autochthonous Amerindians.[41] By 1500, around 2.5 million indigenous people were living in the area of what is now Brazil. It is estimated that about 500,000 Portuguese arrived in Brazil, between 1500 and 1808. The Portuguese-Amerindian admixture started soon after the arrival of the first Portuguese, in 1500. The native groups underwent a demographic decline due to conflicts with colonizers and diseases.[41] Portugal remained as the only significant source of European immigrants to Brazil until 1808, when Brazilian ports were legally opened to all friendly nations.[42] From then, Brazil received increasing numbers of immigrants, mostly from Portugal, followed by Italy, Spain, and Germany. In the 20th century, Asian immigrants also starting arriving, mainly from Japan, but also from Lebanon and Syria.[41]
The Brazilian Institute of Geography and Statistics (IBGE), which has conducted censuses in Brazil since 1940, racially classifies the Brazilian population in five categories: Branco (White), "Pardo" (brown), Preto (Black), Amarelo (Yellow - for people of East-Asian descent, such as Japanese, Chinese, Korean), and Indígena (Indigenous). Brazilians tend to classify themselves racially based on physical appearance, such as skin pigmentation, hair type, nose shape, and lip shape. There appears to be no racial descent rule operational in Brazil and it is even possible for two full siblings differing in color to belong to completely diverse racial categories. A 2016 survey found out that approximately 17–19% of Brazilian families have full siblings who are identified as different races. More than 80% of families with different-race siblings had one sibling identified as White and another identified as Pardo (brown). About 40% of families with one White and one non-White parent have different-race siblings.[43][44][45]
Italian regional immigration to Brazil, which has the most people of Italian origin outside Italy. Unlike other countries with Italian immigrants, Brazil prioritized Northern Italy which it considered more developedGerman settlements in Southern Brazil
According to the 2022 census, there were 88,2 million white Brazilians, comprising 43.5% of Brazil's population.[3] Descendants of Europeans are found in the entire territory of Brazil, although they are most concentrated in the south and southeastern parts of the country.[46][47] A survey conducted in 1998 by the Minas Gerais sociologist Simon Schwartzman interviewed about 34 million Brazilians, of whom nearly 20 million declared themselves white. Asked the ethnic origin of the participants of white race, a plurality pointed only Brazilian origin (53%). More than half, however, managed to point to a foreign origin: 17.2% indicated Portuguese ancestry, 16.50% Italian, 9.42% Spanish, 6.51% German and 12.32% other origins, which include Polish, Ukrainian, Russian, Lithuanian, Dutch, Austrian, Swiss, French, Hungarian, Norwegian, partial distant African, indigenous, British, American Confederate, Jewish (mostly Ashkenazi, but also Sephardi including Jews from Morocco and Egypt) and Arab.[48][49] Many Whites in Brazil have some Amerindian and/or African ancestry (similarly found in European-Americans[50] and European-Argentines).[51]
Nowadays, European-Brazilians come from a very diverse background, which includes:
Portuguese: Most Brazilians are fully or partly of Portuguese ancestry. Portuguese settlers began arriving in 1500. Immigration increased during the 18th century and reached its peak in the late 19th and early 20th centuries.
Italians started arriving in Brazil in 1875, making up the main group of immigrants in the late 19th century.[52] First they settled in rural communities across Southern Brazil. In the early 20th century, they mostly settled in the coffee plantations in the Southeast, later moving to São Paulo capital to work in factories or starting their own businesses in trade, services and industry like businessman and industrialist count Francesco Matarazzo. In São Paulo, which came to be labeled an "Italian city" in the early twentieth century, Italians engaged mainly in the incipient industry and urban services activities. They came to represent 60% of the 60,000 workers employed in São Paulo factories in 1901.[53]Talian, or the Venetian dialect, is the third most spoken mother tongue in the nation.[54][55]
Poles came in significant numbers to Brazil after 1870. Most of them settled in the State of Paraná, working as small farmers.
Spaniards came in large numbers to Brazil, starting in the late 19th century. Most of them were attracted to work in the coffee plantations in the state of São Paulo.[59]
Ukrainians came mostly in the late 19th century. Currently they number approximately 980,000, most of whom live in a compact settlement in south central Paraná.[60]
Brazil does not have a category for multiracial people, but a Pardo (brown) one, which may include caboclos, mulatos, cafuzos (local ethnonyms for people of noticeable mixed European and Amerindian, African and European, and Amerindian and African descent, i.e., mestizos, mulattoes and zambos, respectively), the multiracial result of their intermixing (despite most of White and Black Brazilians possessing some degree of race-mixing, since brownness in Brazil is a matter of phenotype) and assimilated, westernized indigenous people.[61][62]
The Pardos make up 45.3% or 92.1 million people of Brazil's population.[63] They live in the entire territory of Brazil. Although, according to DNA resources, most Brazilians possess some degree of mixed-race ancestry, less than 45% of the country's population classified themselves as being part of this group due to phenotype.[64]
According to the 2022 census, self-declared Yellow Brazilians number 850,130, or 0.42% of Brazil's population. Yellow is the term used for people of East Asian (Japanese, Korean, Chinese) descent.[65] In 2022, Japan's Ministry of Foreign Affairs stated that there were 2 million Japanese descendants in Brazil.[66] Brazil has the largest population of Japanese descent outside Japan.[67]Japanese immigration to Brazil started on 18 June 1908, when the Japanese ship Kasato-Maru arrived in the Port of Santos, south of São Paulo, carrying the first 781 people to take advantage of a bilateral agreement promoting immigration.
There are also smaller communities of Korean people and Chinese origin.[68]
The Amerindians make up 0.8% of Brazil's population, or about 1.6 million people. Over half of them (867,000 ou 51,2%) live in the regions of the Amazon rainforest ("Amazônia Legal").[69] Millions of Brazilians possess at least one Native South American ancestor, according to a mitochondrial DNA study, but only 0.8% self-identify as indigenous, due to race-mixing.[41]
Genetic studies
Genetic studies have shown the Brazilian population as a whole to have European, African and Native American components. A 2015 autosomal DNA genetic study, which also analysed data of 25 studies of 38 different Brazilian populations concluded that: European ancestry accounts for 62% of the heritage of the population, followed by the African (21%) and the Native American (17%). The European contribution is highest in Southern Brazil (77%), the African highest in Northeast Brazil (27%) and the Native American is the highest in Northern Brazil (32%).[70]
An autosomal DNA study (2011), with nearly 1000 samples from every major race group ("whites", "pardos" and "blacks", according to their respective proportions) all over the country found out a major European contribution, followed by a high African contribution and an important Native American component.[71]
"In all regions studied, the European ancestry was predominant, with proportions ranging from 60.6% in the Northeast to 77.7% in the South". The 2011 autosomal study samples came from blood donors (the lowest classes constitute the great majority of blood donors in Brazil[72]), and also public health institutions personnel and health students.
An autosomal study from 2013, with nearly 1300 samples from all of the Brazilian regions, found a predominant degree of European ancestry combined with African and Native American contributions, in varying degrees. 'Following an increasing North to South gradient, European ancestry was the most prevalent in all urban populations (with values up to 74%). The populations in the North consisted of a significant proportion of Native American ancestry that was about two times higher than the African contribution. Conversely, in the Northeast, Center-West and Southeast, African ancestry was the second most prevalent. At an intrapopulation level, all urban populations were highly admixed, and most of the variation in ancestry proportions was observed between individuals within each population rather than among population'.[73]
An autosomal DNA study from 2009 found a similar profile: "all the Brazilian samples (regions) lie more closely to the European group than to the African populations or to the Mestizos from Mexico".[75]
A 2015 autosomal genetic study, which also analysed data of 25 studies of 38 different Brazilian populations concluded that: European ancestry accounts for 62% of the heritage of the population, followed by the African (21%) and the Native American (17%). The European contribution is highest in Southern Brazil (77%), the African highest in Northeast Brazil (27%) and the Native American is the highest in Northern Brazil (32%).[70]
Pairwise estimates of F(st) among the five Brazilian geopolitical regions suggested little genetic differentiation only between the South and the remaining regions. Estimates of ancestry results are consistent with the heterogeneous genetic profile of Brazilian population, with a major contribution of European ancestry (0.771) followed by African (0.143) and Amerindian contributions (0.085). The described multiplexed SNP panels can be useful tool for bioanthropological studies but it can be mainly valuable to control for spurious results in genetic association studies in admixed populations".[77]
According to another autosomal DNA study from 2008, by the University of Brasília (UnB), European ancestry dominates in the whole of Brazil (in all regions), accounting for 65.90% of heritage of the population, followed by the African contribution (24.80%) and the Native American (9.3%).[78]
São Paulo state, the most populous state in Brazil, with about 40 million people, showed the following composition, according to an autosomal study from 2006: European genes account for 79% of the heritage of the people of São Paulo, 14% are of African origin, and 7% Native American.[79] A study from 2013 found the following composition in São Paulo state: 70% European, 20% African, 6% Asian and 4% Native American.[80] Another study focused on highly admixed populations yielded similar results.[81]
According to the 2022 census, in the South Whites make up 72.6% of the population, Pardo (brown) 21.7%, Blacks 5%, 0.4% Yellow (Asian descent) and 0.3% Indigenous [83]
The South of Brazil is the region with the largest percentage of Whites. According to the 2005 census, people of Whites account for 87% of the population.[67] In colonial times, this region had a very small population.
The region what is now Southern Brazil was originally settled by Amerindian peoples, mostly Guarani and Kaingangs.[84] Only a few settlers from São Paulo were living there. This situation made the region vulnerable to attacks from neighboring countries. This fact forced the King of Portugal to decide to populate the region. For this, settlers from the Portuguese Azores islands were sent to the coast in 1617.[85]
To stimulate the immigration to Brazil, the king offered several benefits for the Azorean couples. Between 1748 and 1756, six thousand Portuguese from the Azores moved to the coast of Santa Catarina. They were mainly newly married who were seeking a better life. At that time, the Azores were one of the poorest regions of Portugal.
They established themselves mainly in the Santa Catarina Island, nowadays the region of Florianópolis. Later, some couples moved to Rio Grande do Sul, where they established Porto Alegre, the capital. The Azoreans lived on fishing and agriculture, especially flour. They composed over half of Rio Grande do Sul and Santa Catarina's population in the late 18th century.[86] The state of Paraná was settled by colonists from São Paulo due to their proximity (Paraná was part of São Paulo until the mid-19th century).
With the development of cattle in the interior of Rio Grande do Sul, African slaves began arriving in large numbers. By 1822, Africans were 50% of Rio Grande do Sul's population. This number decreased to 25% in 1858 and to only 2.2% in 2015. Most of them came from Angola.[87]
After independence from Portugal (1822) the Brazilian government started to stimulate the arrival of a new wave of immigrants to settle the South. In 1824 they established São Leopoldo, a German community. Major Schaeffer, a German who was living in Brazil, was sent to Germany in order to bring immigrants. From Rhineland-Palatinate, the Major brought the immigrants and soldiers. Settlers from Germany were brought to work as small farmers, because there were many land holdings without workers.[88]
To attract the immigrants, the Brazilian government had promised large tracts of land, where they could settle with their families and colonize the region. The first years were not easy. Many Germans died of tropical disease, while others left the colonies to find better living conditions. The German colony of São Leopoldo was a disaster. Nevertheless, in the following years, a further 4,830 Germans arrived at São Leopoldo, and then the colony started to develop, with the immigrants establishing the town of Novo Hamburgo (New Hamburg).[89]
From São Leopoldo and Novo Hamburgo, the German immigrants spread into others areas of Rio Grande do Sul, mainly close to sources of rivers. The whole region of Vale dos Sinos was populated by Germans. During the 1830s and part of the 1840s German immigration to Brazil was interrupted due to conflicts in the country (Ragamuffin War). The immigration restarted after 1845 with the creation of new colonies. The most important ones were Blumenau, in 1850, and Joinville in 1851, both in Santa Catarina state; these attracted thousands of German immigrants to the region. In the next five decades, other 28 thousand Germans were brought to Rio Grande do Sul to work as small farmers in the countryside.[90] By 1914, it is estimated that 50 thousand Germans settled in this state.
Another immigration boom to this region started in 1875. Communities with Italian immigrants were also created in southern Brazil. The first colonies to be populated by Italians were created in the highlands of Rio Grande do Sul (Serra Gaúcha). These were Garibaldi and Bento Gonçalves. These immigrants were predominantly from Veneto, in northern Italy. After five years, in 1880, the great numbers of Italian immigrants arriving caused the Brazilian government to create another Italian colony, Caxias do Sul. After initially settling in the government-promoted colonies, many of the Italian immigrants spread themselves into other areas of Rio Grande do Sul seeking further opportunities.[91]
They created many other Italian colonies on their own, mainly in highlands, because the lowlands were already populated by Germans and native gaúchos. The Italian established many vineyards in the region. Nowadays, the wine produced in these areas of Italian colonization in southern Brazil is much appreciated within the country, though little is available for export. In 1875, the first Italian colonies were established in Santa Catarina, which lies immediately to the north of Rio Grande do Sul. The colonies gave rise to towns such as Criciúma, and later also spread further north, to Paraná.
A significant number of Poles have settled in Southern Brazil. The first immigrants arrived in 1869 and until 1959, it is estimated that over 100,000 Poles migrated to Brazil,[92] 95% of whom were peasants. The State of Paraná received the majority of Polish immigrants, who settled mainly in the region of Curitiba, in the towns of Mallet, Cruz Machado, São Matheus do Sul, Irati, and União da Vitória.[93]
According to the 2022 census, in the Southeast Whites make up 49.9% of the population, Pardo (brown) 38.7%, Blacks 10.6%, Yellow (Asian descent) 0.7% and Indigenous 0.1%.[83] The Southeastern region of Brazil is the most ethnically diverse and most populated part of the country.
Southeast Brazil is home to the oldest Portuguese village in the Americas, São Vicente, São Paulo, established in 1532.[94] The region, since the beginning of its colonization, is a melting pot of Africans, Natives, and Europeans. The Indigenous peoples of the region were enslaved by the Portuguese.
The race mixing between the indigenous females and their European masters produced the Bandeirante, the colonial inhabitant of São Paulo, who formed expeditions that crossed the interior of Brazil and greatly increased the Portuguese colonial territory. The main language spoken by these people of mixed Indian/Portuguese heritage was Língua geral, a language that mixed Tupi and Portuguese words.
In the late 17th century the Bandeirantes found gold in the area that nowadays is Minas Gerais. A gold rush took place in Brazil and thousands of Portuguese colonists arrived during this period. The confrontation between the Bandeirantes and the Portuguese for obtaining possession of the mines led to the Emboabas' War.
The Portuguese won the war. The Amerindian culture declined, giving space to a stronger Portuguese cultural domination. In order to control the wealth, the Portuguese Crown moved the capital of Brazil from Salvador, Bahia to Rio de Janeiro. Thousands of African slaves were brought to work in the gold mines.
They were landed in Rio de Janeiro and sent to other regions. By the late 18th century, Rio de Janeiro was an "African city": most of its inhabitants were slaves. No other place in the world had as many slaves since the end of the Roman Empire.[95] In 1808 the Portuguese royal family, fleeing from Napoleon, took charge in Rio de Janeiro. Some 23,000 Portuguese nobles moved to Brazil. The change in region was significant, becoming more European.
After independence and principally after 1850, Southeast Brazil was "inundated" by European immigrants, who were attracted by the government to replace the African slaves in the coffee plantations. Most immigrants landed in the Port of Santos and have been forwarded to the coffee farms within São Paulo.
The vast majority of the immigrants came from Italy. Brazil attracted nearly 5 million immigrants between 1870 and 1953. The large number of Italians are visible in many parts of Southeast Brazil. Their descendants are nowadays predominant in many areas. For example, Northeast São Paulo is 45% Italian.[96]
The arrival of immigrants from several parts of Europe, the Middle-East and Asia produced an ethnically diverse population. The city of Bastos, in São Paulo, is 11.4% Japanese. The city of São Paulo is home to the largest Japanese population outside Japan itself.[97]
According to the 2022 census, people reported as "Pardo" (brown) make up 59.6% of the population, Whites 26.7% and Blacks 13.0%.[83]
The ethnic composition of the population starts in the 16th century. The Portuguese settlers brought few women, which led to relationships with the Indian women. Later, interracial relationships occurred between Portuguese males and African females. The coast, in the past the place where millions of African slaves arrived (mostly from modern-day Angola, Ghana, Nigeria and Benin) to work in sugarcane plantations, is where nowadays there is a predominance of Mulattoes, those of African and European ancestry. In the interior, there is a predominance of Indian and European mixture.[98]
According to the 2022 census, in the North Pardo (brown) make up 67.2% of the population, Whites 20.7%, Blacks 8.8%, Indigenous 3.1% and Yellow (Asian descent) 0.2% .[83]Northern Brazil, largely covered by the Amazon rainforest, is the Brazilian region with the largest Amerindian influences, both in culture and ethnicity. Inhabited by diverse indigenous tribes, this part of Brazil was reached by Portuguese and Spanish colonists in the 17th century, but it started to be populated by non-Indians only in the late 19th and early 20th centuries. The exploitation of rubber used in the growing industries of automobiles, has emerged a huge migration to the region.
Many people from the poor Northeast Brazil, mostly Ceará, moved to the Amazon area. The contact between the Indians and the northeastern rubbers created the base of the ethnic composition of the region, with its mixed-race majority.
Central-West
Races in the Central-West Region (2022 census)[82]
According to the 2022 census, in the Central-West Pardo (brown) make up 52.4% of the population, Whites 37%, Blacks 9.1%, Indigenous 1.2% and Yellow (East-Asian descent) 0.4%.[99] The Central-West region of Brazil was inhabited by diverse Indians when the Portuguese arrived in the early 18th century. The Portuguese came to explore the precious stones that were found there. Contact between the Portuguese and the Indians created a mixed-race population. Until the mid-20th century, Central-West Brazil had a very small population. The situation changed with the construction of Brasília, the new capital of Brazil, in 1960. Many workers were attracted to the region, mostly from northeastern Brazil.
A new wave of settlers started arriving from the 1970s. With the mechanization of agriculture in the South of Brazil, many rural workers of German and Italian origin migrated to Central-West Brazil. In some areas, they are already the majority of the population.
Portuguese is the only official language of Brazil.[100] It is spoken by nearly the entire population and is virtually the only language used in schools, newspapers, radio, TV and for all business and administrative purposes. Moreover, Brazil is the only Portuguese-speaking nation in the Americas, making the language an important part of Brazilian national identity.
Many Amerindian languages are spoken daily in indigenous communities, primarily in Northern Brazil. Although many of these communities have significant contact with Portuguese,[101] there are incentives stimulating preservation and the teaching of native languages. According to SIL International, 133 Native American languages are currently endangered. Some of the largest indigenous language groups include Arawak, Carib, Macro-Gê and Tupi.[102] In 2006, the municipality of São Gabriel da Cachoeira in the region of Cabeça do Cachorro (Northwestern region of the State of Amazonas), has adopted some indigenous languages as some of its other official languages along with Portuguese.
According to the IBGE census 2010[103] 64.6% are Roman Catholics; 24% are Protestants and other Christians, 8% are agnostics, atheists or have no religion, 2% are followers of Spiritism, and 1% are members of other religions. Some of these religions are Jehovah's Witnesses (1,100,000), Latter-day Saints (200,000), Buddhism (215,000), Judaism (86,000), and Islam (27,000).[104] In 2020, it was estimated that 48% were Roman Catholic; 33% Protestant; 14% irreligious; 2% Spiritist; 2% other Christian; 1% Afro-Brazilian religious; and 0.5% other.[105] In another 2020 study by the Association of Religion Data Archives, Christians made up 90.77% of the population; among Christians, 70.57% were Roman Catholic; 15.12% Protestant; 12.23% Independents, 0.12% Orthodox, and 0.09% unaffiliated Christian.[106] Kardecist spiritism was the second-largest religion practiced in Brazil as ARDA's 2020 study, with 4.83% of the population. Of its 3.03% irreligious population, 2.59% were agnostic and 0.44% atheist.[106]
Followers of Protestantism are rising in number. Until 1970, the majority of Brazilian Protestants were adherents of "traditional churches", mostly Lutherans, Presbyterians and Baptists. There are 120,000 Episcopalians in 9 dioceses (Anglican Episcopal Church of Brazil). Since then, numbers of Pentecostal and Neopentecostal adherents have increased significantly.
Islam in Brazil was first practiced by African slaves.[108] The Muslim population in Brazil is made up mostly of Arab immigrants.[109]
The largest population of Buddhists in Latin America lives in Brazil, due greatly to Brazil's large Japanese population.
↑MONTENEGRO J DE CARVALHO, FRANCISCO (2011). MODELO DE REGRESSÃO DINÂMICA PARA PROJEÇÕES DE PREÇO DA ENERGIA NO BRASIL (Thesis). Faculdades Catolicas. doi:10.17771/pucrio.acad.18806.
↑Francis-Tan, Andrew (July 2016). "Light and shadows: An analysis of racial differences between siblings in Brazil". Social Science Research. 58: 254–265. doi:10.1016/j.ssresearch.2016.02.003. PMID27194664.
↑Hout, Michael; Goldstein, Joshua R. (1994). "How 4.5 Million Irish Immigrants Became 40 Million Irish Americans: Demographic and Subjective Aspects of the Ethnic Composition of White Americans". American Sociological Review. 59 (1): 64–82. doi:10.2307/2096133. JSTOR2096133.
↑Pupp Spinassé, Karen (2008). "Os imigrantes alemães e seus descendentes no Brasil: a língua como fator identitário e inclusivo" [German immigrants and their descendants in Brazil: language as an identity and inclusive factor]. Conexão Letras (in Portuguese). 3 (3): 125–140. hdl:10183/20697.
↑Altenhofen, Cléo Vilson: Hunsrückisch in Rio Grande do Sul, Franz Steiner Verlag, Stuttgart 1996
↑South-Central Paraná, Pacific Island Travel, archived from the original on 3 September 2008, retrieved 8 April 2008, taken from Cleary, David; Jenkins, Dilwyn; Marshall, Oliver; Hine, Jim (22 March 1998), Brazil: the Rough Guide, Rough Guides, ISBN1-85828-223-3
↑David I. Kertzer and Dominique Arel (2002). Census and Identity: The Politics of Race, Ethnicity, and Language in National Censuses. Cambridge University Press. pp.63–64. ISBN978-0-521-00427-5.
1234Rodrigues de Moura, Ronald; Coelho, Antonio Victor Campos; de Queiroz Balbino, Valdir; Crovella, Sergio; Brandão, Lucas André Cavalcanti (10 September 2015). "Meta-analysis of Brazilian genetic admixture and comparison with other Latin America countries". American Journal of Human Biology. 27 (5): 674–80. doi:10.1002/ajhb.22714. hdl:11368/2837176. PMID25820814. S2CID25051722.
↑De Assis Poiares, L; De Sá Osorio, P; Spanhol, F. A.; Coltre, S. C.; Rodenbusch, R; Gusmão, L; Largura, A; Sandrini, F; Da Silva, C. M. (February 2010). "Allele frequencies of 15 STRs in a representative sample of the Brazilian population". Forensic Sci Int Genet. 4 (2): e61–3. doi:10.1016/j.fsigen.2009.05.006. PMID20129458.
↑de Assis Poiares, Lilian; de Sá Osorio, Paulo; Spanhol, Fábio Alexandre; Coltre, Sidnei César; Rodenbusch, Rodrigo; Gusmão, Leonor; Largura, Alvaro; Sandrini, Fabiano; da Silva, Cláudia Maria Dornelles (February 2010). "Allele frequencies of 15 STRs in a representative sample of the Brazilian population". Forensic Science International: Genetics. 4 (2): e61–e63. doi:10.1016/j.fsigen.2009.05.006. PMID20129458.
↑"Regiões do Brasil". Colégio Ined. 5 January 2008. Archived from the original on 5 January 2008. Retrieved 30 August 2017.{{cite web}}: CS1 maint: bot: original URL status unknown (link)
This page is based on this Wikipedia article Text is available under the CC BY-SA 4.0 license; additional terms may apply. Images, videos and audio are available under their respective licenses.