Economy of Brazil

Last updated

Economy of Brazil
Itaim Bibi Business District.jpg
Currency Brazilian real (BRL, R$)
1 January – 31 December
Trade organizations
WTO, BRICS, MERCOSUR, G20 and others
Country group
Statistics
PopulationIncrease2.svg 203 million (2023) [3]
GDP
  • Increase2.svg $2.126 trillion (nominal; 2023 est.) [4]
  • Increase2.svg $4.101 trillion (PPP; 2023 est.) [4]
GDP rank
GDP growth
  • Increase2.svg 3.0% (2022) [5]
  • Increase2.svg 3.1% (2023) [5]
  • Increase2.svg 2.2% (2024f) [5]
GDP per capita
  • Increase2.svg $10,673 (nominal; 2023 est.) [4]
  • Increase2.svg $20,685 (PPP; 2023 est.) [4]
GDP per capita rank
GDP by sector
Decrease Positive.svg 4.68% (2023) [7]
Population below poverty line
  • Decrease Positive.svg 4.1% (2022) [8]
  • Decrease Positive.svg 19% on less than $6.85/day (2020) [9]
Increase Negative.svg 52.9 high (2021) [10]
  • Increase2.svg 0.754 high (2022) [11]
(87th)
Decrease2.svg 36 (2023) [12] (104th)
Labor force
  • Increase2.svg 107,900,000 (2022) [13]
  • Increase2.svg 56.7% employment rate (2020) [14]
Labor force by occupation
Unemployment
  • Decrease Positive.svg 7.7% (November 2023) [16]
Average gross salary
R$ 3,012 (US$558.81) monthly [17] (October 2023)
Main industries
External
ExportsIncrease2.svg $339.7 billion (2023) [18]
Export goods
Aircraft, steel, machinery, transport equipment, automobiles, vehicle parts, soybeans, iron ore, pulp (cellulose), maize, beef, chicken meat, soybean meal, sugar, coffee, tobacco, cotton, orange juice, footwear, gold, ethanol, semi-finished iron
Main export partners
ImportsDecrease2.svg $240.8 billion (2023) [18]
Import goods
Machinery, electrical and transport equipment, chemical products, oil, automotive parts, electronics
Main import partners
FDI stock
Increase2.svg $91.5 billion (2022) [20]
Decrease Positive.svg −$5,890.7 billion (2021) [21]
Increase Negative.svg $576.4 billion (2022) [22]
Public finances
Increase Negative.svg 73.4% of GDP (September 2023) [23]
0.4% (of GDP) (2021) [24]
Revenues$382.6 billion (2022) [25]
Expenses$319.4 billion (2022) [25]
Increase2.svg $355 billion (2023) [29]
Main data source: CIA World Fact Book
All values, unless otherwise stated, are in US dollars.

The economy of Brazil is historically the largest in Latin America and the Southern Hemisphere in nominal terms. [30] The Brazilian economy is the second largest in the Americas. It is an upper-middle income developing mixed economy. [31] In 2023, according to International Monetary Fund (IMF), Brazil has the 9th largest gross domestic product (GDP) in the world and has the 8th largest purchasing power parity in the world. [32] [33] [34]

Contents

In 2023, according to International Monetary Fund (IMF), Brazilian nominal GDP was US$2.126 trillion, the country has a long history of being among the largest economies in the world and the GDP per capita was US$10,412 per inhabitant. [35] [36]

The country is rich in natural resources. From 2000 to 2012, Brazil was one of the fastest-growing major economies in the world, with an average annual GDP growth rate of over 5%. Its GDP surpassed that of the United Kingdom in 2012, temporarily making Brazil the world's sixth-largest economy. However, Brazil's economic growth decelerated in 2013 [37] and the country entered a recession in 2014. The economy started to recover in 2017, with a 1% growth in the first quarter, followed by a 0.3% growth in second quarter compared to the same period of the previous year. It officially exited the recession.

According to the World Economic Forum, Brazil was the top country in upward evolution of competitiveness in 2009, gaining eight positions among other countries, overcoming Russia for the first time, and partially closing the competitiveness gap with India and China among the BRICS economies. Important steps taken since the 1990s toward fiscal sustainability, as well as measures taken to liberalize and open the economy, have significantly boosted the country's competitiveness fundamentals, providing a better environment for private-sector development. [38]

In 2023, Brazil was the 9th largest country in the world by number of billionaires. [39] Brazil is a member of diverse economic organizations, such as Mercosur, Prosur, G8+5, G20, WTO, Paris Club, Cairns Group, and is advanced to be a permanent member of the OECD. [40]

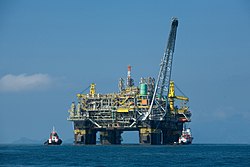
From a colony focused on primary sector goods (sugar, gold and cotton), Brazil managed to create a diversified industrial base during the 20th century. The steel industry is a prime example of that, with Brazil being the 9th largest steel producer in 2018, and the 5th largest steel net exporter in 2018. [41] Gerdau is the largest producer of long steel in the Americas, and Vale is the largest producer of iron ore in the world. [42] Petrobras, the Brazilian oil and gas company, is the most valuable company in Latin America. [43]

History

When the Portuguese explorers arrived in the 16th century, the native tribes of current-day Brazil totaled about 2.5 million people and had lived virtually unchanged since the Stone Age. From Portugal's colonization of Brazil (1500–1822) until the late 1930s, the Brazilian economy relied on the production of primary products for exports.

In the Portuguese Empire, Brazil was a colony subjected to an imperial mercantile policy, which had three main large-scale economic production cycles – sugar, gold and from the early 19th century on, coffee. The economy of Brazil was heavily dependent on African slave labor until the late 19th century (about 3 million imported African slaves in total). In that period Brazil was also the colony with the largest number of European settlers, most of them Portuguese (including Azoreans and Madeirans) but also some Dutch (see Dutch Brazil), Spaniards, English, French, Germans, Flemish, Danish, Scottish and Sephardic Jews.

Subsequently, Brazil experienced a period of strong economic and demographic growth accompanied by mass immigration from Europe, mainly from Portugal (including the Azores and Madeira), Italy, Spain, Germany, Poland, Ukraine, Switzerland, Austria and Russia. Smaller numbers of immigrants also came from the Netherlands, France, Finland, Iceland and the Scandinavian countries, Lithuania, Belgium, Bulgaria, Hungary, Greece, Latvia, England, Ireland, Scotland, Croatia, Czech Republic, Malta, North Macedonia and Luxembourg, the Middle East (mainly from Lebanon, Syria and Armenia), Japan, the United States and South Africa, until the 1930s.In fact, international mass immigration to Brazil during the 19th century had positive effects on the country's human capital development. Immigrants usually exhibited better formal and informal training than native Brazilians and tended to have more entrepreneurial spirit. Their arrival was beneficial for the region, not only because of the skills and knowledge they brought to the country themselves, but also because of spillover effects of their human capital to the native Brazilian population. Human capital spillover effects were strongest in regions with the highest numbers of immigrants, and the positive effects are still observable today, in some regions. [44]

In 2007, with a population of over 190 million and abundant natural resources, Brazil is one of the ten largest markets in the world, producing tens of millions of tons of steel, 26 million tons of cement, 3.5 million television sets, and 3 million refrigerators. In addition, about 70  million cubic meters of petroleum were being processed annually into fuels, lubricants, propane gas, and a wide range of hundreds of petrochemicals. [45] [46]

Brazil has at least 161,500 kilometers of paved roads, more than 150 gigawatts of installed electric power capacity [47] and its real per capita GDP surpassed US$9,800 in 2017. [32] [48] Its industrial sector accounts for three-fifths of the South American economy's industrial production. [49] The country's scientific and technological development is argued to be attractive to foreign direct investment, in 2019, Brazil occupied the 4th largest destination for foreign investments, behind only the United States, China and Singapore. [50]

The agricultural sector, locally called the agronegócio (agro-business), has also been dynamic: for two decades this sector has kept Brazil among the most highly productive countries in areas related to the rural sector. [49] The agricultural sector and the mining sector also supported trade surpluses which allowed for massive currency gains (rebound) and external debt paydown. Due to a downturn in Western economies, Brazil found itself in 2010 trying to halt the appreciation of the real. [51]

Data from the Asian Development Bank and the Tax Justice Network show the untaxed "shadow" economy of Brazil is 39% of GDP. [52]

One of the most important corruption cases in Brazil concerns the company Odebrecht. Since the 1980s, Odebrecht has spent several billion dollars in the form of bribes to bribe parliamentarians to vote in favour of the group. At the municipal level, Odebrecht's corruption was aimed at "stimulating privatisations", particularly in water and sewer management. [53]

Data

Brazilian bonds had an Inverted yield curve in August 2014 when the 1 year bond got above the 10 year bond
.mw-parser-output .legend{page-break-inside:avoid;break-inside:avoid-column}.mw-parser-output .legend-color{display:inline-block;min-width:1.25em;height:1.25em;line-height:1.25;margin:1px 0;text-align:center;border:1px solid black;background-color:transparent;color:black}.mw-parser-output .legend-text{}
10 year bond
5 year bond
1 year bond Brazilian bonds.webp
Brazilian bonds had an Inverted yield curve in August 2014 when the 1 year bond got above the 10 year bond
  10 year bond
  5 year bond
  1 year bond
Brazil Inflation 1981-1995 Brazil Inflation 1981-1995.webp
Brazil Inflation 1981-1995
Brazil inflation 1996-2022 Brazil inflation 1996-2022.webp
Brazil inflation 1996-2022
Bovespa, the Stock Exchange in Sao Paulo. Sao Paulo Stock Exchange.jpg
Bovespa, the Stock Exchange in São Paulo.
Airplane produced in Brazil by Embraer. Embraer E195-E2 (ERJ 190-400 STD) PS-AEF.jpg
Airplane produced in Brazil by Embraer.
Waterfalls in Foz do Iguacu. Foz do Iguacu Parana.jpg
Waterfalls in Foz do Iguaçu.
Shopping Mall in Curitiba. Shopping Estacao 1 Curitiba Brasil.jpg
Shopping Mall in Curitiba.
Tourism in Gramado. Lago Negro - Gramado - Brasil (2541060459).jpg
Tourism in Gramado.

The following table shows the main economic indicators in 1980–2023 (with IMF estimates for 2024–2028). Inflation below 5% is in green. [54]

YearGDP

(in bn. US$PPP)

GDP per capita

(in US$ PPP)

GDP

(in bn. US$nominal)

GDP per capita

(in US$ nominal)

GDP growth

(real)

Inflation rate

(in Percent)

Unemployment

(in Percent)

Government debt

(in % of GDP)

1980570.54,811.9145.81,203.6Increase2.svg9.2%Increase Negative.svg90.2%n/an/a
1981Increase2.svg597.0Increase2.svg4,925.3Increase2.svg167.6Increase2.svg1,353.0Decrease2.svg−4.4%Increase Negative.svg101.7%n/an/a
1982Increase2.svg637.7Increase2.svg5,147.3Increase2.svg179.2Increase2.svg1,415.3Increase2.svg0.6%Increase Negative.svg100.6%n/an/a
1983Increase2.svg640.1Decrease2.svg5,057.3Decrease2.svg143.7Decrease2.svg1,110.7Decrease2.svg−3.4%Increase Negative.svg135.0%n/an/a
1984Increase2.svg698.4Increase2.svg5,402.7Decrease2.svg143.0Decrease2.svg1,082.2Increase2.svg5.3%Increase Negative.svg192.1%n/an/a
1985Increase2.svg777.4Increase2.svg5,890.6Increase2.svg226.9Increase2.svg1,682.8Increase2.svg7.9%Increase Negative.svg226.0%n/an/a
1986Increase2.svg852.9Increase2.svg6,334.2Increase2.svg263.3Increase2.svg1,913.3Increase2.svg7.5%Increase Negative.svg147.1%n/an/a
1987Increase2.svg905.5Increase2.svg6,596.4Increase2.svg286.5Increase2.svg2,042.9Increase2.svg3.6%Increase Negative.svg228.3%n/an/a
1988Increase2.svg939.9Increase2.svg6,722.2Increase2.svg320.1Increase2.svg2,240.5Increase2.svg0.3%Increase Negative.svg629.1%n/an/a
1989Increase2.svg1,008.0Increase2.svg7,083.3Increase2.svg439.4Increase2.svg3,022.0Increase2.svg3.2%Increase Negative.svg1430.7%n/an/a
1990Decrease2.svg1,002.1Decrease2.svg6,836.1Increase2.svg455.3Increase2.svg3,108.8Decrease2.svg−4.2%Increase Negative.svg2947.7%n/an/a
1991Increase2.svg1,046.7Increase2.svg7,020.5Decrease2.svg399.2Decrease2.svg2,717.5Increase2.svg1.0%Increase Negative.svg432.8%10.1%n/a
1992Increase2.svg1,065.6Increase2.svg7,031.3Decrease2.svg382.5Decrease2.svg2,561.1Decrease2.svg−0.5%Increase Negative.svg952.0%Increase Negative.svg11.6%n/a
1993Increase2.svg1,141.7Increase2.svg7,414.4Increase2.svg429.2Increase2.svg2,828.5Increase2.svg4.7%Increase Negative.svg1927.4%Decrease Positive.svg11.0%n/a
1994Increase2.svg1,228.3Increase2.svg7,852.0Increase2.svg546.8Increase2.svg3,547.0Increase2.svg5.3%Increase Negative.svg2075.8%Decrease Positive.svg10.5%n/a
1995Increase2.svg1,309.4Increase2.svg8,364.1Increase2.svg770.9Increase2.svg4,923.9Increase2.svg4.4%Increase Negative.svg66.0%Decrease Positive.svg9.9%n/a
1996Increase2.svg1,362.9Increase2.svg8,457.1Increase2.svg851.1Increase2.svg5,281.7Increase2.svg2.2%Increase Negative.svg15.8%Increase Negative.svg11.2%n/a
1997Increase2.svg1,433.4Increase2.svg8,757.6Increase2.svg883.9Increase2.svg5,400.0Increase2.svg3.4%Increase Negative.svg6.9%Increase Negative.svg11.6%n/a
1998Increase2.svg1,454.5Decrease2.svg8,749.7Decrease2.svg864.3Decrease2.svg5,199.5Increase2.svg0.3%Increase2.svg3.2%Increase Negative.svg14.7%n/a
1999Increase2.svg1,481.9Increase2.svg8,816.5Decrease2.svg599.6Decrease2.svg3,567.6Increase2.svg0.5%Increase2.svg4.9%Steady2.svg14.7%n/a
2000Increase2.svg1,581.9Increase2.svg9,328.0Increase2.svg655.5Increase2.svg3,864.9Increase2.svg4.4%Increase Negative.svg7.0%Decrease Positive.svg13.9%65.6%
2001Increase2.svg1,640.1Increase2.svg9,536.6Decrease2.svg560.0Decrease2.svg3,256.2Increase2.svg1.4%Increase Negative.svg6.8%Decrease Positive.svg12.5%Increase Negative.svg70.1%
2002Increase2.svg1,716.5Increase2.svg9,852.9Decrease2.svg509.8Decrease2.svg2,926.3Increase2.svg3.1%Increase Negative.svg8.5%Increase Negative.svg13.0%Increase Negative.svg78.8%
2003Increase2.svg1,770.3Increase2.svg10,037.8Increase2.svg558.2Increase2.svg3,165.2Increase2.svg1.1%Increase Negative.svg14.7%Increase Negative.svg13.7%Decrease Positive.svg73.8%
2004Increase2.svg1,922.6Increase2.svg10,772.3Increase2.svg669.3Increase2.svg3,750.1Increase2.svg5.8%Increase Negative.svg6.6%Decrease Positive.svg12.9%Decrease Positive.svg70.1%
2005Increase2.svg2,046.3Increase2.svg11,334.1Increase2.svg891.6Increase2.svg4,938.5Increase2.svg3.2%Increase Negative.svg6.9%Decrease Positive.svg11.4%Decrease Positive.svg68.6%
2006Increase2.svg2,193.1Increase2.svg12,012.3Increase2.svg1,107.6Increase2.svg6,067.0Increase2.svg4.0%Increase2.svg4.2%Increase Negative.svg11.5%Decrease Positive.svg65.8%
2007Increase2.svg2,389.0Increase2.svg12,949.0Increase2.svg1,397.1Increase2.svg7,572.6Increase2.svg6.1%Increase2.svg3.6%Decrease Positive.svg10.9%Decrease Positive.svg64.1%
2008Increase2.svg2,558.9Increase2.svg13,726.5Increase2.svg1,695.9Increase2.svg9,096.9Increase2.svg5.1%Increase Negative.svg5.7%Decrease Positive.svg9.4%Decrease Positive.svg62.3%
2009Increase2.svg2,572.1Decrease2.svg13,638.5Decrease2.svg1,669.2Decrease2.svg8,851.1Decrease2.svg−0.1%Increase2.svg4.9%Increase Negative.svg9.7%Increase Negative.svg65.5%
2010Increase2.svg2,798.9Increase2.svg14,672.8Increase2.svg2,208.7Increase2.svg11,578.7Increase2.svg7.5%Increase2.svg5.0%Decrease Positive.svg8.5%Decrease Positive.svg63.0%
2011Increase2.svg2,970.6Increase2.svg15,491.0Increase2.svg2,614.0Increase2.svg13,631.4Increase2.svg4.0%Increase Negative.svg6.6%Decrease Positive.svg7.8%Decrease Positive.svg61.2%
2012Increase2.svg2,998.5Increase2.svg15,555.6Decrease2.svg2,464.1Decrease2.svg12,782.8Increase2.svg1.9%Increase Negative.svg5.4%Decrease Positive.svg7.4%Increase Negative.svg62.2%
2013Increase2.svg3,133.9Increase2.svg16,168.6Increase2.svg2,471.7Decrease2.svg12,752.3Increase2.svg3.0%Increase Negative.svg6.2%Decrease Positive.svg7.2%Decrease Positive.svg60.2%
2014Increase2.svg3,187.2Increase2.svg16,352.3Decrease2.svg2,456.1Decrease2.svg12,601.3Increase2.svg0.5%Increase Negative.svg6.3%Decrease Positive.svg6.9%Increase Negative.svg62.3%
2015Decrease2.svg3,014.8Decrease2.svg15,379.9Decrease2.svg1,800.0Decrease2.svg9,183.0Decrease2.svg−3.5%Increase Negative.svg9.0%Increase Negative.svg8.6%Increase Negative.svg72.6%
2016Decrease2.svg2,939.1Decrease2.svg14,915.4Decrease2.svg1,796.6Decrease2.svg9,117.6Decrease2.svg−3.3%Increase Negative.svg8.7%Increase Negative.svg11.7%Increase Negative.svg78.3%
2017Increase2.svg3,018.7Increase2.svg15,242.7Increase2.svg2,063.5Increase2.svg10,419.6Increase2.svg1.3%Increase2.svg3.4%Increase Negative.svg12.9%Increase Negative.svg83.6%
2018Increase2.svg3,146.4Increase2.svg15,805.9Decrease2.svg1,916.9Decrease2.svg9,629.6Increase2.svg1.8%Increase2.svg3.7%Decrease Positive.svg12.4%Increase Negative.svg85.6%
2019Increase2.svg3,241.9Increase2.svg16,206.0Decrease2.svg1,873.3Decrease2.svg9,364.2Increase2.svg1.2%Increase2.svg3.7%Decrease Positive.svg12.0%Increase Negative.svg87.1%
2020Decrease2.svg3,176.6Decrease2.svg15,805.9Decrease2.svg1,476.1Decrease2.svg7,344.5Decrease2.svg−3.3%Increase2.svg3.2%Increase Negative.svg13.8%Increase Negative.svg96.0%
2021Increase2.svg3,484.9Increase2.svg17,250.3Increase2.svg1,649.6Increase2.svg8,165.6Increase2.svg5.0%Increase Negative.svg8.3%Decrease Positive.svg13.2%Decrease Positive.svg90.1%
2022Increase2.svg3,837.2Increase2.svg18,896.7Increase2.svg1,920.0Increase2.svg9,455.3Increase2.svg2.9%Increase Negative.svg9.4%Decrease Positive.svg9.3%Decrease Positive.svg85.3%
2023Increase2.svg4,101.0Increase2.svg20,078.9Increase2.svg2,126.8Increase2.svg10,413.0Increase2.svg3.1%Increase2.svg3.7%Decrease Positive.svg8.3%Increase Negative.svg88.0%
2024Increase2.svg4,257.2Increase2.svg20,728.5Increase2.svg2,265.1Increase2.svg11,029.2Increase2.svg1.5%Increase2.svg3.4%Decrease Positive.svg8.2%Increase Negative.svg90.3%
2025Increase2.svg4,425.2Increase2.svg21,435.1Increase2.svg2,362.1Increase2.svg11,441.8Increase2.svg1.9%Increase2.svg3.3%Increase2.svg8.1%Increase Negative.svg92.4%
2026Increase2.svg4,595.8Increase2.svg22,145.3Increase2.svg2,476.6Increase2.svg11,933.8Increase2.svg1.9%Increase2.svg3.0%Steady2.svg8.1%Increase Negative.svg93.9%
2027Increase2.svg4,774.2Increase2.svg22,884.8Increase2.svg2,632.2Increase2.svg12,617.4Increase2.svg2.0%Increase2.svg3.0%Increase2.svg8.0%Increase Negative.svg95.0%
2028Increase2.svg4,960.6Increase2.svg23,654.6Increase2.svg2,774.5Increase2.svg13,230.1Increase2.svg2.0%Increase2.svg3.0%Increase2.svg7.9%Increase Negative.svg96.0%

Components

The service sector is the largest component of the gross domestic product (GDP) at 67.0 percent, followed by the industrial sector at 27.5 percent. Agriculture represents 5.5 percent of GDP (2011). [55] The Brazilian labor force is estimated at 100.77 million of which 10 percent is occupied in agriculture, 19 percent in the industry sector and 71 percent in the service sector.

Agricultural Sector

Agriculture production
Arroz 097.jpg
Combine harvester on a plantation
Main productscoffee, soybeans, wheat, rice, corn, sugarcane, cocoa, citrus; beef
Labor force15.7% of total labor force
GDP of sector5.9% of total GDP
Economic activity in Brazil (1977). Brasil economia.jpg
Economic activity in Brazil (1977).

Brazil is the world's largest producer of sugarcane, soy, coffee, orange, guaraná, açaí and Brazil nut; is one of the top 5 producers of maize, papaya, tobacco, pineapple, banana, cotton, beans, coconut, watermelon and lemon; is one of the top 10 world producers of cocoa, cashew, avocado, tangerine, persimmon, mango, guava, rice, sorghum and tomato; and is one of the top 15 world producers of grape, apple, melon, peanut, fig, peach, onion, palm oil and natural rubber. [56]

In the production of animal proteins, Brazil is today one of the largest countries in the world. In 2019, the country was the world's largest exporter of chicken meat. [57] [58] It was also the second largest producer of beef, [59] the world's third largest producer of milk, [60] the world's fourth largest producer of pork [61] and the seventh largest producer of eggs in the world. [62]

Agribusiness contributes to Brazil's trade balance, in spite of trade barriers and subsidizing policies adopted by the developed countries. [63]

In the space of fifty five years (1950 to 2005), the population of Brazil grew from 51 million to approximately 187 million inhabitants, [64] an increase of over 2 percent per year. Brazil created and expanded a complex agribusiness sector. [63] However, some of this is at the expense of the environment, including the Amazon.

The importance given to the rural producer takes place in the shape of the agricultural and cattle-raising plan and through another specific subsidy program geared towards family agriculture Programa de Fortalecimento da Agricultura Familiar (Pronaf), which guarantees financing for equipment and cultivation and encourages the use of new technology. With regards to family agriculture, over 800 thousand rural inhabitants are assisted by credit, research and extension programs. A special line of credit is available for women and young farmers. [63]

Brazil is the world's largest exporter of chicken meat. Farm in Southern Brazil. Pecuaria PR Avicultura em Santa Helena.jpg
Brazil is the world's largest exporter of chicken meat. Farm in Southern Brazil.

With The Land Reform Program, on the other hand, the country's objective is to provide suitable living and working conditions for families who live in areas allotted by the State, an initiative capable of generating jobs. Through partnerships, public policies and international partnerships, the government is working towards guaranteeing infrastructure for the settlements, following the examples of schools and health outlets. The idea is that access to land represents just the first step towards the implementation of a quality land reform program. [63]

Over 600,000 km2 of land are divided into approximately five thousand areas of rural property; an agricultural area currently with three borders: the Central-western region (savannah), the northern region (area of transition) and parts of the northeastern region (semi-arid). At the forefront of grain crops, which produce over 110 million tonnes/year, is the soybean, yielding 50 million tonnes. [63]

In the cattle-raising sector, the "green ox," which is raised in pastures, on a diet of hay and mineral salts, conquered markets in Asia, Europe and the Americas, particularly after the "mad cow disease" scare period. Brazil has the largest cattle herd in the world, with 198 million heads, [65] responsible for exports of more than US$1 billion/year. [63]

A pioneer and leader in the manufacture of short-fiber timber cellulose, Brazil has also achieved positive results within the packaging sector, in which it is the fifth largest world producer. In the foreign markets, it answers for 25 percent of global exports of raw cane and refined sugar; it is the world leader in soybean exports and is responsible for 80 percent of the planet's orange juice, and since 2003, has had the highest sales figures for beef and chicken. [63]

Mining

Gold production in the area of Pantanal. MINA DE OURO - REJEITO DE MINERACAO.jpg
Gold production in the area of Pantanal.

In the mining sector, Brazil stands out in the extraction of iron ore (where it is the second world exporter), copper, gold, bauxite (one of the 5 largest producers in the world), manganese (one of the 5 largest producers in the world), tin (one of the largest producers in the world), niobium (concentrates 98% of reserves known to the world) and nickel. In terms of gemstones, Brazil is the world's largest producer of amethyst, topaz, agate and one of the main producers of tourmaline, emerald, aquamarine, garnet and opal. [66] [67] [68] [69] [70] [71]

In 2019, Brazil's figures were as follows: it was the world's largest producer of niobium (88.9 thousand tons); [72] the 2nd largest world producer of tantalum (430 tons); [73] the 2nd largest world producer of iron ore (405 million tons); [74] the 4th largest world producer of manganese (1.74 million tons); [75] the 4th largest world producer of bauxite (34 million tons); [76] the 4th largest world producer of vanadium (5.94 thousand tons); [77] the 5th largest world producer of lithium (2.4 thousand tons); [78] the 6th largest world producer of tin (14 thousand tons); [79] the 8th largest world producer of nickel (60.6 thousand tons); [80] the 8th largest world producer of phosphate (4.7 million tons); [81] the 12th largest world producer of gold (90 tons); [82] the 14th largest world producer of copper (360 thousand tons); [83] [84] the 14th largest world producer of titanium (25 thousand tons); [85] the 13th largest world producer of gypsum (3 million tons); [86] the 3rd largest world producer of graphite (96 thousand tons); [87] the 21st largest world producer of sulfur (500 thousand tons); [88] the 9th largest world producer of salt (7.4 million tons); [89] besides having had a chromium production of 200 thousand tons. [84]

Industry

Industrial production
Untitled (Vibro Air) Embraer EMB-135BJ Legacy D-AVIB (5024079232).jpg
Embraer Legacy 600 jet manufactured by Embraer
Main industriestextiles, shoes, chemicals, cement, lumber, iron ore, tin, steel, aircraft, motor vehicles and parts, other machinery and equipment
Industrial growth rate1.1% (2018) [90]
Labor force13.3% of total labor force
GDP of sector22.2% of total GDP

Brazil has the second-largest manufacturing sector in the Americas. Accounting for 28.5 percent of GDP, Brazil's industries range from automobiles, steel and petrochemicals to computers, aircraft, and consumer durables. With increased economic stability provided by the Plano Real, Brazilian and multinational businesses have invested heavily in new equipment and technology, a large proportion of which has been purchased from U.S. firms.

The World Bank lists the main producing countries each year, based on the total production value. According to the 2019 list, Brazil has the 13th most valuable industry in the world (US$173.6 billion). In the Americas, it is second only to the United States (2nd place) and Mexico (12th place). [91] In the food industry, in 2019, Brazil was the second largest exporter of processed foods in the world. [92] [93] [94] In 2016, the country was the 2nd largest producer of pulp in the world and the 8th producer of paper. [95] [96] [97] In the footwear industry, in 2019, Brazil ranked 4th among world producers. [98] [99] [100] [101] In 2019, the country was the 8th producer of vehicles and the 9th producer of steel in the world. [102] [103] [104] In 2018, the chemical industry of Brazil was the 8th in the world. [105] [106] [107] In textile industry, Brazil, although it was among the 5 largest world producers in 2013, is very little integrated in world trade. [108] In the aviation sector, Brazil has Embraer, the third largest aircraft manufacturer in the world, behind Boeing and Airbus.

Brazil has a diverse and sophisticated services industry as well. During the early 1990s, the banking sector accounted for as much as 16 percent of the GDP. Although undergoing a major overhaul, Brazil's financial services industry provides local businesses with a wide range of products and is attracting numerous new entrants, including U.S. financial firms. On 8 May 2008, the São Paulo Stock Exchange (Bovespa) and the São Paulo-based Brazilian Mercantile and Futures Exchange (BM&F) merged, creating BM&F Bovespa, one of the largest stock exchanges in the world. Also, the previously monopolistic reinsurance sector is being opened up to third-party companies. [109]

As of 31 December 2007, there were an estimated 21,304,000 broadband lines in Brazil. Over 75 percent of the broadband lines were via DSL and 10 percent via cable modems.

Proven mineral resources are extensive. Large iron and manganese reserves are important sources of industrial raw materials and export earnings. Deposits of nickel, tin, chromite, uranium, bauxite, beryllium, copper, lead, tungsten, zinc, gold, and other minerals are exploited. High-quality coking-grade coal required in the steel industry is in short supply.

Creative Industries

The first study into the impact of the Creative Industries on the Brazilian economy was published by FIRJAN. [110] The creative economy in Latin America was termed the "Orange Economy" [111] in a publication released by the Inter-American Development Bank (IDB). This 2013 study valued Brazil's Orange Economy at US$66.87 billion providing 5,280,000 jobs and responsible for US$9.414 million in exports, with the value of creative exports being higher than the US$8.016 million value of coffee exports over the same period.

Beaches in Maceio. Praias-urbanas-maceio.jpg
Beaches in Maceió.

A 2021 study into the Intellectual Property Intensive Sectors in the Brazilian Economy [112] was undertaken as part of the National Strategy on Intellectual Property 2021–2030. [113] The study found that 450 of the 673 economic classes could be classified as IP-intensive sectors that collectively employed 19.3 million people. The share of GDP between 2014 and 2016 across these economic classes amounted to R$2.1 trillion reais or 44.2% of GDP over this time.

Tourism

In the list of world tourist destinations, in 2018, Brazil was the 48th most visited country, with 6.6 million tourists (and revenues of 5.9 billion dollars). Tourism in South America as a whole is still underdeveloped: in Europe, for example, countries obtain annual tourism figures like $73.7 billion (Spain), receiving 82.7 million tourists or 67.3 billion (France), receiving 89.4 million tourists. While Europe received 710 million tourists in 2018, Asia 347 million and North America 142.2 million, South America received only 37 million, Central America 10.8 million and the Caribbean 25.7 million. [114]

Largest companies

Brasilia, the Brazilian capital, has the third largest GDP of the country, after only Sao Paulo and Rio de Janeiro. All state capitals in the States of Brazil, have flights to Brasilia International Airport. Brasilia aeroportojk inauguracaoalasul.jpg
Brasília, the Brazilian capital, has the third largest GDP of the country, after only São Paulo and Rio de Janeiro. All state capitals in the States of Brazil, have flights to Brasília International Airport.
Curitiba has the fifth largest GDP of Brazil and the first in Southern Brazil. The city is second only to Sao Paulo in terms of the number of automotive industries. Jardim Botanico de Curitiba.jpg
Curitiba has the fifth largest GDP of Brazil and the first in Southern Brazil. The city is second only to São Paulo in terms of the number of automotive industries.

In 2017, 20 Brazilian companies were listed in the Forbes Global 2000 list – an annual ranking of the top 2000 public companies in the world by Forbes magazine based on a combination of sales, assets, profit, and market value. [115] The 20 companies listed were:

World RankCompanyIndustryRevenue
(billion $)
Profits
(billion $)
Assets
(billion $)
Market Value
(billion $)
Headquarters
38 Banco Itaú Unibanco Banking61.36.7419.979.2 São Paulo
62 Banco Bradesco Banking70.24.3362.453.5 Osasco, SP
132 Banco do Brasil Banking57.32.3430.629 Brasília
156 Vale Mining27.13.899.145.4 Rio de Janeiro
399 Petrobras Oil & Gas81.1−4.3247.361.3 Rio de Janeiro
610 Eletrobras Utilities17.40.98352.47.2 Rio de Janeiro
791 Itaúsa Conglomerate1.32.418.123 São Paulo
895 JBS Food Processing48.90.10831.68.2 São Paulo
981 Ultrapar Conglomerate22.20.4487.412.5 São Paulo
1103 Cielo Financial services3.51.19.420.9 Barueri, SP
1233 Braskem Chemicals13.8−0.13615.97.9 São Paulo
1325 BRF Food processing9.7−0.10713.89.3 Itajaí, SC
1436 Sabesp Waste Management40.84611.67.4 São Paulo
1503 Oi Telecommunications7.5−225.20.952 Rio de Janeiro
1515 Gerdau Iron & Steel10.8−0.39516.81.4 Porto Alegre, RS
1545 CBD Retail120.13913.95.9 São Paulo
1572 CCR Transportation2.90.4297.511.5 São Paulo
1597 Bovespa Stock Exchange0.6660.4159.712.8 São Paulo
1735 CPFL Energia Electricity5.40.258138.4 Campinas, SP
1895 Kroton Educacional Higher Education1.50.5355.47.1 Belo Horizonte, MG

Energy

Oil platform P-51 of Petrobras. Oil platform P-51 (Brazil).jpg
Oil platform P-51 of Petrobras.
Itaipu Dam in Parana. ItaipuAerea2AAL.jpg
Itaipu Dam in Paraná.
Wind power in Parnaiba. Energia Eolica.jpg
Wind power in Parnaíba.
Angra Nuclear Power Plant in Angra dos Reis, Rio de Janeiro Angra dos Reis - usinas nucleares.jpg
Angra Nuclear Power Plant in Angra dos Reis, Rio de Janeiro
Pirapora Solar Complex, the largest in Brazil and Latin America, with a capacity of 321 MW. Usina solar de Pirapora 2.gif
Pirapora Solar Complex, the largest in Brazil and Latin America, with a capacity of 321 MW.

The Brazilian government has undertaken an ambitious program to reduce dependence on imported petroleum. Imports previously accounted for more than 70% of the country's oil needs but Brazil became self-sufficient in oil in 2006–2007. Brazil was the 10th largest oil producer in the world in 2019, with 2.8 million barrels / day. Production manages to supply the country's demand. [116] In the beginning of 2020, in the production of oil and natural gas, the country exceeded 4 million barrels of oil equivalent per day, for the first time. In January this year, 3.168 million barrels of oil per day and 138.753 million cubic meters of natural gas were extracted. [117]

Brazil is one of the main world producers of hydroelectric power. In 2019, Brazil had 217 hydroelectric plants in operation, with an installed capacity of 98,581 MW, 60.16% of the country's energy generation. [118] In the total generation of electricity, in 2019 Brazil reached 170,000 megawatts of installed capacity, more than 75% from renewable sources (the majority, hydroelectric). [119] [120]

In 2013, the Southeast Region used about 50% of the load of the National Integrated System (SIN), being the main energy consuming region in the country. The region's installed electricity generation capacity totaled almost 42,500 MW, which represented about a third of Brazil's generation capacity. The hydroelectric generation represented 58% of the region's installed capacity, with the remaining 42% corresponding basically to the thermoelectric generation. São Paulo accounted for 40% of this capacity; Minas Gerais by about 25%; Rio de Janeiro by 13.3%; and Espírito Santo accounted for the rest. The South Region owns the Itaipu Dam, which was the largest hydroelectric plant in the world for several years, until the inauguration of Three Gorges Dam in China. It remains the second largest operating hydroelectric in the world. Brazil is the co-owner of the Itaipu Plant with Paraguay: the dam is located on the Paraná River, located on the border between countries. It has an installed generation capacity of 14 GW for 20 generating units of 700 MW each. North Region has large hydroelectric plants, such as Belo Monte Dam and Tucuruí Dam, which produce much of the national energy. Brazil's hydroelectric potential has not yet been fully exploited, so the country still has the capacity to build several renewable energy plants in its territory. [121] [122]

As of July 2022, according to ONS, total installed capacity of wind power was 22 GW, with average capacity factor of 58%. [123] [124] While the world average wind production capacity factors is 24.7%, there are areas in Northern Brazil, specially in Bahia State, where some wind farms record with average capacity factors over 60%; [125] [32] the average capacity factor in the Northeast Region is 45% in the coast and 49% in the interior. [126] In 2019, wind energy represented 9% of the energy generated in the country. [127] In 2019, it was estimated that the country had an estimated wind power generation potential of around 522 GW (this, only onshore), enough energy to meet three times the country's current demand. [128] [129] In 2021 Brazil was the 7th country in the world in terms of installed wind power (21 GW), [130] [131] and the 4th largest producer of wind energy in the world (72 TWh), behind only China, USA and Germany. [132]

Nuclear energy accounts for about 4% of Brazil's electricity. [133] The nuclear power generation monopoly is owned by Eletronuclear (Eletrobrás Eletronuclear S/A), a wholly owned subsidiary of Eletrobrás. Nuclear energy is produced by two reactors at Angra. It is located at the Central Nuclear Almirante Álvaro Alberto (CNAAA) on the Praia de Itaorna in Angra dos Reis, Rio de Janeiro. It consists of two pressurized water reactors, Angra I, with capacity of 657 MW, connected to the power grid in 1982, and Angra II, with capacity of 1,350 MW, connected in 2000. A third reactor, Angra III, with a projected output of 1,350 MW, is planned to be finished. [134]

As of October 2022, according to ONS, total installed capacity of photovoltaic solar was 21 GW, with average capacity factor of 23%. [135] Some of the most irradiated Brazilian States are MG ("Minas Gerais"), BA ("Bahia") and GO (Goiás), which have indeed world irradiation level records. [136] [32] [137] In 2019, solar power represented 1,27% of the energy generated in the country. [127] In 2021, Brazil was the 14th country in the world in terms of installed solar power (13 GW), [138] and the 11th largest producer of solar energy in the world (16.8 TWh). [139]

In 2020, Brazil was also the 2nd largest country in the world in the production of energy through biomass (energy production from solid biofuels and renewable waste), with 15,2 GW installed. [140]

Transport

Rio-Niteroi Bridge. Ilha de Mocangue by Diego Baravelli (cropped).jpg
Rio–Niterói Bridge.
Sao Paulo-Guarulhos International Airport with the Sao Paulo Metro, the airport metro station that connects with the city of Sao Paulo. Vista Aeroporto Guarulhos.jpg
São Paulo–Guarulhos International Airport with the São Paulo Metro, the airport metro station that connects with the city of São Paulo.
Port of Santos. Port Santos.jpg
Port of Santos.

Transport in Brazil is basically carried out using the road mode, the most developed in the region. There is also a considerable infrastructure of ports and airports. The railway and fluvial sector, although it has potential, is usually treated in a secondary way.

Brazil has more than 1.7 million km of roads, of which 215,000 km are paved, and about 17,000 km are divided highways. The two most important highways in the country are BR-101 and BR-116. [141] Due to the Andes Mountains, Amazon River and Amazon Forest, there have always been difficulties in implementing transcontinental or bioceanic highways. Practically the only route that existed was the one that connected Brazil to Buenos Aires, in Argentina and later to Santiago, in Chile. However, in recent years, with the combined effort of South American countries, new routes have started to emerge, such as Brazil-Peru (Interoceanic Highway), and a new highway between Brazil, Paraguay, northern Argentina and northern Chile (Bioceanic Corridor).

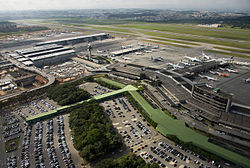
There are more than 2,000 airports in Brazil. The country has the second largest number of airports in the world, behind only the United States. São Paulo International Airport, located in the Metropolitan Region of São Paulo, is the largest and busiest in the country – the airport connects São Paulo to practically all major cities around the world. Brazil has 44 international airports, such as those in Rio de Janeiro, Brasília, Belo Horizonte, Porto Alegre, Florianópolis, Cuiabá, Salvador, Recife, Fortaleza, Belém and Manaus, among others. The 10 busiest airports in South America in 2017 were: São Paulo-Guarulhos (Brazil), Bogotá (Colombia), São Paulo-Congonhas (Brazil), Santiago (Chile), Lima (Peru), Brasília (Brazil), Rio de Janeiro (Brazil), Buenos Aires-Aeroparque (Argentina), Buenos Aires-Ezeiza (Argentina), and Minas Gerais (Brazil). [142]

About ports, Brazil has some of the busiest ports in South America, such as Port of Santos, Port of Rio de Janeiro, Port of Paranaguá, Port of Itajaí, Port of Rio Grande, Port of São Francisco do Sul and Suape Port. The 15 busiest ports in South America are: Port of Santos (Brazil), Port of Bahia de Cartagena (Colombia), Callao (Peru), Guayaquil (Ecuador), Buenos Aires (Argentina), San Antonio (Chile), Buenaventura (Colombia), Itajaí (Brazil), Valparaíso (Chile), Montevideo (Uruguay), Paranaguá (Brazil), Rio Grande (Brazil), São Francisco do Sul (Brazil), Manaus (Brazil) and Coronel (Chile). [143]

The Brazilian railway network has an extension of about 30,000 kilometers. It is basically used for transporting ores. [144]

Among the main Brazilian waterways, two stand out: Hidrovia Tietê-Paraná (which has a length of 2,400 km, 1,600 on the Paraná River and 800 km on the Tietê River, draining agricultural production from the states of Mato Grosso, Mato Grosso do Sul, Goiás and part of Rondônia, Tocantins and Minas General) and Hidrovia do Solimões-Amazonas (it has two sections: Solimões, which extends from Tabatinga to Manaus, with approximately 1600 km, and Amazonas, which extends from Manaus to Belém, with 1650 km.

Almost entirely passenger transport from the Amazon basin is done by this waterway, in addition to practically all cargo transportation that is directed to the major regional centers of Belém and Manaus). In Brazil, this transport is still underutilized: the most important waterway stretches, from an economic point of view, are found in the Southeast and South of the country. Its full use still depends on the construction of locks, major dredging works and, mainly, of ports that allow intermodal integration.

Exports and imports

Brazil is the largest producer and exporter of soybeans in the world. Farm in Southern Brazil. Agro PR Soja em Guarapuava.jpg
Brazil is the largest producer and exporter of soybeans in the world. Farm in Southern Brazil.
Brazil is the largest producer and exporter of coffee in the world. Brazilian coffee farmer producing. Coffee farmer in Brazil.jpg
Brazil is the largest producer and exporter of coffee in the world. Brazilian coffee farmer producing.
Port of Rio de Janeiro. Museu do Amanha 05 2016 Rio 2085.jpg
Port of Rio de Janeiro.
Recife with its skyscrapers. Recife - Boa Viagem.jpg
Recife with its skyscrapers.

Products

Brazil was the 25th largest exporter in the world in 2020, with 1.1% of the global total. [145]

In 2021, Brazil exported US$280.4 billion and imported US$219.4 billion, with a surplus of US$61 billion. [146]

The country's top ten export products were: [147]

The country also exports maize, coffee, cotton, tobacco, orange juice, footwear, airplanes, helicopters, cars, vehicle parts, gold, ethanol, semi-finished iron, among others. [148] [149]

Exports

The main countries to which Brazil exports in 2021 were: [150]

The country's export model, until today, is excessively based on exports of basic or semi-manufactured products, generating criticism, since such model generates little monetary value, which prevents further growth in the country in the long run. There are several factors that cause this problem, the main ones being: the excessive collection of taxes on production (due to the country's economic and legislative model being based on State Capitalism and not on Free-Market Capitalism), the lack or deficiency of infrastructure (means of transport such as roads, railways and ports that are insufficient or weak for the country's needs, bad logistics and excessive bureaucracy) for export, high production costs (expensive energy, expensive fuel, expensive maintenance of trucks, expensive loan rates and bank financing for production, expensive export rates), the lack of an industrial policy, the lack of focus on adding value, the lack of aggressiveness in international negotiations, in addition to abusive tariff barriers imposed by other countries on the country's exports. Because of this, Brazil has never been very prominent in international trade.

Due to its size and potential, it would be able to be among the 10 largest exporters in the world, however, its participation in global commercial transactions usually oscillates between 0.5 and 2% only. In 2019, among the ten products that Brazil exports the most and that generate the most value, eight come from the agribusiness. Although still modest, the country's exports have evolved, and today they are more diversified than they were in the past. At the beginning of the 20th century, 70% of Brazilian exports were restricted to coffee. Overall, however, global trade still concentrates its few exports on low-tech products (mainly agricultural and mineral commodities) and, therefore, with low added value. [151] [152] [153] [154] [155]

Imports

The main countries from which Brazil imports in 2021 were: [150]

Economic status

Statistical Table
Inflation (IPCA)
200212.53%
20039.30%
20047.60%
20055.69%
20063.14%
20074.46%
20085.91%
20094.31%
20105.90%
20116.50%
20125.84%
20135.91%
20146.41%
201510.67%
20166.29%
20172.95%
20183.75%
20194.31%
20204.52%
202110.06%
20225,79%
Source: [156] [157]
Average GDP growth rate 1950–2017
1950–597.1%
1960–696.1%
1970–798.9%
1980–893.0%
1990–991.7%
2000–093.3%
2010–171.4%
Source: [158]

Sustainable growth

Portuguese explorers arrived in 1500, but it was only in 1808 that Brazil obtained a permit from the Portuguese colonial government to set up its first factories and manufacturers. In the 21st century, Brazil became the eighth largest economy in the world. Originally, its exports were basic raw and primary goods, such as sugar, rubber and gold. Today, 84% of exports are of manufactured and semi-manufactured products.

The period of great economic transformation and growth occurred between 1875 and 1975. [159]

In the last decade, domestic production increased by 32.3%. Agribusiness (agriculture and cattle-raising), which grew by 47% or 3.6% per year, was the most dynamic sector – even after having weathered international crises that demanded constant adjustments to the Brazilian economy. [160] The Brazilian government also launched a program for economic development acceleration called Programa de Aceleração do Crescimento, aiming to spur growth. [161]

Brazil's transparency rank in the international world is 75th according to Transparency International. [162]

Control and reform

Among measures recently adopted to balance the economy, Brazil carried out reforms to its social security (state and retirement pensions) and tax systems. These changes brought with them a noteworthy addition: a Law of Fiscal Responsibility which controls public expenditure by the executive branches at federal, state and municipal levels. At the same time, investments were made towards administration efficiency and policies were created to encourage exports, industry and trade, thus creating "windows of opportunity" for local and international investors and producers.

With these alterations in place, Brazil has reduced its vulnerability: it does not import the oil it consumes; it has halved its domestic debt through exchange rate-linked certificates and has seen exports grow, on average, by 20% a year. The exchange rate does not put pressure on the industrial sector or inflation (at 4% a year), and does away with the possibility of a liquidity crisis. As a result, the country, after 12 years, has achieved a positive balance in the accounts which measure exports/imports, plus interest payments, services and overseas payment. Thus, respected economists say that the country will not be deeply affected by the current world economic crisis. [163]

In 2017, President Michel Temer refused to make public the list of companies accused of "modern slavery". The list, made public yearly since the presidency of Lula Da Silva in 2003, was intended to persuade companies to settle their fines and conform to labor regulations, in a country where corruption of the political class risked compromising respect for the law. The relations of the president-in-office with the "landowner lobby" were denounced by dismissed President Dilma Rousseff on this occasion. [164]

Central business district of Rio de Janeiro. Downtown of Rio de Janeiro.jpg
Central business district of Rio de Janeiro.

Consistent policies

Support for the productive sector has been simplified at all levels; active and independent, Congress and the Judiciary Branch carry out the evaluation of rules and regulations. Among the main measures taken to stimulate the economy are the reduction of up to 30 percent on manufactured products tax (IPI), and the investment of $8 billion on road cargo transportation fleets, thus improving distribution logistics. Further resources guarantee the propagation of business and information telecenters.

The policy for industry, technology and foreign trade, at the forefront of this sector, for its part, invests $19.5 billion in specific sectors, following the example of the software and semiconductor, pharmaceutical and medicine product, and capital goods sectors. [165]

Mergers and acquisitions

Between 1985 and 2017, 11,563 mergers & acquisitions with a total known value of US$1,185 billion with the involvement of Brazilian firms were announced. [166] The year 2010 was a new record in terms of value with $115 billion of transactions. It is worth noticing, that in the top 100 deals by value there are only four cases of Brazilian companies acquiring a foreign company. This reflects the strong interest in the country from a direct investment perspective.

Here is a list of the largest deals where Brazilian companies took on either the role of the acquiror or the target:

Date AnnouncedAcquiror NameAcquiror Mid IndustryAcquiror NationTarget NameTarget Mid IndustryTarget NationValue of Transaction ($mil)
9 January 2010 Petrobras Oil & GasBrazilBrazil-Oil & Gas BlocksOil & GasBrazil42,877.03
20 February 2017 Vale SA Metals & MiningBrazilValepar SAMetals & MiningBrazil20,956.66
8 November 2006Cia Vale do Rio Doce SAMetals & MiningBrazilInco LtdMetals & MiningCanada17,150.30
20 February 2008 BM&F BrokerageBrazilBovespa Holding SABrokerageBrazil10,309.09
13 January 2000 Telefónica SATelecommunications ServicesSpainTelecommunicacoes de São PauloTelecommunications ServicesBrazil10,213.31
31 July 2014Telefónica Brasil SATelecommunications ServicesBrazilGVT Participacoes SATelecommunications ServicesBrazil9,823.31
5 October 2010Telefónica SATelecommunications ServicesSpainBrasilcel NVTelecommunications ServicesBrazil9,742.79
11 March 2008 Banco Itaú Holding Financeira BanksBrazil Unibanco Holdings SA Other FinancialsBrazil8,464.77
3 March 2004 Ambev Food and BeverageBrazilJohn Labatt LtdFood and BeverageCanada7,758.01
10 January 2010 China Petrochemical Corporation Oil & GasChinaRepsol YPF Brasil SAOil & GasBrazil7,111.00
2 July 2012Banestado ParticipacoesOther FinancialsBrazil Redecard SA Computers & PeripheralsBrazil6,821.71

Entrepreneurship

Embraer, a Brazilian company, is the third-largest commercial jet maker in the world, just behind Airbus and Boeing. Sede-da-embraer.jpg
Embraer, a Brazilian company, is the third-largest commercial jet maker in the world, just behind Airbus and Boeing.

According to a search of Global Entrepreneurship Monitor in 2011 Brazil had 27 million adults aged between 18 and 64 either starting or owning a business, meaning that more than one in four Brazilian adults were entrepreneurs. In comparison to the other 54 countries studied, Brazil was the third-highest in total number of entrepreneurs. The Institute of Applied Economic Research (Ipea), a government agency, found that 37 million jobs in Brazil were associated with businesses with less than 10 employees. [167]

Even though Brazil ranks internationally as one of the hardest countries in the region to do business due to its complicated bureaucracy, there is a healthy number of entrepreneurs, thanks to the huge internal consumer market and various government programs.

The most recent research of Global Entrepreneurship Monitor revealed in 2013 that 50.4% of Brazilian new entrepreneurs are men, 33.8% are in the 35–44 age group, 36.9% completed high school and 47.9% earn 3–6 times the Brazilian minimum wage. In contrast, 49.6% of entrepreneurs are female, only 7% are in the 55–64 age group, 1% have postgraduate education and 1.7% earn more than 9 times the minimum wage. [168]

Credit rating

Brazil's credit rating was downgraded by Standard & Poor's (S&P) to BBB in March 2014, just one notch above junk. [169] It was further downgraded in January 2018 by S&P to BB−, which is 2 notches below investment grade. [170]

Climate change

There are multiple impacts of climate change on basic Brazilian production systems, such as increasing existing shortages and increasing production costs. [171] It is also expected that more and more serious natural disasters will occur. This will likely result in major problems for food supply, public health, industrial production, trade, installed infrastructure, the general quality of life of the population and national security as a whole, with the poor suffering the most serious consequences. The areas most vulnerable to major impacts are the Northeast and Southeast regions, exactly where most of the Brazilian people are concentrated, and large cities, which in general are poorly prepared to face the challenge. [171]

See also

Related Research Articles

<span class="mw-page-title-main">Economy of Chile</span>

The economy of Chile is a market economy and high-income economy as ranked by the World Bank. The country is considered one of South America's most prosperous nations, leading the region in competitiveness, income per capita, globalization, economic freedom, and low perception of corruption. Although Chile has high economic inequality, as measured by the Gini index, it is close to the regional mean.

<span class="mw-page-title-main">Economy of the Dominican Republic</span>

The economy of the Dominican Republic is the seventh largest in Latin America, and is the largest in the Caribbean and Central American region. The Dominican Republic is an upper-middle income developing country with important sectors including mining, tourism, manufacturing, energy, real estate, infrastructure, telecommunications and agriculture. The Dominican Republic is on track to achieve its goal of becoming a high-income country by 2030, and is expected to grow 79% in this decade. The country is the site of the single largest gold mine in Latin America, the Pueblo Viejo mine.Although the service sector is currently the leading employer of Dominicans, agriculture remains an important sector in terms of the domestic market and is in second place in terms of export earnings. Tourism accounts for more than $7.4 billion in annual earnings in 2019. Free-trade zone earnings and tourism are the fastest-growing export sectors. A leading growth engine in the Free-trade zone sector is the production of medical equipment for export having a value-added per employee of $20,000 USD, total revenue of $1.5 billion USD, and a growth rate of 7.7% in 2019. The medical instrument export sector represents one of the highest-value added sectors of the country's economy, a true growth engine for the country's emerging market. Remittances are an important sector of the economy, contributing $8.2 billion in 2020. Most of these funds are used to cover household expenses, such as housing, food, clothing, health care and education. Secondarily, remittances have financed businesses and productive activities. Thirdly, this combined effect has induced investment by the private sector and helps fund the public sector through its value-added tax. The combined import market including the free-trade-zones amounts to a market of $20 billion a year in 2019. The combined export sector had revenues totaling $11 billion in 2019. The consumer market is equivalent to $61 billion in 2019. An important indicator is the average commercial loan interest rate, which directs short-term investment and stimulates long-term investment in the economy. It is currently 8.30%, as of June 2021.

<span class="mw-page-title-main">Economy of Kazakhstan</span>

The economy of Kazakhstan is the largest in Central Asia in both absolute and per capita terms. In 2021, Kazakhstan attracted more than US$370 billion of foreign investments since becoming an independent republic after the collapse of the former Soviet Union.

<span class="mw-page-title-main">Economy of Vietnam</span>

The economy of Vietnam is a developing mixed socialist-oriented market economy incorporating industrial policies and strategic five-year plans, which is the 35th-largest in the world as measured by nominal gross domestic product (GDP) and 26th-largest in the world as measured by purchasing power parity (PPP) in 2022. It is a lower-middle income country with a low cost of living. Vietnam is a member of the Asia-Pacific Economic Cooperation, the Association of Southeast Asian Nations and the World Trade Organization.

<span class="mw-page-title-main">Economy of Bolivia</span>

The economy of Bolivia is the 95th-largest in the world in nominal terms and the 87th-largest in purchasing power parity. Bolivia is classified by the World Bank to be a lower middle income country. With a Human Development Index of 0.703, it is ranked 114th. Driven largely by its natural resources, Bolivia has become a region leader in measures of economic growth, fiscal stability and foreign reserves, although it remains a historically poor country. The Bolivian economy has had a historic single-commodity focus. From silver to tin to coca, Bolivia has enjoyed only occasional periods of economic diversification. Political instability and difficult topography have constrained efforts to modernize the agricultural sector. Similarly, relatively low population growth coupled with low life expectancy has kept the labor supply in flux and prevented industries from flourishing. Rampant inflation and corruption previously created development challenges, but in the early twenty-first century the fundamentals of its economy showed unexpected improvement, leading Moody's Investors Service to upgrade Bolivia's economic rating in 2010 from B2 to B1. The mining industry, especially the extraction of natural gas and zinc, currently dominates Bolivia's export economy.

<span class="mw-page-title-main">Minas Gerais</span> State in Southeastern Brazil

Minas Gerais ( ) is a state in Southeastern Brazil. It ranks as the second most populous, the third by gross domestic product (GDP), and the fourth largest by area in the country. The state's capital and largest city, Belo Horizonte, is a major urban and finance center in Latin America, and the sixth largest municipality in Brazil and its metropolitan area is the third largest in Brazil with just over 5.8 million inhabitants, after those of São Paulo and Rio de Janeiro. Nine Brazilian presidents were born in Minas Gerais, the most of any state. The state has 10.1% of the Brazilian population and is responsible for 8.7% of the Brazilian GDP.

<span class="mw-page-title-main">Paraná (state)</span> State of Brazil

Paraná is one of the 26 states of Brazil, in the south of the country. It is bordered in the north by São Paulo state, in the east by the Atlantic Ocean, in the south by Santa Catarina state and the province of Misiones, Argentina, and in the west by Mato Grosso do Sul and Paraguay, with the Paraná River as its western boundary. It is subdivided into 399 municipalities, and its capital is the city of Curitiba. Other major cities are Londrina, Maringá, Ponta Grossa, Cascavel, São José dos Pinhais and Foz do Iguaçu. The state is home to 5.4% of the Brazilian population and generates 6.2% of the Brazilian GDP.

<span class="mw-page-title-main">São Paulo (state)</span> State of Brazil

São Paulo is one of the 26 states of the Federative Republic of Brazil and is named after Saint Paul of Tarsus. It is located in the Southeast Region and is limited by the states of Minas Gerais to the north and northeast, Paraná to the south, Rio de Janeiro to the east and Mato Grosso do Sul to the west, in addition to the Atlantic Ocean to the southeast. It is divided into 645 municipalities and its total area is 248,219.481 square kilometres km², which is equivalent to 2.9% of Brazil's surface, being slightly larger than the United Kingdom. Its capital is the municipality of São Paulo.

<span class="mw-page-title-main">Pará</span> State in Brazil

Pará is a state of Brazil, located in northern Brazil and traversed by the lower Amazon River. It borders the Brazilian states of Amapá, Maranhão, Tocantins, Mato Grosso, Amazonas and Roraima. To the northwest are the borders of Guyana and Suriname, to the northeast of Pará is the Atlantic Ocean. The capital and largest city is Belém, which is located at the Marajó bay, near the estuary of the Amazon river. The state, which is home to 4.1% of the Brazilian population, is responsible for just 2.2% of the Brazilian GDP.

<span class="mw-page-title-main">Santa Catarina (state)</span> State of Brazil

Santa Catarina is one of the 27 federative units of Brazil. It is located in the centre of the country's Southern region. It is bordered to the north by the state of Paraná, to the south by the state of Rio Grande do Sul, to the east by the Atlantic Ocean, and to the west by the Argentine province of Misiones.

<span class="mw-page-title-main">Economy of South America</span>

The economy of South America comprises approximately 434 million people living in 12 nations and three territories. It encompasses 6 percent of the world's population.

<span class="mw-page-title-main">South Region, Brazil</span> Region in Brazil

The South Region of Brazil is one of the five regions of Brazil. It includes the states of Paraná, Rio Grande do Sul, and Santa Catarina, and covers 576,409.6 square kilometres (222,553.0 sq mi), being the smallest region of the country, occupying only about 6.76% of the territory of Brazil. Its whole area is smaller than that of the state of Minas Gerais, in Southeast Brazil, for example or the whole metropolitan France.

<span class="mw-page-title-main">Southeast Region, Brazil</span> Region in Brazil

The Southeast Region of Brazil is composed of the states of Espírito Santo, Minas Gerais, Rio de Janeiro and São Paulo. It is the richest region of the country, responsible for approximately 60% of the Brazilian GDP, as São Paulo, Rio de Janeiro, and Minas Gerais are the three richest states of Brazil, the top three Brazilian states in terms of GDP. The Southeast of Brazil also has the highest GDP per capita among all Brazilian regions.

<span class="mw-page-title-main">Agriculture in Brazil</span> Major economic sector in Brazil

The agriculture of Brazil is historically one of the principal bases of Brazil's economy. While its initial focus was on sugarcane, Brazil eventually became the world's largest exporter of coffee, soybeans, beef, and crop-based ethanol.

<span class="mw-page-title-main">Industry in Brazil</span> Overview of industries in Brazil

Brazilian industry has its earliest origin in workshops dating from the beginning of the 19th century. Most of the country's industrial establishments appeared in the Brazilian southeast, and, according to the Commerce, Agriculture, Factories and Navigation Joint, 77 establishments registered between 1808 and 1840 were classified as "factories" or "manufacturers". However, most, about 56 establishments, would be considered workshops by today's standards, directed toward the production of soap and tallow candles, snuff, spinning and weaving, foods, melting of iron and metals, wool and silk, amongst others. They used both slaves and free laborers.

<span class="mw-page-title-main">Mining in Brazil</span> Major industry in Brazil, South America

Mining in Brazil is centered on the extraction of iron, copper, gold, aluminum, manganese, tin, niobium, and nickel. About gemstones, Brazil is the world's largest producer of amethyst, topaz, agate and is a big producer of tourmaline, emerald, aquamarine, garnet and opal.

<span class="mw-page-title-main">Economy of Argentina</span>

The economy of Argentina is the second-largest national economy in South America, behind Brazil. Argentina is a developing country with a highly literate population, an export-oriented agricultural sector, and a diversified industrial base.

The creative industry in Brazil refers to various economic sectors of Brazil that depend on the talents and creativity to develop. In other words, these economic sectors generate wealth for the region through knowledge, culture and creativity, and contribute to sustainable development. The term 'creative industries' was coined by the United Kingdom in 1990 and, in 2001, was augmented by two important additions: by researcher John Howkins, who applied an entrepreneurial vision when focusing on the transformation of creativity in product; and professor Richard Florida, whose research focused on the professionals involved in the creative processes of production, and addressed the social aspects and the "potential contribution to the development" of the "creative class".

<span class="mw-page-title-main">BR-364 (Brazil highway)</span> Highway in Brazil

BR-364 is an inter-state highway in Brazil connecting the southeast state of São Paulo to the western state of Acre. The highway was opened in the 1960s and paved in the 1980s. It has brought economic development and population growth in the Amazon basin states of Rondônia and Acre. It is also important for the flow of agricultural and livestock production in the states of Rondônia, Mato Grosso and Goiás, for Brazilian domestic consumption and for export, predominately by Port of Santos.

<span class="mw-page-title-main">Latin American economy</span> Overview of the economy of Latin American

Latin America as a region has multiple nation-states, with varying levels of economic complexity. The Latin American economy is an export-based economy consisting of individual countries in the geographical regions of North America, Central America, South America, and the Caribbean. The socioeconomic patterns of what is now called Latin America were set in the colonial era when the region was controlled by the Spanish and Portuguese empires. Up until independence in the early nineteenth century, colonial Latin American regional economies thrived and worked things out. Many parts of the region had favorable factor endowments of deposits of precious metals, mainly silver, or tropical climatic conditions and locations near coasts that allowed for the development of cane sugar plantations. In the nineteenth century following independence, many economies of Latin America declined. In the late nineteenth century, much of Latin America was integrated into the world economy as an exporter of commodities. Foreign capital investment, construction of infrastructure, such as railroads, growth in the labor sector with immigration from abroad, strengthening of institutions, and expansion of education aided industrial growth and economic expansion. A number of regions have thriving economies, but "poverty and inequality have been deeply rooted in Latin American societies since the early colonial era."

References

  1. "World Economic Outlook Database, April 2019". International Monetary Fund . Retrieved 29 September 2019.
  2. "World Bank Country and Lending Groups". World Bank . Retrieved 29 September 2019.
  3. População do Brasil - Número Oficial IBGE
  4. 1 2 3 4 "World Economic Outlook Database, October 2023". International Monetary Fund . Retrieved 6 November 2023.
  5. 1 2 3 "The outlook is uncertain again amid financial sector turmoil, high inflation, ongoing effects of Russia's invasion of Ukraine, and three years of COVID". International Monetary Fund . 11 April 2023.
  6. Brazil: Share of economic sectors in the gross domestic product (GDP) from 2010 to 2020
  7. IPCA Brazil
  8. Poverty in Brazil of 4.1% in 2022
  9. "Poverty headcount ratio at $6.85 a day (2017 PPP) (% of population) - Brazil". World Bank . Retrieved 1 March 2022.
  10. "World Bank Open Data". World Bank Open Data. Retrieved 17 January 2024.
  11. "Human Development Report 2021/2022" (PDF). United Nations Development Programme. 8 September 2022. Archived (PDF) from the original on 9 October 2022. Retrieved 8 September 2022.
  12. "2022 Corruption Perceptions Index - Explore Brazil's results". Transparency.org. 31 January 2023. Retrieved 30 January 2024.
  13. Brazilian labor force in numbers
  14. "LFS by sex and age - indicators". OECD. 2020. Retrieved 5 July 2020.
  15. Brazil: Distribution of employment by economic sector from 2009 to 2019
  16. "Brazil Unemployment Rate". CNN Brazil. Retrieved 9 November 2023.
  17. "massa salarial | Carta de Conjuntura" (in Brazilian Portuguese). 5 September 2023. Retrieved 23 November 2023.
  18. 1 2 "Exportações brasileiras cresceram dez vezes mais do que a média mundial em 2023, afirma vice-presidente". Agência Gov (in Brazilian Portuguese). Retrieved 7 January 2024.
  19. 1 2 gov.br (1 December 2022). "Balança comercial tem superávit de US$ 6,675 bilhões em novembro" (in Portuguese). Retrieved 27 August 2023.
  20. "World Bank Open Data". World Bank Open Data. Retrieved 23 November 2023.
  21. Brazil Current Account Balance 1995 - 2021
  22. "Dívida externa bruta (Gross external debt)". UOL. 1950–2021. Archived from the original on 30 January 2012. Retrieved 7 November 2022. Alt URL
  23. "Brazil Government Debt: % of GDP". CEIC Data. Retrieved 23 November 2023.
  24. Brazil's posts 35.1 billion reais 2021 deficit, best primary figure in 7 years
  25. 1 2 Revenues and spending in Brazilian Reais
  26. Standard & Poor's
  27. Moody's
  28. "Fitch Upgrades Brazil to 'BB'; Outlook Stable". Fitch Ratings . 26 July 2023. Retrieved 11 September 2023.
  29. "Detalhamento do Gráfico – Reservas Internacionais". Banco Central do Brasil (in Brazilian Portuguese). Retrieved 8 November 2023.
  30. Is Brazil's Economy Getting Too Hot? Forbes. Retrieved on 24 October 2011.
  31. 1 2 3 4 "World Economic Outlook Database, April 2022". International Monetary Fund . Retrieved 19 April 2022.
  32. "World Economic Outlook Database, April 2022". International Monetary Fund. 19 April 2022. Retrieved 19 April 2022.
  33. "World Economic Outlook Database, April 2022". International Monetary Fund. 19 April 2022. Retrieved 19 April 2022.
  34. "World Economic Outlook Database, October 2023 Edition. (Brazil)". IMF.org. International Monetary Fund. 10 October 2023. Retrieved 10 October 2023.
  35. "World Economic Outlook Database, April 2022". International Monetary Fund. 19 April 2022. Retrieved 19 April 2022.
  36. "Brazil's Economy Projected to shrink | Al Jazeera America".
  37. Global Competitiveness Report 2009–2010 Archived 1 October 2009 at the Wayback Machine World Economic Forum. Retrieved on 24 October 2011.
  38. "Statista billionaires".
  39. Brazil is invited to start the OECD accession process
  40. "World Crude Steel Production - Summary" (PDF). World Steel Association. 25 January 2019. Archived from the original (PDF) on 2 February 2019. Retrieved 21 June 2020.
  41. "Top five iron ore producing companies in 2020 by mining output". NS Energy. 10 May 2021. Retrieved 30 August 2023.
  42. Petrobras passa a ser a empresa mais valiosa da América Latina
  43. Baten, Jörg; Stolz, Yvonne; Botelho, Tarcísio (2013). "Growth Effects of 19th century mass migration: "Fome Zero" for Brazil?". European Review of Economic History. 17–1: 95–121.
  44. "Why Invest in Brazil". M&A Advisors Brazil. 23 August 2018. Retrieved 12 October 2018.
  45. "Brazil - Population 2017". countryeconomy.com. Retrieved 12 October 2018.
  46. "BIG - Banco de Informa es de Gera o". Archived from the original on 26 February 2013.
  47. "Brazil GDP per capita, 1980–2017 – knoema.com". Knoema. Retrieved 12 October 2018.
  48. 1 2 About Brazil Brazilian government. Retrieved on 24 October 2011.
  49. "Brazil moved to fourth investment destination in the world in 2019". 20 January 2020.
  50. Brazil's Currency Wars – A "Real" Problem Archived 28 July 2014 at the Wayback Machine Sounds and Colours. Retrieved on 24 October 2011.
  51. The Secret Strength of Pakistan's Economy – Businessweek, 2017
  52. "Brazil's Odebrecht scandal, by Anne Vigna (Le Monde diplomatique - English edition, October 2017)". October 2017.
  53. "Report for Selected Countries and Subjects". IMF. Retrieved 26 February 2024.
  54. "Brazil - Order and Progress". Archived from the original on 8 August 2014. Retrieved 1 August 2014.
  55. "Production of Brazil in 2018, by FAO".
  56. "Conheça os 3 países que desafiam o Brasil nas exportações de frango". Avicultura Industrial.
  57. Formigoni, Ivan (30 May 2019). "Maiores exportadores de carne de frango entre 2015 e 2019".
  58. "IBGE: rebanho de bovinos tinha 218,23 milhões de cabeças em 2016 | BeefPoint". beefpoint.com.br.
  59. "Brasil é o 3º maior produtor de leite do mundo, superando o padrão Europeu em alguns municípios". 8 February 2020. Archived from the original on 17 September 2020. Retrieved 31 October 2020.
  60. "Principais países produtores de carne suína entre 2017 e 2019". 23 July 2019.
  61. "Brasil é sétimo maior produtor mundial de ovos". Avicultura Industrial.
  62. 1 2 3 4 5 6 7 Agriculture Brazilian Government. Retrieved on 24 October 2011.
  63. Popclock Archived 30 April 2007 at the Wayback Machine IBGE
  64. Indicators Brazilian Government. Retrieved on 24 October 2011.
  65. "ANM". gov.br Agência Nacional de Mineração.
  66. "Brasil extrai cerca de 2 gramas de ouro por habitante em 5 anos". R7.com. 29 June 2019.
  67. "G1 > Economia e Negócios - NOTÍCIAS - Votorantim Metais adquire reservas de zinco da Masa". g1.globo.com.
  68. "Nióbio: G1 visita em MG complexo industrial do maior produtor do mundo". G1.
  69. "Serviço Geológico do Brasil". cprm.gov.br.
  70. "Rio Grande do Sul: o maior exportador de pedras preciosas do Brasil". Band.com.br.
  71. "USGS Niobium Production Statistics" (PDF).
  72. "USGS Tantalum Production Statistics" (PDF).
  73. "USGS Iron Ore Production Statistics" (PDF).
  74. "USGS Manganese Production Statistics" (PDF).
  75. "USGS Bauxite Production Statistics" (PDF).
  76. "USGS Vanadium Production Statistics" (PDF).
  77. "USGS Lithium Production Statistics" (PDF).
  78. "USGS Tin Production Statistics" (PDF).
  79. "USGS Nickel Production Statistics" (PDF).
  80. "USGS Phosphate Production Statistics" (PDF).
  81. "USGS Gold Production Statistics" (PDF).
  82. "USGS Copper Production Statistics" (PDF).
  83. 1 2 "Anuario Mineral Brasileiro".
  84. "USGS Titanium Production Statistics" (PDF).
  85. "USGS Gypsum Production Statistics" (PDF).
  86. "USGS Graphite Production Statistics" (PDF).
  87. "USGS Sulfur Production Statistics" (PDF).
  88. "USGS Salt Production Statistics" (PDF).
  89. "Industrial production registers growth in 2018, IBGE".
  90. "Manufacturing, added value (current US $)".
  91. "Alimentos Processados | A indústria de alimentos e bebidas na sociedade brasileira atual". alimentosprocessados.com.br.
  92. "Faturamento da indústria de alimentos cresceu 6,7% em 2019". G1.
  93. "Indústria de alimentos e bebidas faturou R$ 699,9 bi em 2019". Agência Brasil. 18 February 2020.
  94. "Produção nacional de celulose cai 6,6% em 2019, aponta Ibá". Valor Econômico.
  95. "Sabe qual é o estado brasileiro que mais produz Madeira?". 9 October 2017.
  96. "São Mateus é o 6º maior produtor de madeira em tora para papel e celulose no país, diz IBGE". G1.
  97. "Indústrias calçadistas em Franca, SP registram queda de 40% nas vagas de trabalho em 6 anos". G1.
  98. Digital, Agência Maya: Criação de Sites e Marketing. "Fenac - Centro de Eventos e Negócios | Produção de calçados deve crescer 3% em 2019". fenac.com.br.
  99. "Abicalçados apresenta Relatório Setorial 2019". abicalcados.com.br. Archived from the original on 22 April 2020. Retrieved 31 October 2020.
  100. "Exportação de Calçados: Saiba mais". 27 February 2020.
  101. Comércio, Diário do (24 January 2020). "Minas Gerais produz 32,3% do aço nacional em 2019".
  102. "O novo mapa das montadoras, que agora rumam para o interior do País". 8 March 2019.
  103. "Indústria automobilística do Sul do Rio impulsiona superavit na economia". G1.
  104. "Indústria Química no Brasil" (PDF). Archived (PDF) from the original on 9 October 2022.
  105. "Estudo de 2018" (PDF). Archived (PDF) from the original on 9 October 2022.
  106. "Produção nacional da indústria de químicos cai 5,7% em 2019, diz Abiquim". economia.uol.com.br.
  107. "Industria Textil no Brasil". Archived from the original on 9 October 2022.
  108. "Government breaks reinsurance monopoly, discards privatization (in Portuguese)" . Retrieved 29 April 2008.
  109. "Indústria Criativa - Mapeamento da Indústria Criativa no Brasil (PDF - 1,85 MB)" (PDF). FIRJAN, Sistema (2012). Archived from the original (PDF) on 10 August 2013. Retrieved 16 December 2013.
  110. Restrepo, Márquez, Felipe Buitrago, Iván Duque (2013). "The Orange Economy • An Infinite Opportunity" (PDF). Inter-American Development Bank. Archived (PDF) from the original on 9 October 2022. Retrieved 29 December 2021.{{cite web}}: CS1 maint: multiple names: authors list (link)
  111. Instituto Nacional da Propriedade Industrial (March 2021). "Setores Intensivos em Direitos de Propriedade Intelectual na Economia Brasileira" (PDF). Government of Brazil. Archived (PDF) from the original on 9 October 2022. Retrieved 29 December 2021.
  112. Grupo Interministerial de Propriedade Intelectual. "Estratégia Nacional de Propriedade Intelectual 2021-2030" (PDF). Government of Brazil. Archived (PDF) from the original on 12 December 2020. Retrieved 29 December 2021.
  113. Highlights of international tourism. World Tourism Organization (UNWTO). 2019. doi:10.18111/9789284421152. ISBN   9789284421152. S2CID   240665765.
  114. "Forbes Global 2000: Brazil". 5 June 2017. Archived from the original on 23 April 2011.
  115. "Production of Crude Oil including Lease Condensate 2019".
  116. "Produção de petróleo e gás no Brasil ultrapassa 4 milhões de boe/d pela primeira vez". anp.gov.br. Archived from the original on 20 February 2020. Retrieved 31 October 2020.
  117. "How many power plants do we have in Brazil?". 5 April 2019.
  118. "Brasil alcança 170 mil megawatts de capacidade instalada em 2019". Archived from the original on 13 April 2021. Retrieved 31 October 2020.
  119. "IEMA (Instituto de Energia e Meio Ambiente),2016.Série TERMOELETRICIDADE EM FOCO: Uso de água em termoelétricas" (PDF). Archived from the original (PDF) on 1 April 2018.
  120. "O BNDES e a questão energética e logística da Região Sudeste" (PDF).
  121. "Power: World's biggest hydroelectric facility". Archived from the original on 19 May 2006.
  122. "Boletim Mensal de Geração Eólica Junho/2021" (PDF) (in Portuguese). Operador Nacional do Sistema Elétrico – ONS. 1 July 2021. pp. 6, 14. Archived (PDF) from the original on 9 October 2022. Retrieved 3 August 2021.
  123. "Eólica supera 22 GW em operação no Brasil" (in Brazilian Portuguese). Megawhar. 21 July 2022. Retrieved 2 August 2022.
  124. "Brasil é o país com melhor fator de aproveitamento da energia eólica". Governo do Brasil (in Brazilian Portuguese). Archived from the original on 7 October 2018. Retrieved 7 October 2018.
  125. "Boletim Trimestral de Energia Eólica – Junho de 2020" (PDF) (in Brazilian Portuguese). Empresa de Pesquisa Energética. 23 June 2020. p. 4. Archived (PDF) from the original on 9 October 2022. Retrieved 24 October 2020.
  126. 1 2 "Quantas usinas geradoras de energia temos no Brasil?". 5 April 2019.
  127. "Ventos promissores a caminho".
  128. "Brazilian onshore wind potential could be 880 GW, study indicates".
  129. Renewable Capacity Statistics 2021
  130. "Global wind statistics" (PDF). IRENA. 22 April 2022. Retrieved 22 April 2022.
  131. Hannah Ritchie and Max Roser, Wind Power generation
  132. "Nuclear Power in Brazil. Briefing Paper # 95". Uranium Information Centre. May 2007. Archived from the original on 8 February 2007. Retrieved 19 May 2007.
  133. "Brazil plans to build seven nuclear reactors". Mecropress. 23 October 2006. Archived from the original on 7 September 2012. Retrieved 19 May 2007.
  134. Solar atinge 21 GW e R$ 108,6 bi em investimentos no Brasil
  135. "Quais as melhores regiões do Brasil para geração de energia fotovoltaica? - Sharenergy". Sharenergy (in Brazilian Portuguese). 3 February 2017. Archived from the original on 7 October 2018. Retrieved 7 October 2018.
  136. "Boletim Mensal de Geração Solar Fotovoltaica Setembro/2020" (PDF) (in Portuguese). Operador Nacional do Sistema Elétrico - ONS. 13 October 2020. pp. 6, 13. Archived (PDF) from the original on 9 October 2022. Retrieved 21 October 2020.
  137. Renewable Capacity Statistics 2022
  138. Hannah Ritchie, Max Roser: Solar Power Generation
  139. "Renewable Capacity Statistics 2021 page 41" (PDF). Retrieved 24 May 2021.
  140. "Anuário CNT do transporte 2018".
  141. "Brasil tem 9 dos maiores aeroportos da América Latina". 29 October 2018.
  142. "Port Activity of Latin America and the Caribbean 2018" (PDF).
  143. "Brazil". The World Factbook (2024 ed.). Central Intelligence Agency. 23 May 2022.  (Archived 2022 edition)
  144. "Exports of goods and services (current US$), by World Bank".
  145. "Balança Comercial registra superávit de US$ 61 bilhões em 2021".
  146. "Exportações no Brasil: Os principais produtos exportados". 30 June 2021.
  147. "Quais os principais produtos exportados do Brasil".
  148. "Agronegócio tem oito entre os dez produtos líderes das exportações brasileiras em 2019". Avicultura Industrial (in Portuguese). Retrieved 12 October 2022.
  149. 1 2 "Balança comercial: veja ranking dos principais parceiros do Brasil em 2021".
  150. "O Brasil exporta pouco, mas o agronegócio prospera".
  151. "Avanço de commodities na exportação representa perda de espaço da indústria".
  152. "Mola de emprego e do PIB, indústria brasileira não reage e emperra avanço da economia". 4 March 2020.
  153. "Brasil precisa exportar mais produtos industrializados, diz Ney Suassuna".
  154. "Participação da Indústria nas exportações brasileiras tem o pior resultado em 44 anos". 4 February 2021.
  155. Inflation Ipea
  156. "IPCA vai a 0,62% em dezembro e fecha 2022 em 5,79% | Agência de Notícias". Agência de Notícias - IBGE (in Brazilian Portuguese). 10 January 2023. Retrieved 30 August 2023.
  157. Average Exchange Rate Ipea
  158. Fagoyinbo, Joseph Babatunde (May 2013). The Armed Forces: Instrument of Peace, Strength, Development and Prosperity. Author House. p. 209. ISBN   978-1-4772-1844-0.
  159. Sustainable growth Brazilian Government. Retrieved on 24 October 2011.
  160. "From crisis to crisis in Brazil". The Economist. 24 July 2007.
  161. Transparency by country 2009 Transparency International. Retrieved on 24 October 2011.
  162. Control and reform Brazilian Government. Retrieved on 24 October 2011.
  163. "Au Brésil, Temer protège les esclavagistes". 16 March 2017.
  164. Consistent policies Brazilian government. Retrieved on 24 October 2011.
  165. "M&A Statistics by Countries - Institute for Mergers, Acquisitions and Alliances (IMAA)". Institute for Mergers, Acquisitions and Alliances (IMAA). Retrieved 23 February 2018.
  166. ":: Máquina News ::". Archived from the original on 26 April 2014. Retrieved 13 July 2013. A spirit for enterprise, Financial Times , 8 May 2013
  167. "GEM 2012 Global Report :: GEM Global Entrepreneurship Monitor ::". Archived from the original on 23 June 2013. Retrieved 13 July 2013. GEM 2012 Global Report
  168. Rousseff Losing Bond Investors as Downgrade to Junk Looms – Bloomberg Bloomberg
  169. "S&P cuts Brazil credit rating as pension reform doubts grow". Reuters. 11 January 2018. Retrieved 6 January 2020.
  170. 1 2 PBMC. Impactos, Vulnerabilidades e Adaptação: Sumário Executivo. Contribuição do Grupo de Trabalho 2 ao Primeiro Relatório de Avaliação Nacional do Painel Brasileiro de Mudanças Climáticas, 2013.

Further reading