The net capacity factor is the unitless ratio of actual electrical energy output over a given period of time to the theoretical maximum electrical energy output over that period.[1] The theoretical maximum energy output of a given installation is defined as its continuous operation at full nameplate capacity over the relevant period. The capacity factor can be calculated for any electricity producing installation, such as a fuel-consuming power plant or one using renewable energy, such as wind, the sun or hydro-electric installations. The average capacity factor can also be defined for any class of such installations and can be used to compare different types of electricity production.
The actual energy output during that period and the capacity factor vary greatly depending on a range of factors. The capacity factor can never exceed the availability factor, or uptime during the period. Uptime can be reduced due to, for example, reliability issues and maintenance, scheduled or unscheduled. Other factors include the design of the installation, its location, the type of electricity production and with it either the fuel being used or, for renewable energy, the local weather conditions. Additionally, the capacity factor can be subject to regulatory constraints and market forces, potentially affecting both its fuel purchase and its electricity sale.
The capacity factor is often computed over a timescale of a year, averaging out most temporal fluctuations. However, it can also be computed for a month to gain insight into seasonal fluctuations. Alternatively, it can be computed over the lifetime of the power source, both while operational and after decommissioning. A capacity factor can also be expressed and converted to full load hours.
is the nameplate capacity (rated or installed power) of the device or system, e.g., in kilowatts (kW),
is the total time period considered, e.g., in hours or years.
If consistent units are used for energy and power—such as megawatt-hours (MWh) for energy and megawatts (MW) for power—and time is expressed in hours, the units "cancel out". For example, if a 1MW plant produces 0.5MWh in one hour, its capacity factor is:
Sample calculations
Nuclear power plant
Worldwide nuclear power capacity factors
Nuclear power plants are at the high end of the range of capacity factors, ideally reduced only by the availability factor, i.e. maintenance and refueling. The largest nuclear plant in the US, Palo Verde Nuclear Generating Station, has between its three reactors a nameplate capacity of 3942MW. In 2010 its annual generation was 31200000MWh,[2] leading to a capacity factor of
Each of Palo Verde’s three reactors is refueled every 18 months, with one refueling every spring and fall. In 2014, a refueling was completed in a record 28 days,[3] compared to the 35 days of downtime that the 2010 capacity factor corresponds to.
In 2019, Prairie Island 1 was the US unit with the highest factor and actually reached 104.4%.[4]
Wind farm
The Danish offshore wind farm Horns Rev 2 has a nameplate capacity of 209.3MW. As of January 2017[update] it has produced 6416GWh since its commissioning 7years ago, i.e. an average annual production of 875GWh/year and a capacity factor of[5]
Sites with lower capacity factors may be deemed feasible for wind farms, for example, the onshore 1GW Fosen Vind, which as of 2017[update] is under construction in Norway, has a projected capacity factor of 39%. Feasibility calculations may be affected by seasonality. For example, in Finland, capacity factor during the cold winter months is more than double compared to July.[6] While the annual average in Finland is 29.5%,[6] the high demand for heating energy correlates with the higher capacity factor during the winter.
Certain onshore wind farms can reach capacity factors of over 60%, for example, the 44MW Eolo plant in Nicaragua had a net generation of 232.132GWh in 2015, equivalent to a capacity factor of 60.2%,[7] while United States annual capacity factors from 2013 through 2016 range from 32.2% to 34.7%.[8]
Since the capacity factor of a wind turbine measures actual production relative to possible production, it is unrelated to Betz's coefficient of 16/27 ≈ 59.3%, which limits production vs. energy available in the wind.
Hydroelectric dam
As of 2017[update]Three Gorges Dam in China is, with its nameplate capacity of 22,500MW, the largest power generating station in the world by installed capacity. In 2015 it generated 87TWh, for a capacity factor of
Hoover Dam has a nameplate capacity of 2080 MW[9] and an annual generation averaging 4.2TW·h.[9] (The annual generation has varied between a high of 10.348TW·h in 1984, and a low of 2.648TW·h in 1956.[9]) Taking the average figure for annual generation gives a capacity factor of
Photovoltaic power station
At the low range of capacity factors is the photovoltaic power station, which supplies power to the electricity grid from a large-scale photovoltaic system (PV system). An inherent limit to its capacity factor comes from its requirement of daylight, preferably with a sun unobstructed by clouds, smoke or smog, shade from trees and building structures. Since the amount of sunlight varies both with the time of the day and the seasons of the year, the capacity factor is typically computed on an annual basis. The amount of available sunlight is mostly determined by the latitude of the installation and the local cloud cover. The actual production is also influenced by local factors such as dust and ambient temperature, which ideally should be low. As for any power station, the maximum possible power production is the nameplate capacity times the number of hours in a year, while the actual production is the amount of electricity delivered annually to the grid.
For example, Agua Caliente Solar Project, located in Arizona near the 33rd parallel and awarded for its excellence in renewable energy has a nameplate capacity of 290MW and an actual average annual production of 740GWh/year. Its capacity factor is thus
A significantly lower capacity factor is achieved by Lauingen Energy Park located in Bavaria, near the 49th parallel. With a nameplate capacity of 25.7MW and an actual average annual production of 26.98GWh/year it has a capacity factor of 12.0%.
Determinants of a plant capacity factor
There are several reasons why a plant would have a capacity factor lower than 100%. These include technical constraints, such as operational availability of the plant (known as availability factor for electricity generators), economic reasons, and availability of an energy resource.
A plant can be out of service or operating at reduced output for part of the time due to equipment failures or routine maintenance. This accounts for most of the unused capacity of base load power plants. Base load plants usually have low costs per unit of electricity because they are designed for maximum efficiency and are operated continuously at high output. Geothermal power plants, nuclear power plants, coal-fired plants and bioenergy plants that burn solid material are almost always operated as base load plants, as they can be difficult to adjust to suit demand.
A plant can also have its output curtailed or intentionally left idle because the electricity is not needed or because the price of electricity is too low to make production economical. This accounts for most of the unused capacity of peaking power plants and load following power plants. Peaking plants may operate for only a few hours per year or up to several hours per day. Many other power plants operate only at certain times of the day or year because of variation in loads and electricity prices. If a plant is only needed during the day, for example, even if it operates at full power output from 8 am to 8 pm every day (12 hours) all year long, it would only have a 50% capacity factor. Due to low capacity factors, electricity from peaking power plants is relatively expensive because the limited generation has to cover the plant fixed costs.
A third reason is that a plant may not have the fuel available to operate all of the time. This can apply to fossil generating stations with restricted fuels supplies, but most notably applies to intermittent renewable resources.[10] Solar PV and wind turbines have a capacity factor limited by the availability of their "fuel", sunshine and wind respectively. A hydroelectricity plant may have a capacity factor lower than 100% due to restriction or scarcity of water, or its output may be regulated to match the current power need, conserving its stored water for later usage.
Other reasons that a power plant may not have a capacity factor of 100% include restrictions or limitations on air permits and limitations on transmission that force the plant to curtail output.
Capacity factor of renewable energy
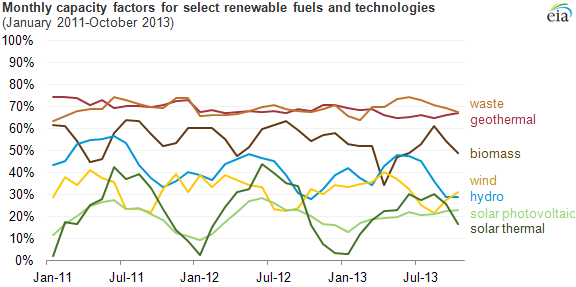
US EIA monthly capacity factors for renewables, 2011-2013
For renewable energy sources such as solar power, wind power and hydroelectricity, the main reason for reduced capacity factor is generally the availability of the energy source. The plant may be capable of producing electricity, but its "fuel" (wind, sunlight or water) may not be available. A hydroelectric plant's production may also be affected by requirements to keep the water level from getting too high or low and to provide water for fish downstream. However, solar, wind and hydroelectric plants do have high availability factors, so when they have fuel available, they are almost always able to produce electricity.[11]
When hydroelectric plants have water available, they are also useful for load following, because of their high dispatchability. A typical hydroelectric plant's operators can bring it from a stopped condition to full power in just a few minutes.
Wind farms are variable, due to the natural variability of the wind. For a wind farm, the capacity factor is determined by the availability of wind, the swept area of the turbine and the size of the generator. Transmission line capacity and electricity demand also affect the capacity factor. Typical capacity factors of current wind farms are between 25 and 45%.[12] In the United Kingdom during the five year period from 2011 to 2019 the annual capacity factor for wind was over 30%.[13][14][15][16]
Solar energy is variable because of the daily rotation of the earth, seasonal changes, and because of cloud cover. For example, the Sacramento Municipal Utility District observed a 15% capacity factor in 2005.[17] However, according to the SolarPACES programme of the International Energy Agency (IEA), solar power plants designed for solar-only generation are well matched to summer noon peak loads in areas with significant cooling demands, such as Spain or the south-western United States,[18] although in some locations solar PV does not reduce the need for generation of network upgrades given that air conditioner peak demand often occurs in the late afternoon or early evening when solar output is reduced.[19][20] SolarPACES states that by using thermal energy storage systems the operating periods of solar thermal power (CSP) stations can be extended to become dispatchable (load following).[18]
Geothermal has a higher capacity factor than many other power sources, and geothermal resources are generally available all the time.
Capacity factors by energy source
Worldwide
Nuclear power 88.7% (2006–2012 average of US's plants).[21]
Hydroelectricity, worldwide average 44%,[22] range of 10–99% depending on water availability (with or without regulation via storage dam).
This page is based on this Wikipedia article Text is available under the CC BY-SA 4.0 license; additional terms may apply. Images, videos and audio are available under their respective licenses.