Economy of Austria

Last updated

Economy of Austria
Vienna Skyline.jpg
Currency Euro (EUR, €)
Calendar year
Trade organisations
EU, WTO, OECD
Country group
Statistics
PopulationIncrease2.svg 8,901,064 (1 January 2020) [3]
GDP
  • Increase2.svg $613 billion (nominal, 2023) [4]
  • Increase2.svg $700 billion (PPP, 2023) [4]
GDP rank
GDP growth
  • Increase2.svg 5.0% (2022) [5]
  • Increase2.svg 0.4% (2023f) [5]
  • Increase2.svg 1.1% (2024f) [5]
GDP per capita
  • Increase2.svg $56,802 (nominal, 2023) [4]
  • Increase2.svg $69,502 (PPP, 2023) [4]
GDP per capita rank
GDP by sector
Population below poverty line
Decrease Positive.svg 16.9% at risk of poverty or social exclusion (AROPE, 2019) [7]
Increase Negative.svg 27.5 low (2019, Eurostat) [8]
Labour force
  • Decrease2.svg 4,559,603 (2019) [11]
  • Increase2.svg 76.2% employment rate (Target: 77%; 2018) [12]
Labour force by occupation
Unemployment
  • Decrease Positive.svg 5.0% (August 2020) [13]
  • Decrease Positive.svg 10.3% youth unemployment (15 to 24 year-olds; July 2020) [14]
Average gross salary
€3,050 monthly (2021) [15]
€2,224 monthly (2021) [15]
Main industries
construction, machinery, vehicles and parts, food, metals, chemicals, lumber and paper, electronics, tourism
Decrease2.svg 27th (very easy, 2020) [16]
External
ExportsIncrease2.svg $156.7 billion (2017 est.) [6]
Export goods
machinery and equipment, motor vehicles and parts, manufactured goods, chemicals, iron and steel, foodstuffs
Main export partners
ImportsIncrease2.svg $158.1 billion (2017 est.) [6]
Import goods
machinery and equipment, motor vehicles, chemicals, metal goods, oil and oil products, natural gas; foodstuffs
Main import partners
FDI stock
  • Increase2.svg $294.1 billion (31 December 2017 est.) [6]
  • Increase2.svg Abroad: $339.7 billion (31 December 2017 est.) [6]
Decrease2.svg $7.859 billion (2017 est.) [6]
Decrease Positive.svg $630.8 billion (31 December 2017) [6]
Public finances
  • Decrease Positive.svg 70.4% of GDP (2019) [17]
  • Decrease Positive.svg €280.426 billion (2019) [17]
  • €2.9 billion surplus (2019) [17]
  • +0.7% of GDP (2019) [17]
Revenues49.0% of GDP (2019) [17]
Expenses48.2% of GDP (2019) [17]
Economic aid
  • Scope: [20]
  • AAA
  • Outlook: Negative
Decrease2.svg $21.57 billion (31 December 1937 est.) [6]

All values, unless otherwise stated, are in US dollars.

The economy of Austria is a highly developed social market economy, with the country being one of the fourteen richest in the world in terms of GDP (gross domestic product) per capita. [21] Until the 1980s, many of Austria's largest industry firms were nationalised. In recent years, privatisation has reduced state holdings to a level comparable to other European economies.

Contents

Labour movements are particularly strong in Austria, and they have a large influence on labour politics. Next to a highly developed industry, international tourism is the most important part of the national economy. The economy of Austria's average GDP is 13th growth in OECD countries, from 1992 to 2017. In Austria, 1.37% over average population growth is the strong factor.

Germany has historically been the main trading partner of Austria, making the Austrian economy vulnerable to rapid changes in the German economy. However, since Austria became a member state of the European Union, it has gained closer ties to other European Union economies. This development reduced its economic dependence on Germany. In addition, Austria's membership in the EU has drawn an influx of foreign investors.

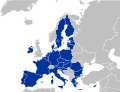
They were attracted by Austria's access to the European Single Market and the country's proximity to the aspiring economies of the European Union. Growth in GDP has accelerated in recent years, and reached 3.3% in 2006. [22]

In 2023 Austria has a very high, $56,802 nominal GDP per capita ranked 12th. [4]

Vienna was ranked the fifth richest NUTS-2 region within Europe (see Economy of the European Union), with its GDP reaching €38,632 per capita. It was trailing behind Inner London, Luxembourg, the Brussels-Capital Region and Hamburg. [23]

Growth had been steady between 2002 and 2006, varying between 1 and 3.3%. [24] After hitting 0% in 2013, growth had picked up a little. As of 2016, growth was set at 1.5%. [25]

History

Foundation and Interbellum

First Austrian Republic, founded as a result of the dissolution of Austria-Hungary, inherited an economy battered by the ravages of the First World War, namely:

A number of international relief schemes failed to garner enough support [28] while a report by Sir William Goode argued that the Austrian economy would collapse without swift foreign intervention. [27] As such, the Austrian economic crisis stretched into its second year, with inflation running at 99%. [26]

League of Nations Bailout

Source: [28]

With annual inflation running at 2,877%, [26] the League of Nations was officially appointed to organise an Austrian reconstruction plan in August 1922. The League scheme was based on the view that Austrian troubles as a result of an inability to pay for necessities and obtain credit, and therefore, an Austrian financial revival was critical to Austrian survival. To this end, the plan was focused solely on financial reconstruction. Austria would receive loans raised from international money markets and the Austrian public, which would be secured on customs and tobacco taxes. In exchange, Austria would in effect lose sovereignty over its economy, agreeing to:

  • Relinquish control over the mints to an independent bank, with the aim of returning to the gold standard.
  • Terminate the printing of money by the central bank.
  • Eliminate the budget deficit (requiring the implementation of austerity measures and monetary control).

The measures took effect in 1923. Short-term effects were impressive; during the announcement to undertake Austrian reconstruction in August 1922, public confidence soared. Foreign currency holdings were converted back into krone, stabilising the currency. This allowed the Austrian Foreign Exchange Agency to finally intervene to fix the krone to the dollar, something that the wild gyrations of the past had not permitted. Capital rushed back into Austria, and domestic prices stabilised, pronouncing the end of hyperinflation. [29]

The steam ran out shortly after implementation. Growth averaged 0.35% per annum until 1929, [28] unemployment leapt five-fold, [30] bankruptcies increased 41-fold, [31] and the trade deficit doubled. [32]

Anschluss

Austria was annexed by Nazi Germany in 1938, and consequently lost control of its own economic policy until the formation of the Second Republic in 1945.

Post World War II

Ever since the end of the World War II, Austria has achieved sustained economic growth. In the soaring 1950s, the rebuilding efforts for Austria lead to an average annual growth rate of more than 5% in real terms and averaged about four-point five percent through most of the 1960s. [33] Following moderate real GDP growth of 1.7%, 2% and 1.2%, respectively, in 1995, 1996, and 1997, the economy rebounded and with real GDP expansion of 2.9 percent in 1998 and 2.2% in 1999.

Austria became a member of the EU on 1 January 1995. [34] Membership brought economic benefits and challenges and has drawn an influx of foreign investors attracted by Austria's access to the single European market. Austria also has made progress in generally increasing its international competitiveness. As a member of the economic and monetary union of the European Union (EMU), Austria's economy is closely integrated with other EU member countries, especially with Germany. On 1 January 1999, Austria introduced the new Euro currency for accounting purposes. In January 2002, Euro notes and coins were introduced, replacing those of the Austrian schilling.

Currency

In 1999, Austria introduced the single European currency, the euro. With 18 other EU member states it forms the Eurozone. Euro banknotes 2002.png
In 1999, Austria introduced the single European currency, the euro. With 18 other EU member states it forms the Eurozone.

In Austria, Euros appear as 1999, however all Austrian euro coins introduced in 2002 have this year on it; unlike other countries of the Eurozone where mint year is minted in the coin. Eight different designs, one per face value, were selected for the Austrian coins. In 2007, in order to adopt the new common map like the rest of the Eurozone countries, Austria changed the common side of its coins.

Before adopting the Euro in 2002 Austria had maintained use of the Austrian schilling which was first established in December 1924. The Schilling was abolished in the wake of the Anschluss in 1938 and has been reintroduced after the end of the World War II in November 1945.

Austria has one of the richest collection of collectors' coins in the Eurozone, with face value ranging from 10 to 100 euro (although a 100,000 euro coin was exceptionally minted in 2004). These coins are a legacy of an old national practice of minting of silver and gold coins. Unlike normal issues, these coins are not legal tender in all the eurozone. For instance, a €5 Austrian commemorative coin cannot be used in any other country.

Privatisation, state participation and labour movements

Many of the country's largest firms were nationalised in the early post-war period to protect them from Soviet takeover as war reparations. For many years, the government and its state-owned industries conglomerate played a very important role in the Austrian economy. However, starting in the early 1990s, the group was broken apart, state-owned firms started to operate largely as private businesses, and a great number of these firms were wholly or partially privatised. The government still operates some firms, state monopolies, utilities, and services. In the aftermath of the financial crisis of 2007–2008 two banks were nationalised. Since 2019 the Österreichische Industrieholding (ÖBAG) administers the investments of the Republic of Austria in partially or entirely nationalized companies, but came under strong criticism after leaked messages showed how Thomas Schmidt had a say in the appointment of the supervisory board and became sole director. Austria enjoys well-developed industry, banking, transportation, services, and commercial facilities.

Austria has a strong labour movement. The Austrian Trade Union Federation (ÖGB) comprises constituent unions with a total membership of about 1.5 million—more than half the country's wage and salary earners. Since 1945, the ÖGB has pursued a moderate, consensus-oriented wage policy, cooperating with industry, agriculture, and the government on a broad range of social and economic issues in what is known as Austria's "social partnership". The ÖGB has often opposed the Schüssel government's programme for budget consolidation, social reform, and improving the business climate, and indications are rising that Austria's peaceful social climate could become more confrontational.

Agriculture, industry and services

Cows near top of mountain Schneeberg Schneeberg - cows-cropped.jpg
Cows near top of mountain Schneeberg

Austrian farms, like those of other west European mountainous countries, are small and fragmented, and production is relatively expensive. Since Austria's becoming a member of the EU in 1995, the Austrian agricultural sector has been undergoing substantial reform under the EU's Common Agricultural Policy (CAP). Although Austrian farmers provide about 80% of domestic food requirements, the agricultural contribution to gross domestic product (GDP) has declined since 1950 to less than 3%.

Although some industries are global competitors, such as several iron and steel works, chemical plants and oil corporations that are large industrial enterprises employing thousands of people, most industrial and commercial enterprises in Austria are relatively small on an international scale.

Kitzbuhel, one of Austria's famous winter tourist cities Kitzbuhel by night.jpg
Kitzbühel, one of Austria's famous winter tourist cities

Most important for Austria is the service sector generating the vast majority of Austria's GDP. Vienna has grown into a finance and consulting metropole and has established itself as the door to the East within the last decades. Viennese law firms and banks are among the leading corporations in business with the new EU member states. Tourism is very important for Austria's economy, accounting for around 10 percent of Austria's GDP. [35] In 2001, Austria was the tenth most visited country in the world with over 18.2 million tourists. Previously, dependency on German guests made this sector of the Austrian economy very dependent on German economy. However recent developments have brought a change, especially since winter ski resorts such as Arlberg or Kitzbühel are now more and more frequented by Eastern Europeans, Russians and Americans.

Austria produced in 2018:

In addition to smaller productions of other agricultural products. [36]

Health care services

Austrian health care spending for 1970 to 2007 compared with other nations Health care cost rise.svg
Austrian health care spending for 1970 to 2007 compared with other nations

Austria's health care system was developed alongside other social welfare programmes by the social democrats in Vienna initially. [37]

Trade position

Trade with other EU countries accounts for almost 66% of Austrian imports and exports. Expanding trade and investment in the emerging markets of central and eastern Europe is a major element of Austrian economic activity. Trade with these countries accounts for almost 14% of Austrian imports and exports, [38] and Austrian firms have sizable investments in and continue to move labour-intensive, low-tech production to these countries. Although the big investment boom has waned, Austria still has the potential to attract EU firms seeking convenient access to these developing markets.

Mergers and acquisitions

The mergers and acquisitions (M&A) landscape in Austria has witnessed significant activity, with companies and investors from the country actively engaging in such transactions. Since 1991, more than 7,183 M&A deals have been announced, amounting to a known total value of 261.6 billion EUR. In 2017 alone, there were over 245 deals with a combined value exceeding 12.9 billion EUR.

Austrian companies have not only been involved in domestic M&A transactions but have also emerged as important investors in cross-border M&A ventures. Among the countries where Austrian companies have been active in M&A, Germany stands out as a particularly crucial partner. To date, Austrian parent companies have acquired 854 German companies in outbound M&A deals, highlighting the strong bilateral ties between the two nations.

When analyzing the industries that have witnessed the most M&A activity in Austria, the financial sector emerges as a prominent player in terms of transaction value. The financial industry has been the focus of significant M&A deals, with companies in this sector exploring opportunities to strengthen their market positions, expand their product portfolios, and enhance their capabilities.

On the other hand, when considering the number of transactions, the Industrials sector takes the lead, representing approximately 19.2% of the total M&A deals in Austria. This sector encompasses a wide range of industries, including manufacturing, engineering, construction, and transportation, among others. The strong presence of M&A activity in the Industrials sector signifies the ongoing interest in consolidating businesses, driving synergies, and fostering growth through strategic partnerships and acquisitions.

The M&A landscape in Austria continues to evolve, influenced by various factors such as market dynamics, economic conditions, and global trends. As companies seek opportunities for expansion, diversification, and innovation, M&A transactions will remain a strategic tool for achieving their business objectives. The financial sector and the Industrials sector are likely to remain at the forefront of M&A activity, demonstrating the vibrancy and potential for further growth in these industries.

Data

The following table shows the main economic indicators in 1980–2021 (with IMF staff estimtates in 2022–2027). Inflation under 5% is in green. [39]

YearGDP

(in Bil. US$PPP)

GDP per capita

(in US$ PPP)

GDP

(in Bil. US$nominal)

GDP per capita

(in US$ nominal)

GDP growth

(real)

Inflation rate

(in %)

Unemployment

(in %)

Government debt

(in % of GDP)

198084.711,227.080.910,732.0Increase2.svg2.3%Increase Negative.svg6.3%1.6%n/a
1981Increase2.svg92.6Increase2.svg12,252.3Decrease2.svg70.1Decrease2.svg9,280.7Decrease2.svg-0.1%Increase Negative.svg6.8%Increase Negative.svg2.2%n/a
1982Increase2.svg100.2Increase2.svg13,241.0Steady2.svg70.1Decrease2.svg9,267.7Increase2.svg1.9%Increase Negative.svg5.4%Increase Negative.svg3.1%n/a
1983Increase2.svg107.0Increase2.svg14,187.1Increase2.svg71.0Increase2.svg9,417.2Increase2.svg2.8%Increase2.svg3.3%Increase Negative.svg3.7%n/a
1984Increase2.svg111.2Increase2.svg14,746.3Decrease2.svg67.0Decrease2.svg8,882.6Increase2.svg0.3%Increase Negative.svg5.7%Increase Negative.svg3.8%n/a
1985Increase2.svg117.3Increase2.svg15,543.4Increase2.svg68.6Increase2.svg9,090.8Increase2.svg2.2%Increase2.svg3.2%Decrease Positive.svg3.6%n/a
1986Increase2.svg122.5Increase2.svg16,210.5Increase2.svg97.4Increase2.svg12,886.1Increase2.svg2.3%Increase2.svg1.7%Decrease Positive.svg3.1%n/a
1987Increase2.svg127.6Increase2.svg16,868.1Increase2.svg121.8Increase2.svg16,093.0Increase2.svg1.7%Increase2.svg1.4%Increase Negative.svg3.8%n/a
1988Increase2.svg133.4Increase2.svg17,608.3Increase2.svg133.6Increase2.svg17,632.8Increase2.svg1.0%Increase2.svg1.9%Decrease Positive.svg2.7%57.4%
1989Increase2.svg144.0Increase2.svg18,965.1Decrease2.svg133.3Decrease2.svg17,547.8Increase2.svg3.9%Increase2.svg2.2%Decrease Positive.svg2.3%Decrease Positive.svg56.3%
1990Increase2.svg155.9Increase2.svg20,394.2Increase2.svg166.9Increase2.svg21,827.4Increase2.svg4.3%Increase2.svg2.8%Increase Negative.svg2.7%Decrease Positive.svg55.9%
1991Increase2.svg166.7Increase2.svg21,622.6Increase2.svg174.4Increase2.svg22,621.9Increase2.svg3.4%Increase2.svg3.1%Increase Negative.svg3.2%Increase Negative.svg56.1%
1992Increase2.svg174.1Increase2.svg22,323.6Increase2.svg195.5Increase2.svg25,068.4Increase2.svg2.1%Increase2.svg3.4%Increase Negative.svg3.3%Decrease Positive.svg56.0%
1993Increase2.svg179.2Increase2.svg22,729.4Decrease2.svg190.4Decrease2.svg24,152.7Increase2.svg0.5%Increase2.svg3.2%Increase Negative.svg4.0%Increase Negative.svg60.6%
1994Increase2.svg187.4Increase2.svg23,634.1Increase2.svg204.0Increase2.svg25,725.6Increase2.svg2.4%Increase2.svg2.7%Decrease Positive.svg3.9%Increase Negative.svg63.7%
1995Increase2.svg196.4Increase2.svg24,712.4Increase2.svg241.2Increase2.svg30,350.5Increase2.svg2.7%Increase2.svg1.6%Increase Negative.svg4.2%Increase Negative.svg67.9%
1996Increase2.svg204.8Increase2.svg25,733.6Decrease2.svg237.3Decrease2.svg29,820.6Increase2.svg2.4%Increase2.svg1.8%Increase Negative.svg4.7%Decrease Positive.svg67.8%
1997Increase2.svg212.7Increase2.svg26,695.1Decrease2.svg213.0Decrease2.svg26,737.5Increase2.svg2.1%Increase2.svg1.2%Increase Negative.svg4.8%Decrease Positive.svg63.1%
1998Increase2.svg222.8Increase2.svg27,931.7Increase2.svg218.6Increase2.svg27,399.1Increase2.svg3.6%Increase2.svg0.8%Decrease Positive.svg4.7%Increase Negative.svg68.8%
1999Increase2.svg234.0Increase2.svg29,275.7Decrease2.svg217.5Decrease2.svg27,210.5Increase2.svg3.6%Increase2.svg0.5%Decrease Positive.svg4.1%Decrease Positive.svg61.1%
2000Increase2.svg247.4Increase2.svg30,875.2Decrease2.svg197.4Decrease2.svg24,636.5Increase2.svg3.4%Increase2.svg2.0%Decrease Positive.svg3.9%Increase Negative.svg65.7%
2001Increase2.svg256.1Increase2.svg31,848.8Increase2.svg197.5Decrease2.svg24,558.9Increase2.svg1.3%Increase2.svg2.3%Increase Negative.svg4.0%Increase Negative.svg66.4%
2002Increase2.svg264.4Increase2.svg32,717.3Increase2.svg214.2Increase2.svg26,508.3Increase2.svg1.7%Increase2.svg1.7%Increase Negative.svg4.4%Increase Negative.svg67.0%
2003Increase2.svg272.2Increase2.svg33,527.3Increase2.svg262.2Increase2.svg32,298.6Increase2.svg0.9%Increase2.svg1.3%Increase Negative.svg4.8%Decrease Positive.svg64.9%
2004Increase2.svg287.1Increase2.svg35,147.3Increase2.svg301.3Increase2.svg36,883.9Increase2.svg2.7%Increase2.svg2.0%Increase Negative.svg5.9%Decrease Positive.svg64.8%
2005Increase2.svg302.8Increase2.svg36,811.3Increase2.svg316.3Increase2.svg38,450.6Increase2.svg2.2%Increase2.svg2.1%Increase Negative.svg6.0%Increase Negative.svg68.3%
2006Increase2.svg322.9Increase2.svg39,055.3Increase2.svg336.3Increase2.svg40,674.9Increase2.svg3.5%Increase2.svg1.7%Decrease Positive.svg5.6%Decrease Positive.svg67.0%
2007Increase2.svg344.0Increase2.svg41,469.2Increase2.svg389.2Increase2.svg46,922.6Increase2.svg3.7%Increase2.svg2.2%Decrease Positive.svg5.2%Decrease Positive.svg64.7%
2008Increase2.svg355.7Increase2.svg42,745.9Increase2.svg432.0Increase2.svg51,914.0Increase2.svg1.5%Increase2.svg3.2%Decrease Positive.svg4.4%Increase Negative.svg68.4%
2009Decrease2.svg344.5Decrease2.svg41,301.4Decrease2.svg401.3Decrease2.svg48,111.7Decrease2.svg-3.8%Increase2.svg0.4%Increase Negative.svg5.7%Increase Negative.svg79.6%
2010Increase2.svg355.1Increase2.svg42,466.0Decrease2.svg392.6Decrease2.svg46,955.2Increase2.svg1.8%Increase2.svg1.7%Decrease Positive.svg5.2%Increase Negative.svg82.4%
2011Increase2.svg373.0Increase2.svg44,469.2Increase2.svg431.6Increase2.svg51,452.3Increase2.svg2.9%Increase2.svg3.5%Decrease Positive.svg4.9%Decrease Positive.svg82.2%
2012Increase2.svg391.6Increase2.svg46,477.7Decrease2.svg409.7Decrease2.svg48,616.9Increase2.svg0.7%Increase2.svg2.6%Increase Negative.svg5.2%Decrease Positive.svg81.7%
2013Increase2.svg406.4Increase2.svg47,936.7Increase2.svg430.2Increase2.svg50,747.4Increase2.svg0.0%Increase2.svg2.1%Increase Negative.svg5.4%Decrease Positive.svg81.0%
2014Increase2.svg417.1Increase2.svg48,813.5Increase2.svg442.7Increase2.svg51,814.4Increase2.svg0.7%Increase2.svg1.5%Increase Negative.svg6.1%Increase Negative.svg83.8%
2015Increase2.svg431.1Increase2.svg49,955.5Decrease2.svg382.0Decrease2.svg44,267.8Increase2.svg1.0%Increase2.svg0.8%Increase Negative.svg6.2%Increase Negative.svg84.4%
2016Increase2.svg460.2Increase2.svg52,659.8Increase2.svg395.7Increase2.svg45,278.8Increase2.svg2.0%Increase2.svg1.0%Increase Negative.svg6.5%Decrease Positive.svg82.5%
2017Increase2.svg479.5Increase2.svg54,393.6Increase2.svg417.1Increase2.svg47,320.5Increase2.svg2.3%Increase2.svg2.2%Decrease Positive.svg5.9%Decrease Positive.svg78.6%
2018Increase2.svg503.2Increase2.svg56,636.7Increase2.svg455.4Increase2.svg51,254.4Increase2.svg2.5%Increase2.svg2.1%Decrease Positive.svg5.2%Decrease Positive.svg74.0%
2019Increase2.svg519.8Increase2.svg58,679.9Decrease2.svg445.1Decrease2.svg50,239.4Increase2.svg1.5%Increase2.svg1.5%Decrease Positive.svg4.8%Decrease Positive.svg70.6%
2020Decrease2.svg490.7Decrease2.svg55,125.0Decrease2.svg432.9Decrease2.svg48,636.3Decrease2.svg-6.7%Increase2.svg1.4%Increase Negative.svg5.4%Increase Negative.svg83.2%
2021Increase2.svg534.0Increase2.svg59,692.1Increase2.svg477.4Increase2.svg53,367.5Increase2.svg4.5%Increase2.svg2.8%Increase Negative.svg6.2%Decrease Positive.svg83.1%
2022Increase2.svg582.1Increase2.svg64,751.1Increase2.svg479.8Increase2.svg53,370.7Increase2.svg2.6%Increase Negative.svg5.6%Decrease Positive.svg5.2%Decrease Positive.svg80.7%
2023Increase2.svg617.6Increase2.svg68,354.0Increase2.svg518.8Increase2.svg57,420.9Increase2.svg3.0%Increase2.svg2.2%Decrease Positive.svg4.9%Decrease Positive.svg76.6%
2024Increase2.svg647.3Increase2.svg71,291.0Increase2.svg550.6Increase2.svg60,630.9Increase2.svg2.3%Increase2.svg2.0%Decrease Positive.svg4.8%Decrease Positive.svg74.6%
2025Increase2.svg673.2Increase2.svg73,765.9Increase2.svg578.1Increase2.svg63,343.8Increase2.svg1.9%Increase2.svg2.0%Steady2.svg4.8%Decrease Positive.svg73.0%
2026Increase2.svg698.8Increase2.svg76,190.1Increase2.svg605.4Increase2.svg66,009.1Increase2.svg1.8%Increase2.svg2.0%Steady2.svg4.8%Decrease Positive.svg72.4%
2027Increase2.svg725.3Increase2.svg78,691.9Increase2.svg630.5Increase2.svg68,407.3Increase2.svg1.8%Increase2.svg2.0%Steady2.svg4.8%Decrease Positive.svg70.4%

Companies

In 2022, the sector with the highest number of companies registered in Austria is Services with 97,733 companies followed by Finance, Insurance, and Real Estate and Retail Trade with 70,696 and 59,942 companies respectively. [40]

See also

Related Research Articles

<span class="mw-page-title-main">Economy of Bulgaria</span>

The economy of Bulgaria functions on the principles of the free market, having a large private sector and a smaller public one. Bulgaria is an industrialised high-income country according to the World Bank, and is a member of the European Union (EU), the World Trade Organization (WTO), the Organization for Security and Co-operation in Europe (OSCE) and the Organization of the Black Sea Economic Cooperation (BSEC). The Bulgarian economy has experienced significant growth (538%), starting from $13.15 billion and reaching estimated gross domestic product (GDP) of $86 billion or $203 billion, GDP per capita of $31,148, average gross monthly salary of 2,009 leva, and average net monthly salary of $2,102 (2022). The national currency is the lev, pegged to the euro at a rate of 1.95583 leva for 1 euro. The lev is the strongest and most stable currency in Eastern Europe.

<span class="mw-page-title-main">Economy of Croatia</span>

The economy of Croatia is a developed social market economy. It is the largest national economy in Southeast Europe by nominal gross domestic product (GDP). It is an open economy with accommodative foreign policy, highly dependent on international trade in Europe. Within Croatia, economic development varies among its counties, with strongest growth in Central Croatia and its financial centre, Zagreb. It has a very high level of human development, low levels of wealth inequality, and a high standard of living. Croatia's labor market has been perennially inefficient, with inconsistent business standards as well as ineffective corporate and income tax policy.

<span class="mw-page-title-main">Economy of Cyprus</span>

The economy of Cyprus is a high-income economy as classified by the World Bank, and was included by the International Monetary Fund in its list of advanced economies in 2001. Cyprus adopted the euro as its official currency on 1 January 2008, replacing the Cypriot pound at an irrevocable fixed exchange rate of CYP 0.585274 per €1.

<span class="mw-page-title-main">Economy of the Czech Republic</span>

The economy of the Czech Republic is a developed export-oriented social market economy based in services, manufacturing, and innovation that maintains a high-income welfare state and the European social model. The Czech Republic participates in the European Single Market as a member of the European Union, and is therefore a part of the economy of the European Union. It uses its own currency, the Czech koruna, instead of the euro. It is a member of the Organisation for Economic Co-operation and Development (OECD). The Czech Republic ranks 16th in inequality-adjusted human development and 24th in World Bank Human Capital Index, ahead of countries such as the United States, the United Kingdom or France. It was described by The Guardian as "one of Europe's most flourishing economies".

<span class="mw-page-title-main">Economy of Estonia</span>

The economy of Estonia is an advanced economy and the country is a member of the European Union and the eurozone. Estonia's economy is heavily influenced by developments in the Finnish and Swedish economies.

<span class="mw-page-title-main">Euro</span> Currency of most countries in the European Union

The euro is the official currency of 20 of the 27 member states of the European Union. This group of states is officially known as the euro area or, commonly, the eurozone, and includes about 344 million citizens as of 2023. The euro is divided into 100 euro cents.

<span class="mw-page-title-main">Economy of Greece</span>

The economy of Greece is the 53rd largest in the world, with a nominal gross domestic product (GDP) of $242.385 billion per annum. In terms of purchasing power parity, Greece is the world's 54th largest economy, at $416.969 billion per annum. As of 2022, Greece is the sixteenth-largest economy in the European Union. According to the International Monetary Fund's figures for 2023, Greece's GDP per capita is $23,173 at nominal value and $39,864 at purchasing power parity.

<span class="mw-page-title-main">Economy of Hungary</span>

The economy of Hungary is a high-income mixed economy, ranked as the 9th most complex economy according to the Economic Complexity Index. Hungary is a member of the Organisation for Economic Co-operation and Development (OECD) with a very high human development index and a skilled labour force, with the 22nd lowest income inequality by Gini index in the world. The Hungarian economy is the 53rd-largest economy in the world with $265.037 billion annual output, and ranks 41st in the world in terms of GDP per capita measured by purchasing power parity. Hungary has an export-oriented market economy with a heavy emphasis on foreign trade; thus the country is the 35th largest export economy in the world. The country had more than $100 billion of exports in 2015, with a high trade surplus of $9.003 billion, of which 79% went to the European Union (EU) and 21% was extra-EU trade. Hungary's productive capacity is more than 80% privately owned, with 39.1% overall taxation, which funds the country's welfare economy. On the expenditure side, household consumption is the main component of GDP and accounts for 50% of its total, followed by gross fixed capital formation with 22% and government expenditure with 20%.

<span class="mw-page-title-main">Economy of Latvia</span>

The economy of Latvia is an open economy in Europe and is part of the European Single Market. Latvia is a member of the World Trade Organization (WTO) since 1999, a member of the European Union since 2004, a member of the Eurozone since 2014 and a member of the OECD since 2016. Latvia is ranked the 14th in the world by the Ease of Doing Business Index prepared by the World Bank Group. According to the Human Development Report 2011, Latvia belongs to the group of very high human development countries. Due to its geographical location, transit services are highly developed, along with timber and wood processing, agriculture and food products, and manufacturing of machinery and electronic devices.

<span class="mw-page-title-main">Economy of North Macedonia</span>

The economy of North Macedonia has become more liberalized, with an improved business environment, since its independence from Yugoslavia in 1991, which deprived the country of its key protected markets and the large transfer payments from Belgrade. Prior to independence, North Macedonia was Yugoslavia's poorest republic. An absence of infrastructure, United Nations sanctions on its largest market, and a Greek economic embargo hindered economic growth until 1996.

<span class="mw-page-title-main">Economy of Romania</span>

The economy of Romania is a complex high-income economy with a skilled labour force, ranked 12th in the European Union by total nominal GDP and 7th largest when adjusted by purchasing power parity. The World Bank notes that Romania's efforts are focused on accelerating structural reforms and strengthening institutions in order to further converge with the European Union. The country's economic growth has been one of the highest in the EU since 2010, with 2022 seeing a better-than-expected 4.8% increase.

<span class="mw-page-title-main">Economy of San Marino</span>

The economy of San Marino is a developed free-market economy focused on industries such as tourism, banking, and the manufacture of ceramics, clothing, fabrics, furniture, paints, spirits, tiles, and wine. Taken together, the manufacturing and financial sector make up more than half of the national GDP. The primary sector contribution to the GDP of the country is marginal, with the main agricultural products being wine and cheeses. In addition, San Marino sells collectible postage stamps to philatelists.

<span class="mw-page-title-main">Economy of Slovakia</span>

The economy of Slovakia is based upon Slovakia becoming an EU member state in 2004, and adopting the euro at the beginning of 2009. Its capital, Bratislava, is the largest financial centre in Slovakia. As of Q1 2018, the unemployment rate was 5.72%.

<span class="mw-page-title-main">Economy of Slovenia</span>

The economy of Slovenia is a developed economy, and the country enjoys a high level of prosperity and stability as well as above-average GDP per capita by purchasing power parity at 92% of the EU average in 2022. The nominal GDP in 2023 is 68.108 billion USD, nominal GDP per capita (GDP/pc) in 2023 is USD 32,214. The highest GDP/pc is in central Slovenia, where the capital city Ljubljana is located. It is part of the Western Slovenia statistical region, which has a higher GDP/pc than eastern Slovenia.

<span class="mw-page-title-main">Economy of the Netherlands</span>

The economy of the Netherlands is a highly developed market economy focused on Trade and Logistics, Manufacturing, Services, Innovation and Technology and Sustainable and Renewable Energy. It is the world's 18th largest economy by nominal GDP and the 28th largest by purchasing power parity (PPP) and is the fifth largest economy in European Union by nominal GDP. It has the world's 11th highest per capita GDP (nominal) and the 13th highest per capita GDP (PPP) as of 2023 making it one of the highest earning nations in the world. Many of the world's largest tech companies are based in its capital Amsterdam or have established their European headquarters in the city, such as IBM, Microsoft, Google, Oracle, Cisco, Uber, Netflix and Tesla. Its second largest city Rotterdam is a major trade, logistics and economic center of the world and is Europe's largest seaport. Netherlands is ranked fifth on global innovation index and fourth on the Global Competitiveness Report.

<span class="mw-page-title-main">Economy of Belgium</span>

The economy of Belgium is a highly developed, high-income, mixed economy.

<span class="mw-page-title-main">Eurozone</span> Area in which the euro is the official currency

The euro area, commonly called the eurozone (EZ), is a currency union of 20 member states of the European Union (EU) that have adopted the euro (€) as their primary currency and sole legal tender, and have thus fully implemented EMU policies.

<span class="mw-page-title-main">Economy of Europe</span>

The economy of Europe comprises about 748 million people in 50 countries. The formation of the European Union (EU) and in 1999 the introduction of a unified currency, the Euro, brought participating European countries closer through the convenience of a shared currency. The European Union is a unique global organisation, an entity forming one of the largest economies in the world. The European Union also “regulates” the global market by the single market. The difference in wealth across Europe can be seen roughly in the former Cold War divide, with some countries breaching the divide. Whilst most European states have a GDP per capita higher than the world's average and are very highly developed, some European economies, despite their position over the world's average in the Human Development Index, are relatively poor. Europe has total banking assets of more than $50 trillion and its Global assets under management has more than $20 trillion.

<span class="mw-page-title-main">Economy of the European Union</span>

The economy of the European Union is the joint economy of the member states of the European Union (EU). It is the second largest economy in the world in nominal terms, after the United States and the third one in purchasing power parity (PPP) terms, after China and the United States. The European Union's GDP estimated to be around $19.35 trillion (nominal) in 2024 representing around one sixth of the global economy. Germany has the biggest national GDP of all EU countries, followed by France and Italy.

<span class="mw-page-title-main">Economy of Lithuania</span>

The economy of Lithuania is the largest economy among the three Baltic states. Lithuania is a member of the European Union and belongs to the group of very high human development countries and is a member of the WTO and OECD.

References

  1. "World Economic Outlook Database, April 2019". IMF.org. International Monetary Fund . Retrieved 29 September 2019.
  2. "World Bank Country and Lending Groups". datahelpdesk.worldbank.org. World Bank . Retrieved 29 September 2019.
  3. "Population on 1 January". ec.europa.eu/eurostat. Eurostat . Retrieved 13 July 2020.
  4. 1 2 3 4 5 "Report for Selected Countries and Subjects: April 2023". imf.org. International Monetary Fund.
  5. 1 2 3 "The outlook is uncertain again amid financial sector turmoil, high inflation, ongoing effects of Russia's invasion of Ukraine, and three years of COVID". International Monetary Fund . 11 April 2023.
  6. 1 2 3 4 5 6 7 8 9 10 11 "The World Factbook". CIA.gov. Central Intelligence Agency . Retrieved 25 March 2019.
  7. "People at risk of poverty or social exclusion". ec.europa.eu. Eurostat . Retrieved 19 June 2020.
  8. "Gini coefficient of equivalised disposable income - EU-SILC survey". ec.europa.eu. Eurostat . Retrieved 19 June 2020.
  9. "Human Development Index (HDI)". hdr.undp.org. HDRO (Human Development Report Office) United Nations Development Programme . Retrieved 17 November 2022.
  10. "Inequality-adjusted HDI (IHDI)". hdr.undp.org. UNDP . Retrieved 17 November 2022.
  11. "Labor force, total - Austria". data.worldbank.org. World Bank . Retrieved 1 November 2019.
  12. "Employment rate by sex, age group 20-64". ec.europa.eu/eurostat. Eurostat . Retrieved 19 June 2019.
  13. "Unemployment by sex and age - monthly average". appsso.eurostat.ec.europa.eu. Eurostat . Retrieved 4 October 2020.
  14. "Unemployment rate by age group". data.oecd.org. OECD . Retrieved 16 September 2020.
  15. 1 2 "Statistik.at". statistik.at. 2023. Retrieved 22 January 2023.
  16. "Ease of Doing Business in Austria". Doingbusiness.org. Retrieved 21 November 2017.
  17. 1 2 3 4 5 6 "Euro area and EU27 government deficit both at 0.6% of GDP" (PDF). ec.europa.eu/eurostat. Eurostat. Retrieved 28 April 2020.
  18. "Archived copy" (PDF). Archived (PDF) from the original on 25 December 2017. Retrieved 25 December 2017.{{cite web}}: CS1 maint: archived copy as title (link)
  19. "Archived copy" (PDF). Archived (PDF) from the original on 20 April 2017. Retrieved 25 December 2017.{{cite web}}: CS1 maint: archived copy as title (link)
  20. "Scope revises Austria's Outlook to Negative from Stable, affirms ratings at AAA". Scope Ratings. Retrieved 7 July 2023.
  21. "Austria". International Monetary Fund. Retrieved 22 April 2009.
  22. Real GDP Growth – Expenditure Side, provided by the Austrian National Bank (in German)
  23. (in English) Regional GDP per inhabitant in the EU27 Archived 26 March 2009 at the Wayback Machine , provided by Eurostat
  24. (in English) Real GDP Growth3 – Expenditure Side, provided by the Austrian National Bank
  25. Austrian Economic Chamber (July 2018). "GDP Growth in Austria" (PDF). Retrieved 14 August 2018.
  26. 1 2 3 4 5 Beer, Christian; Gnan, Ernest; Teresa Valderrama, Maria. "A (not so brief) history of inflation in Austria" (PDF).
  27. 1 2 3 Cottrell, Philip L. (2013), Ziegler, Dieter; Berghoff, Hartmut; Kocka, Jürgen (eds.), "Austrian Reconstruction, 1920–1921: A Matter for Private Business or the League of Nations?", Business in the Age of Extremes: Essays in Modern German and Austrian Economic History, Publications of the German Historical Institute, Cambridge: Cambridge University Press, pp. 59–75, doi:10.1017/cbo9781139061827.005, ISBN   978-1-107-01695-8 , retrieved 23 September 2022
  28. 1 2 3 Warnock, Barbara (2015). "The first bailout : the financial reconstruction of Austria 1922-1926" (PDF).
  29. Parker, Randall; Whaples, Robert. Routledge Handbook of Major Events in Economic History.
  30. The First Report of the Commissioner-General of the League of Nations for Austria, 15 December 1922 – 15 January 1923
  31. van Waldré de Bordes, J. (27 May 1925). Bankruptcies in Austria.
  32. The Fourteenth Report of the Commissioner-General of the League of Nations for Austria, 15 January – 15 February 1924
  33. Nowotny, Ewald (December 2017). "(in German) Die Geschichte des WIFO und der österreichischen Wirtschaftspolitik in der Zweiten Republik". Wifo. Archived from the original on 15 August 2021. Retrieved 15 August 2021.
  34. "Austria in the EU". Austrian Embassy Washington. Archived from the original on 26 October 2021. Retrieved 8 October 2018.
  35. "Trade and Industry in Austria, Exports, Tourism". austria.info. 2007. Archived from the original on 27 November 2007. Retrieved 20 December 2007.
  36. Austria production in 2018, by FAO
  37. Austria. European Observatory on Health Care Systems
  38. "Austria Business Facts". Archived from the original on 20 April 2020.
  39. "Report for Selected Countries and Subjects".
  40. "Industry Breakdown of Companies in Austria". HitHorizons.