It is a developed country, with an economy based on the service (80%) and industrialsectors (16%), and the agricultural sector contributing an estimated 4% of national economic output in 2017.[1] Important Greek industries include tourism and shipping. With 31.3 million international tourists in 2019, Greece was the 7th-most-visited country in the European Union and 13th in the world,[38] marking a steady increase from 18 million tourists in 2013.[39] The Greek Merchant Navy is the largest in the world, with Greek-owned vessels accounting for 21% of global deadweight tonnage as of 2021; the total capacity of the Greek-owned fleet has increased by 45.8% compared to 2014.[40][41] The increased demand for international maritime transportation between Greece and Asia has resulted in unprecedented investment in the shipping industry.[42]
The country is a significant agricultural producer within the EU. Greece has the largest economy in Southeast Europe and is an important regional investor.[43][44] Greece was the largest foreign investor in Albania in 2013,[45] the third in Bulgaria, in the top-three in Romania and Serbia and the most important trading partner and largest foreign investor in North Macedonia.[46][47][48] The Greek telecommunications company OTE has made significant public investment across Southeast Europe.[46]
World War II (1939–1945) devastated the country's economy, but the high levels of economic growth that followed from 1950 to 1980 have been called the Greek economic miracle.[52] From 2000 Greece saw high levels of GDP growth above the Eurozone average, peaking at 5.8% in 2003, 5.4% in 2004 and 6.4% in 2006.[53] The subsequent Great Recession and Greek government-debt crisis, a central focus of the wider euro area crisis, plunged the economy into a sharp downturn, with real GDP growth rates of −4.1% in 2009, −5.7% in 2010, −9.9% in 2011, −8.3% in 2012 and −2.3% in 2013.[53][54] In 2011, the country's government debt reached €356 billion (172% of nominal GDP).[55] After negotiating the biggest debt restructuring in history with the private sector, which sustained losses in the order of €100 billion for private bond investors,[56] Greece reduced its sovereign debt burden to €280 billion (137% of GDP) in the first quarter of 2012.[57] Greece achieved a real GDP growth rate of 0.8% in 2014—after five consecutive years of economic decline—but the economy contracted by 0.2% in 2015 and recorded zero growth in 2016.[54][58] The country returned to modest growth rates of 1.5% in 2017, 2.1% in 2018 and 2.3% in 2019.[54] GDP contracted by 9.2% in 2020 during the global recession caused by the COVID-19 pandemic.[54] However, the economy rebounded by 8.7% in 2021, 5.5% in 2022, 2.1% in 2023 and 2.1% in 2024.[54] On 20 August 2022, Greece formally exited the EU's "enhanced surveillance framework", which had been in place since the conclusion of the third bailout programme exactly four years earlier.[59] On 2 December 2022, Berlin-based credit rating agency Scope assigned a positive outlook to Greece's BB+ rating, presaging the country's return to investment grade.[60] On 31 July 2023, Greece's investment-grade status was restored by Japanese credit rating agency R&I.[61][62] Scope, DBRS, S&P and Fitch followed suit on 4 August,[63][64] 8 September,[65][66] 20 October and 1 December 2023 respectively,[67][68][69] but Moody's delayed doing so until 14 March 2025.[31]The Economist ranked Greece the world's top economic performer for 2022 and 2023, citing significant improvements in five key economic and financial indicators.[70][71]Tourism reached an all-time record in 2023, with approximately 32 million tourists making Greece one of the most visited countries in the world.[72]
This section appears to be slanted towards recent events. Please try to keep recent events in historical perspective and add more content related to non-recent events.(October 2011)
Export of raisin from the port of Patras, late 19th centuryHistorical GDP per capita development
The evolution of the Greek economy during the 19th century (a period that transformed a large part of the world because of the Industrial Revolution) has been little researched. Recent research from 2006[73] examines the gradual development of industry and further development of shipping in a predominantly agricultural economy, calculating an average rate of per capita GDP growth between 1833 and 1911 that was only slightly lower than that of the other Western European nations. Industrial activity, (including heavy industry like shipbuilding) was evident, mainly in Ermoupolis and Piraeus.[74][75] Nonetheless, Greece faced economic hardships and defaulted on its external loans in 1843, 1860 and 1893.[76]
Other studies support the above view on the general trends in the economy, providing comparative measures of standard of living. The per capita income (in purchasing power terms) of Greece was 65% that of France in 1850, 56% in 1890, 62% in 1938,[77][78] 75% in 1980, 90% in 2007, 96.4% in 2008 and 97.9% in 2009.[79][80]
The country's post-World War II development has largely been connected with the Greek economic miracle.[52] During that period, Greece saw growth rates second only to those of Japan, while ranking first in Europe in terms of GDP growth.[52] It is indicative that between 1960 and 1973 the Greek economy grew by an average of 7.7%, in contrast to 4.7% for the EU15 and 4.9% for the OECD.[52] Also during that period, exports grew by an average annual rate of 12.6%.[52]
Strengths and weaknesses
Greece enjoys a high standard of living and very high Human Development Index, being ranked 32nd in the world in 2019.[81] However, the severe recession of recent years saw GDP per capita fall from 94% of the EU average in 2009 to 67% between 2017 and 2019.[82][83] During the same period, Actual Individual Consumption (AIC) per capita fell from 104% to 78% of the EU average.[82][83]
Greece's main industries are tourism, shipping, industrial products, food and tobacco processing, textiles, chemicals, metal products, mining and petroleum. Greece's GDP growth has also, as an average, since the early 1990s been higher than the EU average. However, the Greek economy continues to face significant problems, including high unemployment levels, inefficient public sector bureaucracy, tax evasion, corruption and low global competitiveness.[84][85]
GDP growth rates of the Greek economy between 1961 and 2010
After fourteen consecutive years of economic growth, Greece went into recession in 2008.[89] By the end of 2009, the Greek economy faced the highest budget deficit and government debt-to-GDP ratio in the EU. After several upward revisions, the 2009 budget deficit is now estimated at 15.7% of GDP.[90] This, combined with rapidly rising debt levels (127.9% of GDP in 2009) led to a precipitous increase in borrowing costs, effectively shutting Greece out of the global financial markets and resulting in a severe economic crisis.[91]
Greece was accused of trying to cover up the extent of its massive budget deficit during the 2008 financial crisis.[92] The allegation was prompted by the massive revision of the 2009 budget deficit forecast by the new PASOK government elected in October 2009, from "6–8%" (estimated by the previous New Democracy government) to 12.7% (later revised to 15.7%). However, the accuracy of the revised figures has also been questioned, and in February 2012 the Hellenic Parliament voted in favor of an official investigation following accusations by a former member of the Hellenic Statistical Authority that the deficit had been artificially inflated in order to justify harsher austerity measures.[93][94]
The Greek labor force, which amount around 5 million workers, average 2,032 hours of work per worker annually in 2011, is ranked fourth among OECD countries, after Mexico, South Korea and Chile.[96] The Groningen Growth & Development Centre has published a poll revealing that between 1995 and 2005, Greece was the country whose workers have the most hours/year work among European nations; Greeks worked an average of 1,900 hours per year, followed by Spaniards (average of 1,800 hours/year).[97]
As a result of the ongoing economic crisis, industrial production in the country went down by 8% between March 2010 and March 2011,[98] The volume of building activity saw a reduction of 73% in 2010.[99] Additionally, the turnover in retail sales saw a decline of 9% between February 2010 and February 2011.[100]
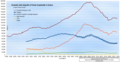
Between 2008 and 2013 unemployment skyrocketed, from a generational low of 7.2% in the second and third quarters of 2008 to a high of 27.9% in June 2013, leaving over a million jobless.[101][102][103] Youth unemployment peaked at 64.9% in May 2013.[104] Unemployment figures have steadily improved in recent years, with the overall rate falling to 7.5% and youth unemployment dropping to 13% in December 2025.[13][15] Male and female unemployment stood at 5.5% and 9.9% in December 2025, the thirteenth- and second-highest in the European Union respectively.[13][15]
Greece was accepted into the Economic and Monetary Union of the European Union by the European Council on 19 June 2000, based on a number of criteria (inflation rate, budget deficit, public debt, long-term interest rates, exchange rate) using 1999 as the reference year. After an audit commissioned by the incoming New Democracy government in 2004, Eurostat revealed that the statistics for the budget deficit had been under-reported.[107] However, even after all corrections that followed, the reference year budget deficit did not exceed the allowable upper limit (3%) according to the Eurostat accounting method in force at the time of application, and thus Greece had still met all critiera for Eurozone entry (details given below).[b]
Most of the differences in the revised budget deficit numbers were due to a temporary change of accounting practices by the new government, i.e., recording expenses when military material was ordered rather than received.[109] However, it was the retroactive application of ESA95 methodology (applied since 2000) by Eurostat, that finally raised the reference year (1999) budget deficit to 3.38% of GDP, thus exceeding the 3% limit. This led to claims that Greece (similar claims have been made about other European countries like Italy)[110] had not actually met all five accession criteria, and the common perception that Greece entered the Eurozone through "falsified" deficit numbers.
In the 2005 OECD report for Greece,[111] it was clearly stated that "the impact of new accounting rules on the fiscal figures for the years 1997 to 1999 ranged from 0.7 to 1 percentage point of GDP; this retroactive change of methodology was responsible for the revised deficit exceeding 3% in 1999, the year of [Greece's] EMU membership qualification". The above led the Greek minister of finance to clarify that the 1999 budget deficit was below the prescribed 3% limit when calculated with the ESA79 methodology in force at the time of Greece's application, and thus the criteria had been met.[112]
The original accounting practice for military expenses was later restored in line with Eurostat recommendations, theoretically lowering even the ESA95-calculated 1999 Greek budget deficit to below 3% (an official Eurostat calculation is still pending for 1999).
An error sometimes made is the confusion of discussion regarding Greece's Eurozone entry with the controversy regarding usage of derivatives' deals with U.S. Banks by Greece and other Eurozone countries to artificially reduce their reported budget deficits. A currency swap arranged with Goldman Sachs allowed Greece to "hide" 2.8 billion Euros of debt, however, this affected deficit values after 2001 (when Greece had already been admitted into the Eurozone) and is not related to Greece's Eurozone entry.[113]
A study of the period 1999–2009 by forensic accountants has found that data submitted to Eurostat by Greece, among other countries, had a statistical distribution indicative of manipulation; "Greece with a mean value of 17.74, shows the largest deviation from Benford's law among the members of the eurozone, followed by Belgium with a value of 17.21 and Austria with a value of 15.25".[114][115]
Greece's debt percentage since 1977, compared to the average of the Eurozone
Historical Debt
Greece, like other European nations, had faced debt crises in the 19th century, as well as a similar crisis in 1932 during the Great Depression. In general, however, during the 20th century it enjoyed one of the highest GDP growth rates on the planet [116] (for a quarter century from the early 1950s to mid 1970s, second in the world after Japan). Average Greek government debt-to-GDP for the entire century before the crisis (1909–2008) was lower than that for the UK, Canada, or France,[105][106] while for the 30-year period (1952–1981) until entrance into the European Economic Community, the Greek government debt-to-GDP ratio averaged only 19.8%.[106]
Between 1981 and 1993 Greece's government debt-to-GDP ratio steadily rose, surpassing the average of what is today the Eurozone in the mid-1980s (see chart right). For the next 15 years, from 1993 to 2007 (i.e., before the 2008 financial crisis), Greece's government debt-to-GDP ratio remained roughly unchanged (the value was not affected by the 2004 Athens Olympics), averaging 102%[106][117] - a value lower than that for Italy (107%) and Belgium (110%) during the same 15-year period,[106] and comparable to that for the U.S. or the OECD average in 2017.
During the latter period, the country's annual budget deficit usually exceeded 3% of GDP, but its effect on the debt-to-GDP ratio was counterbalanced by high GDP growth rates. The debt-to-GDP values for 2006 and 2007 (about 105%) were established after audits resulted in corrections according to Eurostat methodology, of up to 10 percentage points for the particular years (as well as similar corrections for the years 2008 and 2009). These corrections, although altering the debt level by a maximum of about 10%, resulted in a popular notion that "Greece was previously hiding its debt".
Evolution of the debt crisis
The Greek crisis was triggered by the turmoil of the Great Recession, which led the budget deficits of several Western nations to reach or exceed 10% of GDP.[105] In Greece's case, the high budget deficit (which, after several corrections, was revealed that it had been allowed to reach 10.2% and 15.1% of GDP in 2008 and 2009, respectively) was coupled with a high public debt to GDP ratio (which, until then, was relatively stable for several years, at just above 100% of GDP - as calculated after all corrections[105]). Thus, the country appeared to lose control of its public debt to GDP ratio, which already reached 127% of GDP in 2009.[118] In addition, being a member of the Eurozone, the country had essentially no autonomous monetary policy flexibility. Finally, there was an effect of controversies about Greek statistics (due the aforementioned drastic budget deficit revisions which lead to an increase in the calculated value of the Greek public debt by about 10%, i.e., a public debt to GDP of about 100% until 2007), while there have been arguments about a possible effect of media reports. Consequently, Greece was "punished" by the markets which increased borrowing rates, making impossible for the country to finance its debt since early 2010, exacerbating the euro area crisis.
The Greek economy faced its most-severe crisis since the restoration of democracy in 1974 as the Greek government revised its deficit forecasts from 3.7% in early 2009 and 6% in September 2009, to 12.7% of gross domestic product (GDP) in October 2009.[119][120]
The aforementioned budget deficit and debt revisions were connected with findings that, through the assistance of Goldman Sachs, JPMorgan Chase and numerous other banks, financial products were developed which enabled the governments of Greece, Italy and many other European countries to hide parts of their borrowing.[121][122] Dozens of similar agreements were concluded across Europe whereby banks supplied cash in advance in exchange for future payments by the governments involved; in turn, the liabilities of the involved countries were "kept off the books".[122][123][124][125][126][127]
According to Der Spiegel, credits given to European governments were disguised as "swaps" and consequently did not get registered as debt because Eurostat at the time ignored statistics involving financial derivatives. A German derivatives dealer had commented to Der Spiegel that "The Maastricht rules can be circumvented quite legally through swaps," and "In previous years, Italy used a similar trick to mask its true debt with the help of a different US bank."[127] These conditions had enabled Greek as well as many other European governments to spend beyond their means, while meeting the deficit targets of the European Union and the monetary union guidelines.[128][129][130][131][132][133][134][122][135] In May 2010, the Greek government deficit was again revised and estimated to be 13.6%[136] which was among the highest relative to GDP, with Iceland in first place at 15.7% and the United Kingdom third with 12.6%.[137][dubious–discuss] Public debt was forecast, according to some estimates, to hit 120% of GDP during 2010.[138]
Greek bonds
20 year
15 year
10 year
5 year
1 year
3 month
1 month
As a consequence, there was a crisis in international confidence in Greece's ability to repay its sovereign debt, as reflected by the rise of the country's borrowing rates (although their slow rise – the 10-year government bond yield only exceeded 7% in April 2010 – coinciding with a large number of negative articles, has led to arguments about the role of international news media in the evolution of the crisis). In order to avert a default (as high borrowing rates effectively prohibited access to the markets), in May 2010 the other Eurozone countries, and the IMF, agreed to a "rescue package" which involved giving Greece an immediate €45 billion in bail-out loans, with more funds to follow, totaling €110 billion.[139][140] In order to secure the funding, Greece was required to adopt harsh austerity measures to bring its deficit under control.[141] Their implementation was to be monitored and evaluated by the European Commission, the European Central Bank and the IMF.[142][143]
The 2008 financial crisis – particularly the austerity package put forth by the EU and the IMF – has been met with anger by the Greek public, leading to riots and social unrest, while there have been theories about the effect of international media. Despite - others say because of - the long range of austerity measures, the government deficit has not been reduced accordingly, mainly, according to many economists, because of the subsequent recession.[144][145][146][147][148]
Public sector workers have come out on strike in order to resist job cuts and reductions to salaries as the government promises that a large scale privatisation programme will be accelerated.[149] Immigrants are sometimes treated as scapegoats for economic problems by far-right extremists.[150]
By July 2014 there were still anger and protests about the austerity measures, with a 24-hour strike among government workers timed to coincide with an audit by inspectors from the International Monetary Fund, the European Union and European Central Bank in advance of a decision on a second bailout of one billion euros ($1.36 billion), due in late July.[154]
Greece exited its six-year recession in the second quarter of 2014,[155] but the challenges of securing political stability and debt sustainability remained.[156]
A third bailout was agreed in July 2015, after a confrontation with the newly elected leftist government of Alexis Tsipras. In June 2017, news reports indicated that the "crushing debt burden" had not been alleviated and that Greece was at the risk of defaulting on some payments.[157] The International Monetary Fund stated that the country should be able to borrow again "in due course". At the time, the Euro zone gave Greece another credit of $9.5-billion, $8.5 billion of loans and brief details of a possible debt relief with the assistance of the IMF.[158] On 13 July, the Greek government sent a letter of intent to the IMF with 21 commitments it promised to meet by June 2018. They included changes in labour laws, a plan to cap public sector work contracts, to transform temporary contracts into permanent agreements and to recalculate pension payments to reduce spending on social security.[159]
Greece's bailouts successfully ended (as declared) on 20 August 2018.[160]
Effects of the bailout programmes on the debt crisis
There was a 25% drop in Greece's GDP, connected with the bailout programmes.[161][162] This had a critical effect: the Debt-to-GDP ratio, the key factor defining the severity of the crisis, would jump from its 2009 level of 127%[163] to about 170%, solely due to the GDP drop (i.e., for the same Debt). Such a level is considered unsustainable.[164] Reports show that, for government debt, the threshold for unhealthy Debt-to-GDPT ratio is around 85%.[165] In a 2013 report, the IMF admitted that it had underestimated the effects of so extensive tax hikes and budget cuts on the country's GDP and issued an informal apology.[166][167][168][162]
COVID-19 recession
The COVID-19 pandemic significantly impacted all sectors of the Greek economy, and tourism in particular. As a result, GDP shrank by 9.2% in 2020,[54] but rebounded by 8.7% in 2021, 5.5% in 2022, 2.1% in 2023 and 2.1% in 2024.[54] In June 2021, the European Commission agreed to disburse approximately 30 billion Euros in COVID-19 related economic aid (12 billion in loans and 18 billion in grants).[169]
Current Greek economy
In 2024, the Greek economy is forecast to grow nearly 3%, meaning it approaches its pre-crisis size of 2009 and far outpacing the euro zone average economic growth of 0.8%.[170]
In 2010, Greece was the European Union's largest producer of cotton (183,800 tons) and pistachios (8,000 tons)[171] and ranked second in the production of rice (229,500 tons)[171] and olives (147,500 tons),[172] third in the production of figs (11,000 tons) and[172] almonds (44,000 tons),[172] tomatoes (1,400,000 tons)[172] and watermelons (578,400 tons)[172] and fourth in the production of tobacco (22,000 tons).[171] Agriculture contributes 3.8% of the country's GDP[1] and employs 12.4% of the country's labor force.[1]
Greece is a major beneficiary of the Common Agricultural Policy of the European Union. As a result of the country's entry to the European Community, much of its agricultural infrastructure has been upgraded and agricultural output increased. Between 2000 and 2007 organic farming in Greece increased by 885%, the highest change percentage in the EU.[173]
In 2007, Greece accounted for 19% of the EU's fishing haul in the Mediterranean Sea,[174] ranked third with 85,493 tons,[174] and ranked first in the number of fishing vessels in the Mediterranean between European Union members.[174] Additionally, the country ranked 11th in the EU in total quantity of fish caught, with 87,461 tons.[174]
In September 2023, the main agricultural production was severely affected by a deadly flood in the Thessaly region, with estimated losses of 3.7 billion.[175][176][177]
Secondary sector
Industry
Between 2005 and 2011, Greece has had the highest percentage increase in industrial output compared to 2005 levels out of all European Union members, with an increase of 6%.[178]Eurostat statistics show that the industrial sector was hit by the Greek government-debt crisis throughout 2009 and 2010,[179] with domestic output decreasing by 5.8% and industrial production in general by 13.4%.[179] Currently, Greece is ranked third in the European Union in the production of marble (over 920,000 tons), after Italy and Spain.
Between 1999 and 2008, the volume of retail trade in Greece increased by an average of 4.4% per year (a total increase of 44%),[179] while it decreased by 11.3% in 2009.[179] The only sector that did not see negative growth in 2009 was administration and services, with a marginal growth of 2.0%.[179]
In 2009, Greece's labor productivity was 98% that of the EU average,[179] but its productivity-per-hour-worked was 74% that the Eurozone average.[179] The largest industrial employer in the country (in 2007) was the manufacturing industry (407,000 people),[179] followed by the construction industry (305,000)[179] and mining (14,000).[179]
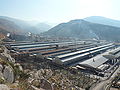
Greece has a significant shipbuilding and ship maintenance industry. The six shipyards around the port of Piraeus are among the largest in Europe.[180] In recent years, Greece has become a leader in the construction and maintenance of luxury yachts.[181]
The Port of ThessalonikiNeorion shipyard, located in Ermoupolis23.2% of the world's total merchant fleet is owned by Greek companies , making it the largest in the world. They are ranked in the top 5 for all kinds of ships, including first for tankers and bulk carriers.
Shipping has traditionally been a key sector in the Greek economy since ancient times.[182] In 1813, the Greek merchant navy was made up of 615 ships.[183] Its total tonnage was 153,580 tons and was crewed with 37,526 sailors and 5,878 cannons.[183] In 1914 the figures stood at 449,430 tons and 1,322 ships (of which 287 were steam boats).[184]
During the 1960s, the size of the Greek fleet nearly doubled, primarily through the investment undertaken by the shipping magnates Onassis, Vardinoyannis, Livanos and Niarchos.[185] The basis of the modern Greek maritime industry was formed after World War II when Greek shipping businessmen were able to amass surplus ships sold to them by the United States Government through the Ship Sales Act of the 1940s.[185]
Greece has the largest merchant navy in the world, accounting for more than 15% of the world's total deadweight tonnage (dwt) according to the United Nations Conference on Trade and Development.[41] The Greek merchant navy's total dwt of nearly 245 million is comparable only to Japan's, which is ranked second with almost 224 million.[41] Additionally, Greece represents 39.52% of all of the European Union's dwt.[186] However, today's fleet roster is smaller than an all-time high of 5,000 ships in the late 1970s.[182]
Greece is ranked third in the world by number of ships, with 4,709, behind Japan, with 5,974, and China, which leads with 7,114 owned vessels.[187] A European Community Shipowners' Associations report for 2011–2012 reveals that the Greek flag is the seventh-most-used internationally for shipping, while it ranks second in the EU.[186]
In terms of ship categories, Greek companies have 22.6% of the world's tankers[186] and 16.1% of the world's bulk carriers (in dwt).[186] An additional equivalent of 27.45% of the world's tanker dwt is on order,[186] with another 12.7% of bulk carriers also on order.[186] Shipping accounts for an estimated 6% of Greek GDP,[188] employs about 160,000 people (4% of the workforce),[189] and represents 1/3 of the country's trade deficit.[189] Earnings from shipping amounted to €14.1 billion in 2011,[186] while between 2000 and 2010 Greek shipping contributed a total of €140 billion[188] (half of the country's public debt in 2009 and 3.5 times the receipts from the European Union in the period 2000–2013).[188] The 2011 ECSA report showed that there are approximately 750 Greek shipping companies in operation.[188]
The latest available data from the Union of Greek Shipowners show that "the Greek-owned ocean-going fleet consists of 3,428 ships, totaling 245 million deadweight tonnes in capacity. This equals 15.6 percent of the carrying capacity of the entire global fleet, including 23.6 percent of the world tanker fleet and 17.2 percent of dry bulk".[190]
Counting shipping as quasi-exports and in terms of monetary value, Greece ranked 4th globally in 2011 having exported shipping services worth 17,704.132 million $; only Denmark, Germany and South Korea ranked higher during that year.[18] Similarly counting shipping services provided to Greece by other countries as quasi-imports and the difference between exports and imports as a trade balance, Greece in 2011 ranked in the latter second behind Germany, having imported shipping services worth 7,076.605 million US$ and having run a trade surplus of 10,712.342 million US$.[191][192] In 2022, Greek used vessel sales were second only to China's.[187]
b source reports break in time series; p source characterises data as provisional; e reported data may be erroneous because of relevant break in "Imports" time series
Other mobile telecommunications companies active in Greece are Wind Hellas and Vodafone Greece. The total number of active cellular phone accounts in the country in 2009 based on statistics from the country's mobile phone providers was over 20 million,[195] a penetration of 180%.[195] Additionally, there are 5.745 million active landlines in the country.[1]
Greece has tended to lag behind its European Union partners in terms of Internet use, with the gap closing rapidly in recent years. The percentage of households with Internet access more than doubled between 2006 and 2013, from 23% to 56% respectively (compared with an EU average of 49% and 79%).[196][197] At the same time, there was a massive increase in the proportion of households with a broadband connection, from 4% in 2006 to 55% in 2013 (compared with an EU average of 30% and 76%).[196][197] By 2025, the percentage of Greek households with Internet access had reached 88.7%.[198]
Tourism in the modern sense only started to flourish in Greece in the years post-1950,[199][200] although tourism in ancient times is also documented in relation to religious or sports festivals such as the Olympic Games.[200] Since the 1950s, the tourism sector saw an unprecedented boost as arrivals went from 33,000 in 1950 to 11.4 million in 1994.[199]
Greece attracts more than 16 million tourists each year, thus contributing 18.2% to the nation's GDP in 2008 according to an OECD report.[201] The same survey showed that the average tourist expenditure while in Greece was $1,073, ranking Greece 10th in the world.[201] The number of jobs directly or indirectly related to the tourism sector were 840,000 in 2008 and represented 19% of the country's total labor force.[201] In 2009, Greece welcomed over 19.3million tourists,[202] a major increase from the 17.7million tourists the country welcomed in 2008.[203]
Among the member states of the European Union, Greece was the most popular destination for residents of Cyprus and Sweden in 2011.[204]
In recent years a number of well-known tourism-related organizations have placed Greek destinations in the top of their lists. In 2009 Lonely Planet ranked Thessaloniki, the country's second-largest city, the world's fifth best "Ultimate Party Town", alongside cities such as Montreal and Dubai,[205] while in 2011 the island of Santorini was voted as the best island in the world by Travel + Leisure.[206] The neighbouring island of Mykonos was ranked as the 5th best island Europe.[206]Thessaloniki was the European Youth Capital in 2014.
Since the fall of communism, Greece has invested heavily in neighbouring countries in Southeast Europe. Between 1997 and 2009, 12.11% of foreign direct investment capital in North Macedonia was Greek, ranking fourth. In 2009 alone, Greeks invested €380 million in the country,[207] with companies such as Hellenic Petroleum having made important strategic investments.[207]
Greece invested €1.38 billion in Bulgaria between 2005 and 2007[208] and many important companies (including Bulgarian Postbank, United Bulgarian Bank Coca-Cola Bulgaria) are owned by Greek financial groups.[208] In Serbia, 250 Greek companies are active with a total investment of over €2 billion.[209]Romanian statistics from 2016 show that Greek investment in the country exceeded €4 billion, ranking Greece fifth or sixth among foreign investors.[210] Greece has been the largest investor in Albania since the fall of communism with 25% of foreign investments in 2016 coming from Greece, in addition business relations between both are extremely strong and continuously rising.[211]
Trade
During the debt crisis and subsequent COVID-19 recession, Greece's negative balance of trade decreased significantly–from €44.3 billion in 2008 to €18.15 billion in 2020–due to a substantial drop in imports.[212][213] However, the trade boom of recent years has seen the balance approach pre-crisis levels. Exports increased by 30.9% in 2021 and 38.3% in 2022, while imports rose by 34.6% and 43.6% during the same period.[214] This was followed by a correction in 2023, with exports and imports decreasing by 8.5% and 12.1% respectively.[20] In 2024, exports decreased by 2% and imports increased by 3%.[20] In 2025, exports and imports decreased by 2.8% and 4.1% respectively.[20]
Greece is also the largest import partner of Cyprus (18.0%)[215] and the largest export partner of Palau (82.4%).[216]
the International Organisations or Country Groups list and ranking presented above (i.e. #greek_letters and/or #latin_letters), is not indicative of the whole picture of Greece's trade; this is instead only an incomplete selection of some major and well known such Organisations and Groups; rounding errors possibly present
As of 2012, Greece had a total of 82 airports,[1] of which 67 were paved and six had runways longer than 3,047 meters.[1] Of these airports, two are classified as "international" by the Hellenic Civil Aviation Authority,[217] but 15 offer international services.[217] Additionally Greece has 9 heliports.[1] Greece does not have a flag carrier, but the country's airline industry is dominated by Aegean Airlines and its subsidiary Olympic Air.
Between 1975 and 2009, Olympic Airways (known after 2003 as Olympic Airlines) was the country's state-owned flag carrier, but financial problems led to its privatization and relaunch as Olympic Air in 2009. Both Aegean Airlines and Olympic Air have won awards for their services; in 2009 and 2011, Aegean Airlines was awarded the "Best regional airline in Europe" award by Skytrax,[218] and also has two gold and one silver awards by the ERA,[218] while Olympic Air holds one silver ERA award for "Airline of the Year"[219] as well as a "Condé Nast Traveller 2011 Readers Choice Awards: Top Domestic Airline" award.[220]
The Greek road network is made up of 116,986km of roads,[1] of which 1863km are highways, ranking 24th worldwide, as of 2016.[1] Since the entry of Greece to the European Community (now the European Union), a number of important projects (such as the Egnatia Odos and the Attiki Odos) have been co-funded by the organization, helping to upgrade the country's road network. In 2007, Greece ranked 8th in the European Union in goods transported by road at almost 500 million tons.
According to Eurostat, Greece's largest port by tons of goods transported in 2010 is the port of Aghioi Theodoroi, with 17.38 million tons.[221] The Port of Thessaloniki comes second with 15.8 million tons,[221] followed by the Port of Piraeus, with 13.2 million tons,[221] and the port of Eleusis, with 12.37 million tons.[221] The total number of goods transported through Greece in 2010 amounted to 124.38 million tons,[221] a considerable drop from the 164.3 million tons transported through the country in 2007.[221] Since then, Piraeus has grown to become the Mediterranean's third-largest port thanks to heavy investment by Chinese logistics giant COSCO. In 2013, Piraeus was declared the fastest-growing port in the world.[222]
In 2010 Piraeus handled 513,319 TEUs,[223] followed by Thessaloniki, which handled 273,282 TEUs.[224] In the same year, 83.9 million people passed through Greece's ports,[225] 12.7 million through the port of Paloukia in Salamis,[225] another 12.7 through the port of Perama,[225] 9.5 million through Piraeus[225] and 2.7 million through Igoumenitsa.[225] In 2013, Piraeus handled a record 3.16 million TEUs, the third-largest figure in the Mediterranean, of which 2.52 million were transported through Pier II, owned by COSCO and 644,000 were transported through Pier I, owned by the Greek state.
Energy production in Greece is dominated by the Public Power Corporation (known mostly by its acronym ΔΕΗ, or in English DEI). In 2009 DEI supplied for 85.6% of all energy demand in Greece,[226] while the number fell to 77.3% in 2010.[226] Almost half (48%) of DEI's power output is generated using lignite, a drop from the 51.6% in 2009.[226] Another 12% comes from Hydroelectric power plants[227] and another 20% from natural gas.[227] Between 2009 and 2010, independent companies' energy production increased by 56%,[226] from 2,709 Gigawatt hour in 2009 to 4,232 GWh in 2010.[226]
In 2008 renewable energy accounted for 8% of the country's total energy consumption,[228] a rise from the 7.2% it accounted for in 2006,[228] but still below the EU average of 10% in 2008.[228] 10% of the country's renewable energy comes from solar power,[173] while most comes from biomass and waste recycling.[173] In line with the European Commission's Directive on Renewable Energy, Greece aims to get 18% of its energy from renewable sources by 2020.[229] In 2013 and for several months, Greece produced more than 20% of its electricity from renewable energy sources and hydroelectric power plants.[230] Greece currently does not have any nuclear power plants in operation, however in 2009 the Academy of Athens suggested that research in the possibility of Greek nuclear power plants begin.[231]
Greece had 10 million barrels of proven oil reserves as of 1 January 2012.[1]Hellenic Petroleum is the country's largest oil company, followed by Motor Oil Hellas. Greece's oil production stands at 1,751 barrels per day (bbl/d), ranked 95th worldwide,[1] while it exports 19,960 bbl/d, ranked 53rd,[1] and imports 355,600 bbl/d, ranked 25th.[1]
In 2011 the Greek government approved the start of oil exploration and drilling in three locations within Greece,[232] with an estimated output of 250 to 300 million barrels over the next 15 to 20 years.[232] The estimated output in euros of the three deposits is €25 billion over a 15-year period,[232] of which €13–€14 billion will enter state coffers.[232] Greece's dispute with Turkey over the Aegean poses substantial obstacles to oil exploration in the Aegean Sea.
In addition to the above, Greece is also to start oil and gas exploration in other locations in the Ionian Sea, as well as the Libyan Sea, within the Greek exclusive economic zone, south of Crete.[233][234] The Ministry of the Environment, Energy and Climate Change announced that there was interest from various countries (including Norway and the United States) in exploration,[234] and the first results regarding the amount of oil and gas in these locations were expected in the summer of 2012.[234] In November 2012, a report published by Deutsche Bank estimated the value of natural gas reserves south of Crete at €427 billion.[235]
A number of oil and gas pipelines are currently under construction or under planning in the country. Such projects include the Interconnector Turkey-Greece-Italy (ITGI) and South Stream gas pipelines.[227]
Revenues of Greece between 1999 and 2010 as a percentage of GDP, compared to the EU average.
Greece has a tiered tax system based on progressive taxation. Greek law recognizes six categories of taxable income:[239]immovable property, movable property (investment), income from agriculture, business, employment, and income from professional activities. Greece's personal income tax rate, until recently, ranged from 0% for annual incomes below €12,000[239] to 45% for annual incomes over €100,000.[239] Under the new 2010 tax reform, tax exemptions have been abolished.[239]
Also under the new austerity measures and among other changes, the personal income tax-free ceiling has been reduced to €5,000 per annum[240] while further future changes, for example abolition of this ceiling, are already being planned.[241]
Greece's corporate tax dropped from 40% in 2000[239] to 20% in 2010.[239] For 2011 only, corporate tax was at 24%.[239]Value added tax (VAT) has gone up in 2010 compared to 2009: 23% as opposed to 19%.[239]
The lowest VAT possible is 6.5% (previously 4.5%)[239] for newspapers, periodicals and cultural event tickets, while a tax rate of 13% (from 9%)[239] applies to certain service sector professions. Additionally, both employers and employees have to pay social contribution taxes, which apply at a rate of 16%[239] for white collar jobs and 19.5%[239] for blue collar jobs, and are used for social insurance. In 2017 the VAT tax rate was 24%[242] with minor exceptions, 13% reduced for some basic foodstuffs which will be soon abolished and everything, as it seems, will soon go to 24% in order to fight the phantom of tax evasion.[needs update]
The Ministry of Finance expected tax revenues for 2012 to be €52.7 billion (€23.6 billion in direct taxes and €29.1 billion in indirect taxes),[243] an increase of 5.8% from 2011.[243] In 2012, the government was expected to have considerably higher tax revenues than in 2011 on a number of sectors, primarily housing (an increase of 217.5% from 2011).[243]
Greece suffers from very high levels of tax evasion. In the last quarter of 2005, tax evasion reached 49%,[244] while in January 2006 it fell to 41.6%.[244] It is worth noting that the newspaper Ethnos which published these figures went bankrupt; it is no longer published and some sources suggest that the information it had published was highly debatable.[245] A study by researchers from the University of Chicago concluded that tax evasion in 2009 by self-employed professionals alone in Greece (accountants, dentists, lawyers, doctors, personal tutors and independent financial advisers) was €28 billion or 31% of the budget deficit that year.[246]
Greece's "shadow economy" was estimated at 24.3% of GDP in 2012, compared with 28.6% for Estonia, 26.5% for Latvia, 21.6% for Italy, 17.1% for Belgium, 14.7% for Sweden, 13.7% for Finland, and 13.5% for Germany, and is certainly related to the fact that the percentage of Greeks that are self-employed is more than double the EU average (2013 est.).[105]
The Tax Justice Network estimated in 2011 that there were over 20 billion euros in Swiss bank accounts held by Greeks.[247] The former Finance Minister of Greece, Evangelos Venizelos, was quoted as saying, "Around 15,000 individuals and companies owe the taxman 37 billion euros".[248] Additionally, the TJN put the number of Greek-owned off-shore companies at over 10,000.[249]
In 2012, Swiss estimates suggested that Greeks had some 20 billion euros in Switzerland of which only one percent had been declared as taxable in Greece.[250] Estimates in 2015 were even more dramatic. They indicated that the amount due to the government of Greece from Greeks' accounts in Swiss banks totaled around 80 billion euros.[251][252]
A mid-2017 report indicated Greeks have been "taxed to the hilt" and many believed that the risk of penalties for tax evasion were less serious than the risk of bankruptcy. One method of evasion is the so-called black market, grey economy or shadow economy: work is done for cash payment which is not declared as income; as well, VAT is not collected and remitted.[253] A January 2017 report[254] by the DiaNEOsis think-tank indicated that unpaid taxes in Greece at the time totaled approximately 95 billion euros, up from 76 billion euros in 2015, much of it was expected to be uncollectable. Another early 2017 study estimated that the loss to the government as a result of tax evasion was between 6% and 9% of the country's GDP, or roughly between 11 billion and 16 billion euros per annum.[255]
The shortfall in the collection of VAT (sales tax) is also significant. In 2014, the government collected 28% less than was owed to it; this shortfall was about double the average for the EU. The uncollected amount that year was about 4.9 billion euros.[256] The DiaNEOsis study estimated that 3.5% of GDP is lost due to VAT fraud, while losses due to smuggling of alcohol, tobacco and petrol amounted to approximately another 0.5% of the country's GDP.[255]
Planned solutions
Following similar actions by the United Kingdom and Germany, the Greek government was in talks with Switzerland in 2011, attempting to force Swiss banks to reveal information on the back accounts of Greek citizens.[257] The Ministry of Finance stated that Greeks with Swiss bank accounts would either be required to pay a tax or reveal information such as the identity of the bank account holder to the Greek internal revenue services.[257] The Greek and Swiss governments were to reach a deal on the matter by the end of 2011.[257]
The solution demanded by Greece still had not been effected as of 2015. That year, estimates indicated that the amount of evaded taxes stored in Swiss banks was around 80 billion euros. By then, however, a tax treaty to address this issue was under serious negotiation between the Greek and Swiss governments.[251][252] An agreement was finally ratified by Switzerland on 1 March 2016 creating a new tax transparency law that would allow for a more effective battle against tax evasion. Starting in 2018, banks in both Greece and Switzerland will exchange information about the bank accounts of citizens of the other country to minimize the possibility of hiding untaxed income.[258]
In 2016 and 2017, the government was encouraging the use of credit cards or debit cards to pay for goods and services in order to reduce cash only payments. By January 2017, taxpayers were only granted tax-allowances or deductions when payments were made electronically, with a "paper trail" of the transactions that the government could easily audit. This was expected to reduce the problem of businesses taking payments but not issuing an invoice;[259] that tactic had been used by various companies to avoid payment of VAT (sales) tax as well as income tax.[260][261]
By 28 July 2017, numerous businesses were required by law to install a point of sale device to enable them to accept payment by credit or debit card. Failure to comply with the electronic payment facility can lead to fines of up to 1,500 euros. The requirement applied to around 400,000 firms or individuals in 85 professions. The greater use of cards was one of the factors that had already achieved significant increases in VAT collection in 2016.[262]
Wealth and standards of living
Living standards and social welfare
Living standards in Greece have been shaped by long-term trends in wages, poverty, social exclusion, and demographic change. These factors continue to influence the economic well-being of households across the country.
Wages and purchasing power
Nominal wages in Greece have increased in recent years, although real incomes remain below the European Union average. According to the ERGANI labour-market information system, the average gross monthly salary rose from €1,046 in 2019 to €1,342 in 2024.[263] The median annual income for full-time employees was approximately €17,954 in 2024, ranking among the lowest in the EU.[264] Rising living costs, particularly for energy and essential goods, have limited improvements in households’ purchasing power.[265]
Poverty, social exclusion and demographic pressures
Despite economic recovery, levels of poverty and social exclusion remain significant. The Hellenic Statistical Authority reported that 26.9 percent of the population, about 2.74 million people, were at risk of poverty or social exclusion in 2024, a slight increase from 2023.[266] Severe material and social deprivation affected 14.0 percent of the population in the same year.[266] High housing and energy costs have been identified as major contributing factors.[265]
Demographic trends place additional pressure on social welfare systems. Greece’s population declined from about 11.1 million in 2010 to 10.4 million in 2024, while the proportion of residents aged 65 and over rose to 23.3 percent.[267] These developments have implications for pensions, healthcare services, and the country’s labour force, with potential effects on future living standards and inequality.
GDP per capita of the regions of Greece in 2008.The country's two largest metropolitan areas account for almost 62% of the national economy.
Greece's most economically important regions are Attica, which contributed €87.378 billion to the economy in 2018, and Central Macedonia, which contributed €25.558 billion.[268] The smallest regional economies were those of the North Aegean (€2.549 billion) and Ionian Islands (€3.257 billion).[268]
In terms of GDP per capita, Attica (€23,300) far outranks any other Greek region.[268] The poorest regions in 2018 were the North Aegean (€11,800), Eastern Macedonia and Thrace (€11,900) and Epirus (€12,200).[268] At the national level, GDP per capita in 2018 was €17,200.[268]
Greece is a welfare state which provides a number of social services such as quasi-universal health care and pensions. In the 2012 budget, expenses for the welfare state (excluding education) stand at an estimated €22.487 billion[243] (€6.577 billion for pensions[243] and €15.910 billion for social security and health care expenses),[243] or 31.9% of the all state expenses.[243]
In 2011, 53.3 percent of employed persons worked more than 40 to 49 hours a week and 24.8 percent worked more than 50 hours a week, totaling up to 78.1 percent of employed persons working 40 or more hours a week.[270] When accounting for varying age groups, the percentage of employees working 40 to 49 hours a week peaked in the 25 to 29 age range.[270]As workers got older, they gradually decreased in percentage working 40 to 49 hours, but increased in working 50+ hours, suggesting a correlation that as employees grow older, they work more hours. Of different occupation groups, skilled agricultural, forestry, and fishery workers and managers were the most likely to work 50+ hours; however, they do not take up a significant portion of the labor force, only 14.3 percent.[271]In 2014, the average number of working hours for Greek employees was 2124 hours, ranking as the third highest among OECD countries and the highest in the Eurozone.[272]
Recent trends in employment indicate that the number of working hours will decrease in the future due to the rise of part-time work. Since 2011, average working hours have decreased.[272] In 1998, Greece passed legislation introducing part-time employment in public services with the goal of reducing unemployment, increasing the total, but decreasing the average number of hours worked per employee.[273] Whether the legislation was successful in increasing public-sector part-time work, labor market trends show that part-time employment has increased from 7.7 percent in 2007 to 11 percent in 2016 of total employment.[274] Both men and women have had the part-time share of employment increase over this period. While women still constitute a majority of part-time workers, recently men have been taking a larger share of part-time employment.[275]
Currency
Between 1832 and 2002 the currency of Greece was the drachma. After signing the Maastricht Treaty, Greece applied to join the eurozone. The two main convergence criteria were a maximum budget deficit of 3% of GDP and a declining public debt if it stood above 60% of GDP. Greece met the criteria as shown in its 1999 annual public account. On 1 January 2001, Greece joined the eurozone, with the adoption of the euro at the fixed exchange rate ₯340.75 to €1. However, in 2001 the euro only existed electronically, so the physical exchange from drachma to euro only took place on 1 January 2002. This was followed by a ten-year period for eligible exchange of drachma to euro, which ended on 1 March 2012.[276]
Prior to the adoption of the euro, 64% of Greek citizens viewed the new currency positively,[277] but in February 2005 this figure fell to 26% and by June 2005 it fell further to 20%.[277] Since 2010 the figure has risen again, and a survey in September 2011 showed that 63% of Greek citizens viewed of the euro positively.[277]
Charts gallery
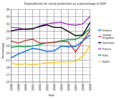
Greek social expenditures as a percentage of GDP (1998–2009)
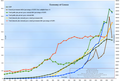
Distribution of income in Greece over the years
Distribution of total income in Greece over the years
Employment and unemployment in Greece since 2004
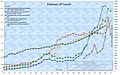
Greek GDP, Debt (various) and Budget Deficit over the years
Domestic bank deposits of Greek households by type of account
Domestic lending by domestic banks in Greece since 1980
House Price Index, Greece (including flats)
Poverty rate
As a result of the recession sparked by the public debt crisis, poverty has increased. The rate of people at risk of poverty or social exclusion reached a high of 36% in 2014, before subsiding over the following years to 26.1% in 2023.[278] The rate of extreme poverty rose to 15% in 2015, up from 8.9% in 2011 and a huge increase from 2009 when it did not exceed 2.2%.[279] In 2015, the rate among children aged 0–17 was 17.6% and for young people aged 18–29 the rate was 24.4%.[279] With unemployment on the rise, those without jobs between 2012 and 2015 were at the highest risk of poverty (70–75%), up from less than 50% in 2011.[279] Those out of work lose their health insurance after two years, further exacerbating the poverty rate. Younger unemployed people tend to rely on the older generations of their families for financial support. However, long-term unemployment has depleted pension funds due to fewer workers making social security contributions, resulting in higher poverty rates in intergenerational households reliant on the reduced pensions received by their retired members. Over the course of the economic crisis, Greeks have endured significant job losses and wage cuts, as well as deep cuts to workers' compensation and welfare benefits. From 2008 to 2013, Greeks became 40% poorer on average, and in 2014 saw their disposable household income drop below 2003 levels.[280]
The following table shows the main economic indicators in 1980–2021 (with IMF staff estimates in 2022–2027). Inflation below 5% is in green.[281]
Year
GDP (bn US$ PPP)
GDP per capita (US$ PPP)
GDP (bn US$ nominal)
GDP per capita (US$ nominal)
GDP growth (real)
Inflation (%)
Unemployment (%)
Gov. debt (% of GDP)
1980
84.2
8,784.9
56.5
5,898.2
0.7
24.7
2.7
22.7
1981
90.7
9,352.6
52.2
5,377.0
-1.6
24.5
4.0
26.9
1982
95.2
9,760.8
54.4
5,576.5
-1.1
21.1
5.8
29.6
1983
97.9
9,969.0
49.2
5,008.0
-1.1
20.2
7.9
33.9
1984
103.5
10,481.7
47.9
4,854.2
2.0
18.5
8.1
40.4
1985
109.4
11,032.0
47.5
4,791.8
2.5
19.3
7.8
47.0
1986
112.2
11,278.4
55.9
5,623.2
0.5
23.0
7.4
47.5
1987
112.4
11,255.5
65.1
6,522.4
-2.3
16.4
7.4
52.9
1988
121.3
12,115.0
75.8
7,568.3
4.3
13.5
7.7
57.6
1989
130.9
13,013.5
78.6
7,812.8
3.8
13.7
7.5
60.3
1990
135.8
13,416.8
97.1
9,597.7
—N/a
20.4
7.0
73.8
1991
144.7
14,089.5
104.7
10,196.2
3.1
19.5
7.7
75.3
1992
149.1
14,378.8
115.5
11,139.4
0.7
15.9
8.7
80.6
1993
150.2
14,395.6
108.1
10,363.6
-1.6
14.4
9.7
101.1
1994
156.4
14,912.9
115.7
11,029.1
2.0
10.9
9.6
99.1
1995
163.1
15,477.3
135.8
12,887.9
2.1
8.8
10.0
99.8
1996
170.8
16,131.6
144.6
13,660.5
2.9
7.9
10.3
102.2
1997
181.5
17,079.6
142.1
13,370.3
4.5
5.4
10.3
100.3
1998
190.7
17,837.2
143.4
13,412.6
3.9
4.5
11.2
98.3
1999
199.4
18,549.7
148.2
13,784.4
3.1
2.1
12.1
99.7
2000
211.9
19,662.6
131.1
12,164.7
3.9
2.9
11.4
105.8
2001
225.6
20,819.6
135.2
12,473.3
4.1
3.6
10.8
108.0
2002
238.1
21,868.1
153.2
14,065.8
3.9
3.9
10.4
105.8
2003
256.9
23,532.4
200.6
18,378.3
5.8
3.5
9.8
102.3
2004
277.1
25,330.0
238.8
21,829.5
5.1
3.0
10.6
103.7
2005
287.5
26,210.1
245.9
22,417.6
0.6
3.5
10.0
108.3
2006
313.1
28,455.7
271.3
24,648.9
5.7
3.3
9.0
104.5
2007
332.1
30,095.9
316.3
28,656.2
3.3
3.0
8.4
104.0
2008
337.4
30,501.3
352.9
31,902.0
-0.3
4.2
7.8
110.3
2009
324.9
29,287.1
328.2
29,577.6
-4.3
1.3
9.6
127.8
2010
310.8
27,953.5
297.4
26,743.4
-5.5
4.7
12.7
147.5
2011
285.1
25,628.8
282.9
25,437.0
-10.1
3.1
17.9
184.0
2012
275.1
24,818.2
242.2
21,845.0
-7.1
1.0
24.4
162.1
2013
284.9
25,895.9
238.9
21,712.0
-2.5
-0.9
27.5
178.8
2014
290.0
26,541.3
235.5
21,554.2
0.5
-1.4
26.5
181.8
2015
289.6
26,676.0
195.7
18,023.9
-0.2
-1.1
24.9
179.1
2016
296.4
27,489.2
193.1
17,906.1
-0.5
0.0
23.6
183.7
2017
307.1
28,518.2
199.8
18,552.2
1.1
1.1
21.5
183.2
2018
319.7
29,761.3
212.1
19,750.7
1.7
0.8
19.3
190.7
2019
331.3
30,887.7
205.2
19,130.4
1.8
0.5
17.3
185.6
2020
305.0
28,456.6
188.7
17,603.4
-9.0
-1.3
16.4
212.4
2021
344.2
32,229.8
216.4
20,263.3
8.3
0.6
15.0
199.4
2022
387.8
36,465.5
222.0
20,875.8
5.2
9.2
12.6
177.6
2023
408.9
38,607.6
226.3
21,371.7
1.8
3.2
12.2
169.8
2024
426.6
40,441.5
235.3
22,307.3
2.2
1.6
11.4
163.8
2025
442.3
42,111.4
244.8
23,303.7
1.8
1.8
11.0
159.1
2026
458.0
43,782.8
254.6
24,339.5
1.6
1.8
10.7
154.4
2027
473.2
45,420.9
262.8
25,227.7
1.4
1.9
10.4
149.9
Notes
↑100-year period until the eve of the Greek debt crisis
↑After revised adjustments, Greece's budget deficit was 3.07%, which was much smaller than other EU countries at the moment joining Euro, like France's and Portugal's budget deficits of 3.3% and 3.4%, respectively.[108]
Peter Haggett (2002). Encyclopedia of World Geography: Italy. Marshall Cavendish. p.1470. ISBN978-0-7614-7300-8. Retrieved 14 April 2013. The Greek shipping industry, one of the largest in the world, accounts for more than 30 percent of the income derived from services. It is exempt from government control, unlike other
Jill Dubois; Xenia Skoura; Olga Gratsaniti (2003). Greece. Marshall Cavendish. p.42. ISBN978-0-7614-1499-5. Greek ships make up 70 percent of the European Union's total merchant fleet. Greece has a large shipbuilding and ship refitting industry. Its six shipyards near Piraeus are among the biggest in Europe. As Greek ships primarily transport ...
Tullio Treves; Pineshi (1997). The Law of the Sea: The European Union and Its Member States. Martinus Nijhoff Publishers. pp.239–240. ISBN978-90-411-0326-0. The Shipping Industry The shipping industry (the transport of persons and goods by sea) constitutes one of the most important factors for the Greek society and economy
Athanasios A. Pallis (2007). Maritime Transport: The Greek Paradigm. Elsevier. p.175. ISBN978-0-7623-1449-2. Since Greek shipping ranks on top of world shipping business in terms of tonnage and volume, it is of interest to have a closer look at Greek shipping finance.
↑"Archived copy"(PDF). Archived(PDF) from the original on 25 December 2017. Retrieved 25 December 2017.{{cite web}}: CS1 maint: archived copy as title (link)
↑"Archived copy"(PDF). Archived(PDF) from the original on 20 April 2017. Retrieved 25 December 2017.{{cite web}}: CS1 maint: archived copy as title (link)
↑Keridis, Dimitris (3 March 2006), Greece and the Balkans: From Stabilization to Growth (lecture), Montreal, QC, CA: Hellenic Studies Unit at Concordia University, Greece has a larger economy than all the Balkan countries combined. Greece is also an important regional investor
12Imogen Bell (2002). Central and South-Eastern Europe: 2003. Routledge. p.282. ISBN978-1-85743-136-0. Retrieved 27 May 2013. Greece has become the largest investor into Macedonia (FYRM), while Greek companies such as OTE have also developed strong presences in former Yugoslavia and other Balkan countries.
↑Mustafa Aydin; Kostas Ifantis (28 February 2004). Turkish-Greek Relations: The Security Dilemma in the Aegean. Taylor & Francis. pp.266–267. ISBN978-0-203-50191-7. Retrieved 27 May 2013. second largest investor of foreign capital in Albania, and the third largest foreign investor in Bulgaria. Greece is the most important trading partner of the Former Yugoslav Republic of Macedonia.
↑Wayne C. Thompson (9 August 2012). Western Europe 2012. Stryker Post. p.283. ISBN978-1-61048-898-3. Retrieved 27 May 2013. Greeks are already among the three largest investors in Bulgaria, Romania and Serbia, and overall Greek investment in the ... Its banking sector represents 16% of banking activities in the region, and Greek banks open a new branch in a Balkan country almost weekly.
↑K. Kostis; S. Petmezas (2006). Η Ανάπτυξη της Ελληνικής οικονομίας τον 19ο αιώνα[Development of the Greek economy in the 19th century]. Athens: Alexandria Publications.
↑G. Anastasopoulos (1946). Ιστορία της Ελληνικής Βιομηχανίας 1840–1940[History of Greek Industry 1840–1940]. Athens: Elliniki Ekdotiki Etairia.
↑"Υπόθεση ΕΛΣΤΑΤ: Για ποινικοποίηση της αλήθειας μίλησε ο Γ. Παπακωνσταντίνου"[ELSTAT case: Criminalization of the truth, says G. Papakonstantinou]. Skai TV. 2 February 2012. Retrieved 23 February 2012. According to the referral of the case, 'from the entire collection of evidence, and especially from witnesses, there exists proof in relation to actions deserving of criminal punishment and with persons who held offices in the previous government of Greece' and from most interviews with witnesses it is noted that 'they speak of an artificial and arbitrary swelling of the national deficit in 2009 and for the liability of the -then- Prime Minister, members of the then-government and then-officials of the Ministry of Finance'
↑LOUISE STORY; LANDON THOMAS Jr; NELSON D. SCHWARTZ (13 February 2010). "Global Business: Wall St. Helped to Mask Debt Fueling Europe's Crisis". The New York Times. In dozens of deals across the Continent, banks provided cash upfront in return for government payments in the future, with those liabilities then left off the books. Greece, for example, traded away the rights to airport fees and lottery proceeds in years to come.
↑Nicholas Dunbar; Elisa Martinuzzi (5 March 2012). "Goldman Secret Greece Loan Shows Two Sinners as Client Unravels". Bloomberg. Greece actually executed the swap transactions to reduce its debt-to-gross-domestic-product ratio because all member states were required by the Maastricht Treaty to show an improvement in their public finances," Laffan said in an e- mail. "The swaps were one of several techniques that many European governments used to meet the terms of the treaty."
↑Edmund Conway Economics (15 February 2010). "Did Goldman Sachs help Britain hide its debts too?". The Daily Telegraph. London. Archived from the original on 18 February 2010. One of the more intriguing lines from that latter piece says: "Instruments developed by Goldman Sachs, JPMorgan Chase and a wide range of other banks enabled politicians to mask additional borrowing in Greece, Italy and possibly elsewhere." So, the obvious question goes, what about the UK? Did Britain hide its debts? Was Goldman Sachs involved? Should we panic?
↑Elena Moya (16 February 2010). "Banks that inflated Greek debt should be investigated, EU urges". The Guardian. "These instruments were not invented by Greece, nor did investment banks discover them just for Greece," said Christophoros Sardelis, who was chief of Greece's debt management agency when the contracts were conducted with Goldman Sachs.Such contracts were also used by other European countries until Eurostat, the EU's statistic agency, stopped accepting them later in the decade. Eurostat has also asked Athens to clarify the contracts.
12Beat Balzli (8 February 2010). "Greek Debt Crisis: How Goldman Sachs Helped Greece to Mask its True Debt". Der Spiegel. Retrieved 29 October 2013. This credit disguised as a swap didn't show up in the Greek debt statistics. Eurostat's reporting rules don't comprehensively record transactions involving financial derivatives. "The Maastricht rules can be circumvented quite legally through swaps," says a German derivatives dealer. In previous years, Italy used a similar trick to mask its true debt with the help of a different US bank.
↑Cecchetti, Stephen G.; Mohanty, Madhusudan; Zampolli, Fabrizio (16 September 2011). "The real effects of debt". Economic Symposium Conference Proceedings, Jackson Hole, 2011.
↑Jill Dubois; Xenia Skoura; Olga Gratsaniti (2003). Greece. Marshall Cavendish. p.42. ISBN978-0-7614-1499-5. Greek ships make up 70 percent of the European Union's total merchant fleet. Greece has a large shipbuilding and ship refitting industry. Its six shipyards near Piraeus are among the biggest in Europe. As Greek ships primarily transport ...
12Ιστορία των Ελλήνων – Ο Ελληνισμός υπό Ξένη Κυριαρχία 1453–1821[History of the Greeks – Hellenism under Foreign Rule 1453–1821]. Vol.8. Athens: Domi Publishings. pp.652–653. ISBN960-8177-93-6.
Pasiouras, Fotios. Greek Banking: From the Pre-Euro Reforms to the Financial Crisis and Beyond (Palgrave Macmillan; 2012) 217 pages; covers the mid-1990s to 2011.
This page is based on this Wikipedia article Text is available under the CC BY-SA 4.0 license; additional terms may apply. Images, videos and audio are available under their respective licenses.


