List of countries by GDP (nominal)

Last updated

List of countries by GDP (nominal)
Largest economies in the world by GDP (nominal) in 2024
according to International Monetary Fund estimates [n 1] [1]
Countries by estimated nominal GDP in 2024.
.mw-parser-output .legend{page-break-inside:avoid;break-inside:avoid-column}.mw-parser-output .legend-color{display:inline-block;min-width:1.25em;height:1.25em;line-height:1.25;margin:1px 0;text-align:center;border:1px solid black;background-color:transparent;color:black}.mw-parser-output .legend-text{}
> $20 trillion
$10-20 trillion
$5-10 trillion
$1-5 trillion
$750 billion - $1 trillion
$500-750 billion
$250-500 billion
$100-250 billion
$50-100 billion
$25-50 billion
$5-25 billion
< $5 billion Countries by GDP (nominal).svg
Countries by estimated nominal GDP in 2024.
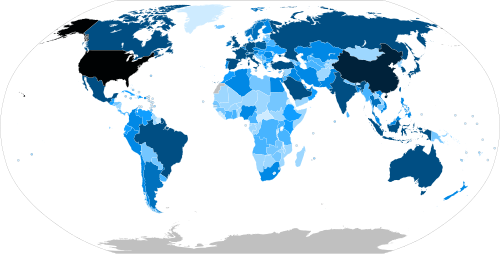
  > $20 trillion
  $10–20 trillion
  $5–10 trillion
  $1–5 trillion
  $750 billion – $1 trillion
  $500–750 billion
  $250–500 billion
  $100–250 billion
  $50–100 billion
  $25–50 billion
  $5–25 billion
  < $5 billion

Gross domestic product (GDP) is the market value of all final goods and services from a nation in a given year. [2] Countries are sorted by nominal GDP estimates from financial and statistical institutions, which are calculated at market or government official exchange rates. Nominal GDP does not take into account differences in the cost of living in different countries, and the results can vary greatly from one year to another based on fluctuations in the exchange rates of the country's currency. [3] Such fluctuations may change a country's ranking from one year to the next, even though they often make little or no difference in the standard of living of its population. [4]

Contents

Comparisons of national wealth are also frequently made based on purchasing power parity (PPP), to adjust for differences in the cost of living in different countries. Other metrics, nominal GDP per capita and a corresponding GDP (PPP) per capita are used for comparing national standard of living. On the whole, PPP per capita figures are less spread than nominal GDP per capita figures. [5]

The rankings of national economies over time have changed considerably; the United States surpassed the British Empire's output around 1916, [6] which in turn had surpassed the Qing dynasty in aggregate output decades earlier. [7] [8] Since China's transition to a socialist market economy through controlled privatisation and deregulation, [9] [10] the country has seen its ranking increase from ninth in 1978, to second in 2010; China's economic growth accelerated during this period and its share of global nominal GDP surged from 2% in 1980 to 18% in 2021. [8] [1] [11] Among others, India has also experienced an economic boom since the implementation of economic liberalisation in the early 1990s. [12]

The first list includes estimates compiled by the International Monetary Fund's World Economic Outlook, the second list shows the World Bank's data, and the third list includes data compiled by the United Nations Statistics Division. The IMF's definitive data for the past year and estimates for the current year are published twice a year in April and October. Non-sovereign entities (the world, continents, and some dependent territories) and states with limited international recognition (such as Kosovo and Taiwan) are included in the list where they appear in the sources.

Table

The table initially ranks each IMF member including  sovereign states not part of the IMF, non-sovereign states and territories, and countries with limited recognition 

The links in the "Country/Territory" row of the following table link to the article on the GDP or the economy of the respective country or territory.

GDP (million US$) by country
Country/Territory IMF [1] [13] World Bank [14] United Nations [15]
ForecastYearEstimateYearEstimateYear
 World109,529,2162024105,435,5402023100,834,7962022
Flag of the United States.svg United States 28,781,083202427,360,935202325,744,1002022
Flag of the People's Republic of China.svg China 18,532,633 [n 1] 202417,794,782 [n 3] 202317,963,170 [n 1] 2022
Flag of Germany.svg Germany 4,591,10020244,456,08120234,076,9232022
Flag of Japan.svg Japan 4,110,45220244,212,94520234,232,1732022
Flag of India.svg India 3,937,01120243,549,91920233,465,5412022
Flag of the United Kingdom.svg United Kingdom 3,495,26120243,340,03220233,089,0722022
Flag of France.svg France 3,130,01420243,030,90420232,775,3162022
Flag of Brazil.svg Brazil 2,331,39120242,173,66620231,920,0952022
Flag of Italy.svg Italy 2,328,02820242,254,85120232,046,9522022
Flag of Canada (Pantone).svg Canada 2,242,18220242,140,08620232,137,9392022
Flag of Russia.svg Russia 2,056,84420242,021,42120232,240,4222022
Flag of Mexico.svg Mexico 2,017,02520241,788,88720231,463,3232022
Flag of Australia (converted).svg Australia 1,790,34820241,723,82720231,776,5772022
Flag of South Korea.svg South Korea 1,760,94720241,712,79320231,673,9162022
Flag of Spain.svg Spain 1,647,11420241,580,69520231,415,8742022
Flag of Indonesia.svg Indonesia 1,475,69020241,371,17120231,319,1002022
Flag of the Netherlands.svg Netherlands 1,142,51320241,118,12520231,008,0272022
Flag of Turkey.svg Turkey 1,113,56120241,108,0222023907,1182022
Flag of Saudi Arabia.svg Saudi Arabia 1,106,01520241,067,58320231,108,1482022
Flag of Switzerland (Pantone).svg Switzerland 938,4582024884,9402023818,4262022
Flag of Poland.svg Poland 844,6232024811,2292023688,1252022
Flag of the Republic of China.svg Taiwan 802,958 [n 4] 2024
Flag of Belgium (civil).svg Belgium 655,1922024632,2172023582,6432022
Flag of Sweden.svg Sweden 623,0482024593,2682023591,1882022
Flag of Argentina.svg Argentina 604,2602024640,5912023631,1332022
Flag of Ireland.svg Ireland 564,0202024545,6292023532,4152022
Flag of Thailand.svg Thailand 548,8902024514,9452023495,3402022
Flag of Austria.svg Austria 540,8872024516,0342023470,3022022
Flag of Israel.svg Israel 530,6642024509,9022023525,0022022
Flag of the United Arab Emirates.svg United Arab Emirates 527,7962024504,1732023507,0632022
Flag of Norway.svg Norway 526,9512024485,5132023579,4222022
Flag of Singapore.svg Singapore 525,2282024501,4282023466,7882022
Flag of the Philippines.svg Philippines 471,5162024437,1462023404,2842022
Flag of Vietnam.svg Vietnam 465,8142024429,7172023408,8022022
Flag of Iran.svg Iran 464,1812024401,5052023398,0472022
Flag of Bangladesh.svg Bangladesh 455,1622024437,4152023432,6772022
Flag of Malaysia.svg Malaysia 445,5192024399,6492023406,3052022
Flag of Denmark.svg Denmark 409,9892024404,1992023400,1672022
Flag of Hong Kong.svg Hong Kong 406,775 [n 5] 2024382,0552023359,8382022
Flag of Colombia.svg Colombia 386,0762024363,5402023343,9392022
Flag of South Africa.svg South Africa 373,2332024377,7822023405,2702022
Flag of Romania.svg Romania 369,9712024351,0032023300,6902022
Flag of Egypt.svg Egypt 347,5942024395,9262023409,3062022
Flag of Pakistan.svg Pakistan 338,2372023338,3682023326,7962022
Flag of Chile.svg Chile 333,7602024335,5332023300,6862022
Flag of the Czech Republic.svg Czech Republic 325,8802024330,8582023290,5272022
Flag of Finland.svg Finland 308,0552024300,1872023282,5112022
Flag of Portugal.svg Portugal 298,9492024287,0802023254,8492022
Flag of Kazakhstan.svg Kazakhstan 296,7402024261,4212023225,4962022
Flag of Peru.svg Peru 282,4582024267,6032023242,6312022
Flag of Algeria.svg Algeria 266,7802024239,8992023191,9122022
Flag of Iraq.svg Iraq 265,8942024250,8432023264,1822022
Flag of New Zealand.svg New Zealand 257,6252024253,4662023245,8452022
Flag of Nigeria.svg Nigeria 252,7382024362,8152023475,0582022
Flag of Greece.svg Greece 250,2762024238,2062023217,2852022
Flag of Qatar.svg Qatar 244,6862024235,7702022237,1012022
Flag of Hungary.svg Hungary 223,4132024212,3892023177,3372022
Flag of Ethiopia.svg Ethiopia 205,1302024163,6982023118,9712022
Flag of Ukraine.svg Ukraine 188,943 [n 6] 2024178,757 [n 6] 2023160,502 [n 6] 2022
Flag of Kuwait.svg Kuwait 160,3972024161,7722023175,3632022
Flag of Morocco.svg Morocco 152,3772024141,1092023130,912 [n 7] 2022
Flag of Cuba.svg Cuba 147,1932022
Flag of Slovakia.svg Slovakia 140,8082024132,7942023115,3042022
Flag of the Dominican Republic.svg Dominican Republic 127,3562024121,4442023113,5372022
Flag of Ecuador.svg Ecuador 121,5922024118,8452023115,0492022
Flag of Puerto Rico.svg Puerto Rico 117,7632024117,9022023113,4342022
Flag of Guatemala.svg Guatemala 110,0352024102,050202395,0032022
Flag of Oman.svg Oman 108,9272024108,1922023114,6662022
Flag of Bulgaria.svg Bulgaria 107,9332024101,584202390,2132022
Flag of Kenya.svg Kenya 104,0012024107,4412023113,4192022
Flag of Venezuela.svg Venezuela 102,3282024129,3132022
Flag of Uzbekistan.svg Uzbekistan 97,956202490,889202380,3912022
Flag of Costa Rica.svg Costa Rica 96,058202486,498202368,3802022
Flag of Angola.svg Angola 92,123202484,7732023113,3042022
Flag of Luxembourg.svg Luxembourg 88,556202485,755202381,5302022
Flag of Croatia.svg Croatia 88,076202482,689202371,5522022
Flag of Panama.svg Panama 87,347202483,382202376,5222022
Flag of Cote d'Ivoire.svg Ivory Coast 86,911202478,789202370,0182022
Flag of Uruguay.svg Uruguay 82,605202477,241202371,1712022
Flag of Turkmenistan.svg Turkmenistan 81,896202459,887202367,0092022
Flag of Serbia.svg Serbia 81,873202475,187202363,5632022
Flag of Lithuania.svg Lithuania 81,170202477,836202370,8782022
Flag of Tanzania.svg Tanzania 79,605202479,158202373,535 [n 8] 2022
Flag of Azerbaijan.svg Azerbaijan 78,749202472,356202378,7212022
Flag of Ghana.svg Ghana 75,244202476,370202373,7662022
Flag of Sri Lanka.svg Sri Lanka 74,846202284,357202376,1872022
Flag of the Democratic Republic of the Congo.svg DR Congo 73,761202466,383202362,5512022
Flag of Slovenia.svg Slovenia 72,101202468,217202359,9812022
Flag of Belarus.svg Belarus 69,048202471,857202372,8732022
Flag of Myanmar.svg Myanmar 68,006202464,815202365,2112022
Flag of Uganda.svg Uganda 56,310202449,273202348,2432022
Flag of Tunisia.svg Tunisia 54,708202448,530202346,1812022
Flag of Macau.svg Macau 54,677 [n 9] 202447,062202324,0422022
Flag of Jordan.svg Jordan 53,570202450,814202347,4522022
Flag of Cameroon.svg Cameroon 53,205202447,946202344,3412022
Bandera de Bolivia (Estado).svg Bolivia 49,334202445,850202344,0082022
Flag of Libya.svg Libya 48,221202450,492202340,5372022
Flag of Bahrain.svg Bahrain 46,790202443,205202344,3822022
Flag of Paraguay.svg Paraguay 45,817202442,956202341,7222022
Flag of Latvia.svg Latvia 45,466202443,627202340,8762022
Flag of Cambodia.svg Cambodia 45,150202431,773202329,5042022
Flag of Nepal.svg Nepal 44,179202440,908202339,4062022
Flag of Estonia.svg Estonia 43,486202440,745202338,0492022
Flag of Honduras.svg Honduras 37,355202434,401202331,7172022
Flag of Senegal.svg Senegal 35,450202431,014202327,7752022
Flag of El Salvador.svg El Salvador 35,333202434,016202332,4882022
Flag of Zimbabwe.svg Zimbabwe 34,405202426,538202326,4182022
Flag of Cyprus.svg Cyprus 34,221 [n 10] 202432,230 [n 10] 202329,210 [n 10] 2022
Flag of Iceland.svg Iceland 33,338202431,020202328,0642022
Flag of Georgia.svg Georgia 32,865 [n 11] 202430,536 [n 11] 202324,605 [n 11] 2022
Flag of Papua New Guinea.svg Papua New Guinea 31,716202430,933202231,6092022
Flag of Zambia.svg Zambia 29,872202428,163202329,1362022
Flag of Bosnia and Herzegovina.svg Bosnia and Herzegovina 29,078202427,055202324,4732022
Flag of Trinidad and Tobago.svg Trinidad and Tobago 28,365202428,140202330,0532022
Flag of Sudan.svg Sudan 26,8652024109,327202336,7292022
Flag of Guinea.svg Guinea 25,447202423,612202320,8462022
Flag of Albania.svg Albania 25,431202422,978202318,9162022
Flag of Armenia.svg Armenia 25,408202424,212202319,5132022
Flag of Haiti.svg Haiti 24,046202419,851202318,7512022
Flag of Mozambique.svg Mozambique 22,975202420,625202318,4062022
Flag of Malta.svg Malta 22,737202420,957202318,1002022
Flag of Mongolia.svg Mongolia 21,943202419,872202317,1462022
Flag of Burkina Faso.svg Burkina Faso 21,902202420,325202319,1762022
Flag of Lebanon.svg Lebanon 21,780202217,937202339,3032022
Flag of Mali.svg Mali 21,662202420,905202318,8272022
Flag of Botswana.svg Botswana 21,418202419,396202320,3522022
Flag of Benin.svg Benin 21,371202419,673202317,3962022
Flag of Guyana.svg Guyana 21,178202416,786202314,7182022
Flag of Gabon.svg Gabon 21,013202420,516202320,1322022
Flag of Jamaica.svg Jamaica 20,098202419,423202317,0972022
Flag of Nicaragua.svg Nicaragua 18,829202417,829202315,6712022
Flag of Niger.svg Niger 18,816202416,819202315,4142022
Flag of Chad.svg Chad 18,697202413,149202316,7992022
Flag of Palestine.svg Palestine 18,602 [n 12] 202317,396 [n 12] 202319,111 [n 13] 2022
Flag of Moldova.svg Moldova 18,356 [n 14] 202416,539 [n 14] 202314,510 [n 14] 2022
Flag of Yemen.svg Yemen 16,940202411,0072022
Flag of Madagascar.svg Madagascar 16,465202416,032202314,9542022
Flag of Mauritius.svg Mauritius 16,359202414,397202312,8982022
Flag of North Macedonia.svg North Macedonia 15,873202414,761202313,7112022
Flag of Brunei.svg Brunei 15,510202415,128202316,6812022
Flag of the Republic of the Congo.svg Congo 15,501202415,321202315,3442022
Flag of Laos.svg Laos 15,190202415,843202315,3622022
Flag of North Korea.svg North Korea 15,1762022
Flag of the Taliban.svg Afghanistan 14,467202214,502202214,1742022
Flag of the Bahamas.svg Bahamas 14,390202414,339202312,8972022
Flag of Rwanda.svg Rwanda 13,701202414,098202313,3122022
Flag of Kyrgyzstan (2023).svg Kyrgyzstan 13,599202413,988202310,9302022
Flag of Tajikistan.svg Tajikistan 12,953202412,061202310,4922022
Flag of Somalia.svg Somalia 12,804202411,680202310,4202022
Flag of Namibia.svg Namibia 12,765202412,351202312,6072022
Flag of Kosovo.svg Kosovo 11,318202410,43820239,3972022
Flag of Malawi.svg Malawi 11,241202414,084202312,5582022
Flag of Equatorial Guinea.svg Equatorial Guinea 10,708202412,117202311,7672022
Flag of Mauritania.svg Mauritania 10,628202410,453202310,9972022
Flag of Togo.svg Togo 9,83220249,17120238,0872022
Flag of FLNKS.svg New Caledonia 9,62320229,6232022
Flag of Syria.svg Syria 8,980202118,5952022
Flag of Monaco.svg Monaco 8,78420228,7722022
Flag of Montenegro.svg Montenegro 8,01020247,40520236,2292022
Flag of Liechtenstein.svg Liechtenstein 7,36520227,7572022
Flag of Bermuda.svg Bermuda 7,82820227,5462022
Flag of Maldives.svg Maldives 7,19920246,60020236,1702022
Flag of Barbados.svg Barbados 6,86320246,39420235,6992022
Flag of the Cayman Islands.svg Cayman Islands 6,60120226,2812022
Flag of South Sudan.svg South Sudan 6,51720244,6162022
Flag of French Polynesia.svg French Polynesia 5,81520225,8142022
Flag of Fiji.svg Fiji 5,80120245,49520234,9792022
Flag of Eswatini.svg Eswatini 5,08520244,59820234,3262022
Flag of Liberia.svg Liberia 4,75420244,33220233,2652022
Flag of Sierra Leone.svg Sierra Leone 4,55820243,81020233,4812022
Flag of Djibouti.svg Djibouti 4,36420244,09920234,0032022
Flag of Suriname.svg Suriname 4,33720243,78220233,6202022
Flag of Aruba.svg Aruba 4,06920243,54520223,5442022
Flag of Andorra.svg Andorra 3,89720243,72820233,3762022
Flag of Belize.svg Belize 3,29620243,28220232,8302022
Flag of Greenland.svg Greenland 3,23620212,9262022
Flag of Bhutan.svg Bhutan 3,11020242,89820222,8982022
Flag of Curacao.svg Curaçao 3,07420223,0752022
Flag of Burundi.svg Burundi 3,07520242,64220234,0322022
Flag of the Central African Republic.svg Central African Republic 2,81020242,55520232,3952022
Flag of Cape Verde.svg Cape Verde 2,71820242,58720232,3142022
Flag of The Gambia.svg Gambia 2,69420242,34020232,2312022
Flag of Saint Lucia.svg Saint Lucia 2,58220242,52020232,1652022
Flag of Lesotho.svg Lesotho 2,39520242,04620232,2872022
Flag of Eritrea.svg Eritrea 2,3832022
Flag of Zanzibar.svg Zanzibar 2,3612022
Flag of Seychelles.svg Seychelles 2,20320242,14120231,9942022
Flag of Guinea-Bissau.svg Guinea-Bissau 2,15120241,96620231,5742022
Flag of Antigua and Barbuda.svg Antigua and Barbuda 2,12720242,03320231,7702022
Flag of San Marino.svg San Marino 2,03320241,85520211,7802022
Flag of East Timor.svg East Timor 1,99220242,24320233,2042022
Flag of the Solomon Islands.svg Solomon Islands 1,70720241,63120231,5972022
Flag of Sint Maarten.svg Sint Maarten 1,62320231,5722022
Flag of the Comoros.svg Comoros 1,42220241,35220231,2462022
Flag of Grenada.svg Grenada 1,40620241,32020231,1922022
Flag of Vanuatu.svg Vanuatu 1,28920241,12620239852022
Flag of the Turks and Caicos Islands.svg Turks and Caicos Islands 1,40220231,1382022
Flag of Saint Kitts and Nevis.svg Saint Kitts and Nevis 1,13420241,07720239792022
Flag of Saint Vincent and the Grenadines.svg Saint Vincent and the Grenadines 1,12820241,06620239462022
Flag of Samoa.svg Samoa 1,024202493420238572022
Flag of Sao Tome and Principe.svg São Tomé and Príncipe 751202460320235462022
Flag of Dominica.svg Dominica 708202465420236122022
Flag of Tonga.svg Tonga 581202450020224882022
Flag of the Federated States of Micronesia.svg Micronesia 484202446020234272022
Flag of Kiribati.svg Kiribati 311202427920232232022
Flag of Palau.svg Palau 308202426320232252022
Flag of the Marshall Islands.svg Marshall Islands 305202428420232792022
Flag of Nauru.svg Nauru 161202415420231472022
Flag of Tuvalu.svg Tuvalu 662024622023592022

See also

Countries:

Other entities:

Notes

  1. 1 2 3 Figures for China exclude Taiwan, and the special administrative regions of Hong Kong and Macau.
  2. Based on the best available GDP figure for each country at the time of creation (16 June 2024). Best available GDP figure was defined as the latest available figure from the International Monetary Fund (including forecasts for the current year), otherwise the latest available figure from the World Bank, otherwise the latest available figure from the United Nations Statistics Division; however, countries that didn't have any figure for a year more recent than 2019 were not included at all. For almost all countries, the latest IMF forecast figure for 2024 was used.
  3. Figures exclude the special administrative regions of Hong Kong and Macau.
  4. The name used in the IMF report is "Taiwan Province of China".
  5. The name used in the IMF report is "Hong Kong SAR".
  6. 1 2 3 Figures exclude the Autonomous Republic of Crimea and Sevastopol.
  7. Includes Western Sahara
  8. The UN figure excludes the autonomous region of Zanzibar.
  9. The name used in the IMF report is "Macao SAR".
  10. 1 2 3 Data are for the area controlled by the Government of the Republic of Cyprus.
  11. 1 2 3 Excludes Abkhazia and South Ossetia
  12. 1 2 The name used in the IMF and World Bank reports is "West Bank and Gaza".
  13. The name used by the UN is "State of Palestine".
  14. 1 2 3 Excludes data for Transnistria

Related Research Articles

The gross world product (GWP), also known as gross world income (GWI), is the combined gross national income of all the countries in the world. Because imports and exports balance exactly when considering the whole world, this also equals the total global gross domestic product (GDP). According to the World Bank, the 2013 nominal GWP was approximately 75.59 trillion United States dollars. In 2017, according to the CIA's World Factbook, the GWP was around $80.27 trillion in nominal terms and totaled approximately 127.8 trillion international dollars in terms of purchasing power parity (PPP). The per capita PPP GWP in 2017 was approximately 17,500 international dollars according to the World Factbook. According to the World Bank, the 2020 GWP in current dollars was approximately $84.705 trillion.

<span class="mw-page-title-main">Developed country</span> Country with a developed economy and infrastructure

A developed country, or advanced country, is a sovereign state that has a high quality of life, developed economy, and advanced technological infrastructure relative to other less industrialized nations. Most commonly, the criteria for evaluating the degree of economic development are the gross domestic product (GDP), gross national product (GNP), the per capita income, level of industrialization, amount of widespread infrastructure and general standard of living. Which criteria are to be used and which countries can be classified as being developed are subjects of debate. Different definitions of developed countries are provided by the International Monetary Fund and the World Bank; moreover, HDI ranking is used to reflect the composite index of life expectancy, education, and income per capita. Another commonly used measure of a developed country is the threshold of GDP (PPP) per capita of at least US$22,000. In 2023, 40 countries fit all four criteria, while an additional 15 countries fit three out of four.

<span class="mw-page-title-main">Economy of North America</span>

The economy of North America comprises more than 596 million people in its 24 sovereign states and 15 dependent territories. It is marked by a sharp division between the predominantly English speaking countries of Canada and the United States, which are among the wealthiest and most developed nations in the world, and countries of Central America and the Caribbean in the former Latin America that are less developed. Mexico and Caribbean nations of the Commonwealth of Nations are between the economic extremes of the development of North America.

This is a comparison between Argentine provinces and countries by gross domestic product (PPP) per capita. All data is for the year 2008.

<span class="mw-page-title-main">Historical GDP of China</span> Overview of economic growth and decline in the East Asian country

This article includes a list of China's historical gross domestic product (GDP) values, the market value of all final goods and services produced by a nation in a given year. The GDP dollar estimates presented here are either calculated at market or government official exchange rates (nominal), or derived from purchasing power parity (PPP) calculations. This article also includes historical GDP growth.

References

  1. 1 2 3 "World Economic Outlook Database, April 2024". IMF.org. International Monetary Fund. 16 April 2024. Retrieved 16 April 2024.
  2. "What is GDP and why is it so important?". Investopedia . IAC/InterActiveCorp. 26 February 2009. Archived from the original on 23 May 2016. Retrieved 23 May 2016.
  3. Moffatt, Mike. "A Beginner's Guide to Purchasing Power Parity Theory". About.com . IAC/InterActiveCorp. Archived from the original on 1 March 2017. Retrieved 31 May 2014.
  4. Ito, Takatoshi; Isard, Peter; Symansky, Steven (January 1999). "Economic Growth and Real Exchange Rate: An Overview of the Balassa-Samuelson Hypothesis in Asia" (PDF). Changes in Exchange Rates in Rapidly Development Countries: Theory, Practice, and Policy Issues. National Bureau of Economic Research. Archived (PDF) from the original on 28 March 2016. Retrieved 23 May 2016.
  5. Callen, Tim (28 March 2012). "Gross Domestic Product: An Economy's All". Finance & Development . International Monetary Fund. Archived from the original on 11 December 2021. Retrieved 31 May 2014.
  6. Frum, David (24 December 2014). "The Real Story of How America Became an Economic Superpower". The Atlantic. Archived from the original on 16 February 2022. Retrieved 16 February 2022.
  7. Matthews, Chris (5 October 2014). "5 Most Powerful Economic Empires of All Time". Fortune . Time, Inc. Archived from the original on 16 August 2016. Retrieved 23 May 2016.
  8. 1 2 Kroeber, Arthur R. (2016). China's Economy: What Everyone Needs to Know. New York, United States: Oxford University Press. ISBN   9780190239053. Archived from the original on 5 February 2021. Retrieved 28 May 2016.
  9. Kau, Michael Ying-mao (30 September 1993). China in the Era of Deng Xiaoping: A Decade of Reform. Studies on Contemporary China. Taylor & Francis. ISBN   9781563242786. Archived from the original on 5 February 2021. Retrieved 23 May 2016.
  10. Hu, Zuliu; Khan, Mohsin S. (April 1997). "Why Is China Growing So Fast?" (PDF). Economic Issues. International Monetary Fund. Archived (PDF) from the original on 16 April 2016. Retrieved 26 May 2016.
  11. "China GDP growth slows as population crisis, Covid-19 cloud economic outlook". South China Morning Post. 18 January 2022. Archived from the original on 5 December 2022. Retrieved 12 August 2022.
  12. Rodrik, Dani; et al. (March 2004). "From "Hindu Growth" to Productivity Surge: The Mystery of the Indian Growth Transition" (PDF). National Bureau of Economic Research. Archived (PDF) from the original on 27 March 2016. Retrieved 23 March 2016.
  13. "WEO Database, April 2024. Report for Selected Countries and Subjects: World, European Union". IMF.org. International Monetary Fund. 16 April 2024. Retrieved 16 April 2024.
  14. "GDP (current US$)". data.worldbank.org. Archived from the original on 13 June 2024. Retrieved 13 June 2024.
  15. "United Nations Statistics Division - National Accounts". unstats.un.org. Archived from the original on 13 June 2024. Retrieved 13 June 2024.