
The economy of Canada is a highly developed mixed economy, with the world's tenth-largest economy as of 2023, and a nominal GDP of approximately US$2.117 trillion. Canada is one of the world's largest trading nations, with a highly globalized economy. In 2021, Canadian trade in goods and services reached $2.016 trillion. Canada's exports totalled over $637 billion, while its imported goods were worth over $631 billion, of which approximately $391 billion originated from the United States. In 2018, Canada had a trade deficit in goods of $22 billion and a trade deficit in services of $25 billion. The Toronto Stock Exchange is the tenth-largest stock exchange in the world by market capitalization, listing over 1,500 companies with a combined market capitalization of over US$3 trillion.

Gross Domestic Product (GDP) is a monetary measure of the market value of all the final goods and services produced and rendered in a specific time period by a country or countries. GDP is often used to measure the economic health of a country or region. Definitions of GDP are maintained by several national and international economic organizations, such as the OECD and the International Monetary Fund.
In economics, the GDP deflator is a measure of the money price of all new, domestically produced, final goods and services in an economy in a year relative to the real value of them. It can be used as a measure of the value of money. GDP stands for gross domestic product, the total monetary value of all final goods and services produced within the territory of a country over a particular period of time.
The economies of Canada and the United States are similar because both are developed countries. While both countries feature in the top ten economies in the world in 2022, the U.S. is the largest economy in the world, with US$24.8 trillion, with Canada ranking ninth at US$2.2 trillion.

Crime in Canada is generally considered low overall. Under the Canadian constitution, the power to establish criminal law and rules of investigation is vested in the federal Parliament. The provinces share responsibility for law enforcement, and while the power to prosecute criminal offences is assigned to the federal government, responsibility for prosecutions is delegated to the provinces for most types of criminal offences. Laws and sentencing guidelines are uniform throughout the country, but provinces vary in their level of enforcement.

Alberta has experienced a relatively high rate of growth in recent years, due in large part to its economy. Between 2003 and 2004, the province saw high birthrates, relatively high immigration, and a high rate of interprovincial migration when compared to other provinces. Approximately 81% of the population live in urban areas and only about 19% live in rural areas. The Calgary–Edmonton Corridor is the most urbanized area in Alberta and is one of Canada's four most urban regions. Many of Alberta's cities and towns have also experienced high rates of growth in recent history. From a population of 73,022 in 1901, Alberta has grown to 4,262,635 in 2021 and in the process has gone from less than 1.5% of Canada's population to 11.5%. It is the fourth most populated province in Canada. Between the 2016 and 2021 censuses, the Alberta population grew by 4.8%.
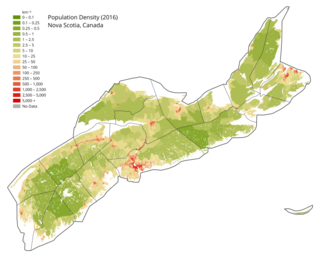
Nova Scotia is a Canadian province located on the country's southeastern coast. It is the most populous province in Atlantic Canada, and its capital, Halifax, is a major economic centre of the region. Geographically, Nova Scotia is the second smallest province in Canada, with an area of 52,824.71 km2 (20,395.73 sq mi). As of 2021, it has a population of 969,383 people.
Yukon is the westernmost of Canada's three northern territories. Its capital is Whitehorse. People from Yukon are known as Yukoners. Unlike in other Canadian provinces and territories, Statistics Canada uses the entire territory as a single at-large census division.
Income in India discusses the financial state in India. With rising economic growth and prosperity, India's income is also rising rapidly. As an overview, India's per capita net national income or NNI was around Rs. 98,374 in 2022-23. The per-capita income is a crude indicator of the prosperity of a country. In contrast, the gross national income at constant prices stood at over 128 trillion rupees. The same year, GRI growth rate at constant prices was around 6.6 percent. While GNI and NNI are both indicators for a country's economic performance and welfare, the GNI is related to the GDP or the Gross Domestic Product plus the net receipts from abroad, including wages and salaries, property income, net taxes and subsidies receivable from abroad. On the other hand, the NNI of a country is equal to its GNI net of depreciation.
In Canada, the federal government makes equalization payments to provincial governments of lesser fiscal capacity so that "reasonably comparable" levels of public services can be provided at similar levels of taxation. Equalization payments are entrenched in the Constitution Act of 1982, subsection 36(2).

The Saskatoon region is the greater metropolitan area of Saskatoon, Saskatchewan. As of 2021 the Statistics Canada estimates the region's population to be 317,480 people.
The demographics of Winnipeg reveal the city to be a typically Canadian one: multicultural and multilingual. Winnipeg is also prominent in the size and ratio of its First Nations population, which plays an important part in the city's makeup. About 12.4% of Winnipeggers are of Indigenous descent, which vastly exceeds the national average of 5.0%.
![Map of the Canadian provinces and territories by GDP in millions of Canadian dollars in 2021.
.mw-parser-output figure[typeof="mw:File/Thumb"] .image-key>ol{margin-left:1.3em;margin-top:0}.mw-parser-output figure[typeof="mw:File/Thumb"] .image-key>ul{margin-top:0}.mw-parser-output figure[typeof="mw:File/Thumb"] .image-key li{page-break-inside:avoid;break-inside:avoid-column}@media(min-width:300px){.mw-parser-output figure[typeof="mw:File/Thumb"] .image-key,.mw-parser-output figure[typeof="mw:File/Thumb"] .image-key-wide{column-count:2}.mw-parser-output figure[typeof="mw:File/Thumb"] .image-key-narrow{column-count:1}}@media(min-width:450px){.mw-parser-output figure[typeof="mw:File/Thumb"] .image-key-wide{column-count:3}}
.mw-parser-output .plainlist ol,.mw-parser-output .plainlist ul{line-height:inherit;list-style:none;margin:0;padding:0}.mw-parser-output .plainlist ol li,.mw-parser-output .plainlist ul li{margin-bottom:0}
.mw-parser-output .legend{page-break-inside:avoid;break-inside:avoid-column}.mw-parser-output .legend-color{display:inline-block;min-width:1.25em;height:1.25em;line-height:1.25;margin:1px 0;text-align:center;border:1px solid black;background-color:transparent;color:black}.mw-parser-output .legend-text{}
> 900,000
> 500,000
> 300,000
> 70,000
> 30,000
< 10,000 Canadian provinces and territories by GDP (2021).svg](http://upload.wikimedia.org/wikipedia/commons/thumb/a/a9/Canadian_provinces_and_territories_by_GDP_%282021%29.svg/290px-Canadian_provinces_and_territories_by_GDP_%282021%29.svg.png)