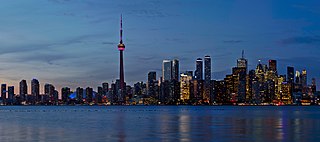
The economy of Canada is a highly developed mixed economy, with the world's tenth-largest economy as of 2023, and a nominal GDP of approximately US$2.117 trillion. Canada is one of the world's largest trading nations, with a highly globalized economy. In 2021, Canadian trade in goods and services reached $2.016 trillion. Canada's exports totalled over $637 billion, while its imported goods were worth over $631 billion, of which approximately $391 billion originated from the United States. In 2018, Canada had a trade deficit in goods of $22 billion and a trade deficit in services of $25 billion. The Toronto Stock Exchange is the tenth-largest stock exchange in the world by market capitalization, listing over 1,500 companies with a combined market capitalization of over US$3 trillion.
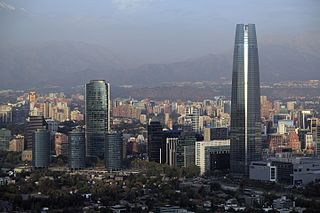
The economy of Chile is a market economy and high-income economy as ranked by the World Bank. The country is considered one of South America's most prosperous nations, leading the region in competitiveness, income per capita, globalization, economic freedom, and low perception of corruption. Although Chile has high economic inequality, as measured by the Gini index, it is close to the regional mean. Among OECD nations, Chile has a highly efficient and strong social security system; social welfare expenditure stood at roughly 19.6% of GDP.
The economy of Gibraltar consists largely of the services sector. While part of the European Union until Brexit, the British overseas territory of Gibraltar has a separate legal jurisdiction from the United Kingdom and a different tax system. The role of the UK Ministry of Defence, which at one time was Gibraltar's main source of income, has declined, with today's economy mainly based on shipping, tourism, financial services, and the Internet.
Purchasing power parity (PPP) is a measure of the price of specific goods in different countries and is used to compare the absolute purchasing power of the countries' currencies. PPP is effectively the ratio of the price of a market basket at one location divided by the price of the basket of goods at a different location. The PPP inflation and exchange rate may differ from the market exchange rate because of tariffs, and other transaction costs.
The economies of Canada and the United States are similar because both are developed countries. While both countries feature in the top ten economies in the world in 2022, the U.S. is the largest economy in the world, with US$24.8 trillion, with Canada ranking ninth at US$2.2 trillion.
The median income is the income amount that divides a population into two groups, half having an income above that amount, and half having an income below that amount. It may differ from the mean income. Both of these are ways of understanding income distribution.
The following are links to some international rankings of the United States.
Income in India discusses the financial state in India. With rising economic growth and prosperity, India's income is also rising rapidly. As an overview, India's per capita net national income or NNI was around Rs. 98,374 in 2022-23. The per-capita income is a crude indicator of the prosperity of a country. In contrast, the gross national income at constant prices stood at over 128 trillion rupees. The same year, GRI growth rate at constant prices was around 6.6 percent. While GNI and NNI are both indicators for a country's economic performance and welfare, the GNI is related to the GDP or the Gross Domestic Product plus the net receipts from abroad, including wages and salaries, property income, net taxes and subsidies receivable from abroad. On the other hand, the NNI of a country is equal to its GNI net of depreciation.
This is a comparison between Indian states and countries by gross domestic product (PPP). Many of the states of India have large GDP which would rank highly on a list of countries by GDP.
This article includes several ranked indicators for Chile's regions.

The Organisation for Economic Co-operation and Development is an intergovernmental organization with 38 member countries, founded in 1961 to stimulate economic progress and world trade. It is a forum whose member countries describe themselves as committed to democracy and the market economy, providing a platform to compare policy experiences, seek answers to common problems, identify good practices, and coordinate domestic and international policies of its members.