This is a list of Swedish Counties by GDP and GDP per capita.
Contents
This is a list of Swedish Counties by GDP and GDP per capita.
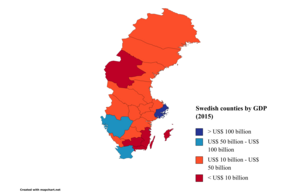
Counties by GDP in 2015 according to data by the OECD. [1]
| Rank | County | GDP (mil. SEK) | GDP (mil. Int$ (PPP) |
|---|---|---|---|
| 1 | Stockholm | 1,340,350 | 149,771 |
| 2 | Västra Götaland | 711,221 | 79,472 |
| 3 | Skåne | 478,497 | 53,468 |
| 4 | Östergötland | 166,511 | 18,606 |
| 5 | Uppsala | 142,126 | 15,881 |
| 6 | Jönköping | 128,246 | 14,330 |
| 7 | Örebro | 104,338 | 11,659 |
| 8 | Halland | 102,150 | 11,414 |
| 9 | Norrbotten | 101,841 | 11,380 |
| 10 | Dalarna | 99,110 | 11,075 |
| 11 | Västmanland | 96,013 | 10,729 |
| 12 | Västerbotten | 95,948 | 10,721 |
| 13 | Gävleborg | 94,891 | 10,603 |
| 14 | Västernorrland | 91,309 | 10,203 |
| 15 | Värmland | 90,692 | 10,134 |
| 16 | Södermanland | 86,763 | 9,695 |
| 17 | Kalmar | 78,364 | 8,756 |
| 18 | Kronoberg | 75,801 | 8,470 |
| 19 | Blekinge | 52,847 | 5,905 |
| 20 | Jämtland | 43,073 | 4,813 |
| 21 | Gotland | 18,810 | 2,102 |
| 4,199,860 | 469,296 |
Counties by GDP per capita in 2021 according to data by Statistics Sweden. [2]
| Rank | County | GDP per capita in SEK | GDP per capita in USD (PPP) [3] |
|---|---|---|---|
| 1 | Stockholm | 729,000 | 83,600 |
| 2 | Norrbotten | 648,000 | 74,300 |
| 3 | Västra Götaland | 517,000 | 59,300 |
| 4 | Kronoberg | 508,000 | 58,300 |
| 5 | Uppsala | 482,000 | 55,300 |
| 6 | Västerbotten | 473,000 | 54,200 |
| 7 | Jönköping | 472,000 | 54,100 |
| 8 | Västernorrland | 468,000 | 53,700 |
| 9 | Östergötland | 464,000 | 53,200 |
| 10 | Örebro | 456,000 | 52,300 |
| 11 | Skåne | 453,000 | 52,000 |
| 12 | Blekinge | 433,000 | 49,700 |
| 13 | Värmland | 426,000 | 48,900 |
| 14 | Dalarna | 425,000 | 48,700 |
| 15 | Jämtland | 422,000 | 48,300 |
| 16 | Västmanland | 415,000 | 47,600 |
| 17 | Halland | 409,000 | 46,900 |
| 18 | Gävleborg | 408,000 | 46,800 |
| 19 | Kalmar | 406,000 | 46,600 |
| 20 | Gotland | 379,000 | 43,500 |
| 21 | Södermanland | 378,000 | 43,300 |
| 527,000 | 60,400 |

Gross domestic product (GDP) is a monetary measure of the market value of all the final goods and services produced in a specific time period by a country or countries. GDP is more often used by the government of a single country to measure its economic health. Due to its complex and subjective nature, this measure is often revised before being considered a reliable indicator.
A developed country, or high-income country, is a sovereign state that has a high quality of life, developed economy, and advanced technological infrastructure relative to other less industrialized nations. Most commonly, the criteria for evaluating the degree of economic development are the gross domestic product (GDP), gross national product (GNP), the per capita income, level of industrialization, amount of widespread infrastructure and general standard of living. Which criteria are to be used and which countries can be classified as being developed are subjects of debate. Different definitions of developed countries are provided by the International Monetary Fund and the World Bank; moreover, HDI ranking is used to reflect the composite index of life expectancy, education, and income per capita. Another commonly used measure of a developed country is the threshold of GDP (PPP) per capita of at least US$22,000. In 2023, 40 countries fit all four criteria, while an additional 15 countries fit three out of four.

Stockholm County is a county on the Baltic Sea coast of Sweden. It borders Uppsala County and Södermanland County. It also borders Mälaren and the Baltic Sea. The city of Stockholm is the capital of Sweden. Stockholm County is divided by the historic provinces of Uppland (Roslagen) and Södermanland (Södertörn). More than one fifth of the Swedish population lives in the county. Stockholm County is also one of the statistical riksområden according to NUTS:SE, Nomenclature of Territorial Units for Statistics within the EU. With more than two million inhabitants, Stockholm is the most densely populated county of Sweden.

The 32 federal states of Mexico are ranked below according to population, size, population density, and GDP.
This is a list of first-level country subdivisions by nominal gross state product. This list shows top 100 largest subdivisions by GDP nominal and PPP. Those subdivisions which are the largest in their respective countries are shown in bold.
Income in India discusses the financial state in India. With rising economic growth and prosperity, India's income is also rising rapidly. As an overview, India's per capita net national income or NNI was around 9.97 lakh rupees in 2022. The per-capita income is a crude indicator of the prosperity of a country. In contrast, the gross national income at constant prices stood at over 128 trillion rupees. The same year, GRI growth rate at constant prices was around 6.6 percent. While GNI and NNI are both indicators for a country's economic performance and welfare, the GNI is related to the GDP or the Gross Domestic Product plus the net receipts from abroad, including wages and salaries, property income, net taxes and subsidies receivable from abroad. On the other hand, the NNI of a country is equal to its GNI net of depreciation.
This article includes several ranked indicators for Chile's regions.