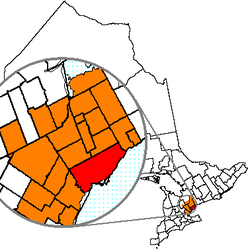
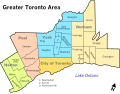
The Greater Toronto Area, commonly referred to as the GTA, includes Canada's most populous city, Toronto, and the regional municipalities of Durham, Halton, Peel, and York. In total, the region contains 25 urban, suburban, and rural municipalities.[3][4] The Greater Toronto Area begins in Burlington in Halton Region to the west, and extends along Lake Ontario past downtown Toronto eastward to Clarington in Durham Region.
According to the 2021 census, the Census Metropolitan Area (CMA) of Toronto has a total population of 6.202 million residents, making it Canada's most populous metropolitan area, and the 7th-largest in North America.[5] However, the Greater Toronto Area, which is an economic area defined by the Government of Ontario,[citation needed] includes communities that are not included in the CMA, as defined by Statistics Canada. Extrapolating the data for all 25 communities in the Greater Toronto Area from the 2021 Census, the total population for the economic region included 6,711,985 people.[citation needed]
The term "Greater Toronto" was first used in writing as early as the 1900s although at the time, the term referred only to the old city of Toronto and to its immediate townships and villages, which became Metropolitan Toronto in 1954 and became the current city of Toronto in 1998.[8] The use of the term involving the four surrounding regional municipalities came into formal use in the mid-1980s, when it was used in a widely discussed report on municipal governance restructuring in the region and was later made official as a provincial planning area. However, it did not come into everyday usage until the mid-to-late 1990s.
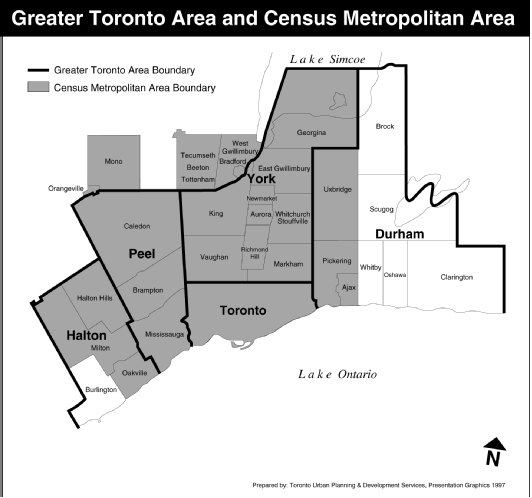
A map of Toronto's Census Metropolitan Area, which contains a large portion of the GTAToronto is the central city of the Greater Toronto Area.Mississauga is the largest city in Peel Region and the second-largest city in the Greater Toronto Area.Brampton, also in Peel Region, is the third-largest city in the Greater Toronto Area.Markham is the largest city in York Region and the fourth-largest city in the Greater Toronto Area.
Some municipalities considered part of the GTA are not within the Toronto Census Metropolitan Area (CMA), which is smaller than the land area and population of the GTA planning area. For example, Oshawa is the centre of its own CMA, yet deemed part of the Greater Toronto Area, while other municipalities, such as New Tecumseth in southern Simcoe County and Mono Township in Dufferin County are included in the Toronto CMA but not in the GTA.[11] These different border configurations result in the GTA's population being higher than the Toronto CMA by nearly one-half million people, often leading to confusion amongst people when trying to sort out Toronto's urban population.
Historically, the Greater Toronto Area was home to a number of First Nations who lived on the shore of Lake Ontario long before the first Europeans arrived in the region. At various times, the Neutral,[14] the Seneca, the Mohawk and the Huron nations were living in the vicinity.[15] The Mississaugas arrived in the late 17th or early 18th century, driving out the occupying Iroquois.[16][17] While it is unclear as to who was the first European to reach the Toronto area, there is no question it occurred in the 17th century.[18]
The first large influx of European settlers to settle the region were the United Empire Loyalists arriving after the American Revolution, when various individuals petitioned the Crown for land in and around the Toronto area.[18] In 1787, the British negotiated the purchase of more than a quarter million acres (1,000km2[390sqmi]) of land in the area of Toronto with the Mississaugas of New Credit.[21]York County, would later be created by Governor John Graves Simcoe in 1792, which would at its largest size, comprise all of what is now Halton Region, Toronto, Peel Region, York Region and parts of Durham Region.[22]
The GTA saw three American incursions during the War of 1812. The Town of York (present-day Toronto) was attacked by American forces at Battle of York, on April 27, 1813; and was subsequently occupied until May 8.[23] The second incursion occurred several months later, in July 1813, with two landings in the GTA. On July 29, American forces landed at Burlington Beach (present-day Burlington) in an attempt to dislodge British forces at the adjacent Burlington Heights.[24] However, finding the British forces too well-entrenched for any assault to be successful, the American naval force withdrew and proceeded east towards York. The American landings at York on July 31 went unopposed, with most of the soldiers garrisoned at York directed to defend Burlington Heights.[24] The third incursion occurred a year later, when an American naval squadron arrived outside of York's harbour on August 6, 1814. The squadron dispatched USSLady of the Lake to enter the harbour in order to gauge the town's defences, where it briefly exchanged cannon fire with Fort York before withdrawing to rejoin the American squadron outside the harbour. American forces did not attempt a landing during this incursion, although remained outside York's harbour for three days before departing.[24]
Although the original boundaries of York County encompassed nearly all of the GTA, by 1851, its boundaries had been reduced to the present-day City of Toronto and York Region as depicted on the 1871 map.
Since 1901
This article needs to be updated. Please help update this article to reflect recent events or newly available information.(August 2018)
The idea towards a streamlined local government to control local infrastructure was made as early as 1907 by, William Findlay Maclean, a member of parliament and founder of The Toronto World, who called for the expansion of the government of the former City of Toronto in order to create a Greater Toronto.[8] The idea for a single government municipality would not be seriously explored until the late 1940s when planners decided the city needed to incorporate its immediate suburbs. However, due to strong opposition from suburban politicians, a compromise was struck, which resulted in the creation of Metropolitan Toronto.[28] In 1953, the portion of York County south of Steeles Avenue, a concession road which formed a common boundary between several townships across the width of the county, was severed from it and incorporated as the Municipality of Metropolitan Toronto.[29] With the concession of Metro Toronto, the offices of York County were moved from Toronto to Newmarket.
Originally, the membership in Metropolitan Toronto included the City of Toronto and five townships: East York, Etobicoke, North York, Scarborough and York; as well as seven villages and towns, which became amalgamated into their surrounding townships in 1967.[30] The early Metro Toronto government debated over the annexation of surrounding townships of Markham, Pickering and Vaughan. Frederick Goldwin Gardiner, the first Metro Toronto Chairman, planned on the conversion of these townships into boroughs of the Metro Toronto government.[31] In 1971, the remaining areas of York County was replaced by the Ontario government with the Regional Municipality of York.[30] In 1974, Ontario and Durham Counties were reorganized to become the Regional Municipality of Durham; Pickering west of Rouge River was transferred to Scarborough at that time. Peel County became Peel Region in 1974 as well. In 1980, North York would be incorporated into a city, with York following suit in 1983 and Etobicoke and Scarborough in 1984, although still part of the Metropolitan Toronto municipal government.[30]
Satellite image of Toronto and Mississauga during the mid-1980s
In 1992, the Ontario government passed legislation requiring Metropolitan Toronto to include the rest of the Greater Toronto Area into its planning.[32] However, there was fear different parts of the municipal system were working against one another. Therefore, Bob Rae, the Premier of Ontario, appointed Anne Golden to head a GTA task force to govern the region's quality of life, competitiveness and governance.[33] During this time, the Metro Toronto government advocated to the task force the creation of a new GTA authority, which would be made up of 21 of the 30 existing municipalities in the GTA at the time. The proposal from Metro Toronto would have resulted in 15 new municipalities. The City of Mississauga argued consolidation should take place only in such a way the new municipalities would have a population between 400,000 and 800,000.[34] The Town of Markham had similarly advocated municipal consolidation in York Region but opposed to complete consolidation into a single municipality. Municipal consolidation faced stiff opposition, however, from smaller communities such as Ajax, Milton, and the borough of East York.[35]
The task force's recommendation to eliminate the Metro Toronto government, and consolidate its remaining municipalities into an enlarged City of Toronto was completed in 1997 and became official in 1998, under the Common Sense Revolution of the then premier, Mike Harris.[36] However, the task force's recommendation to create a GTA-wide upper-tier municipality was not taken up by the Harris government for fear that a GTA-wide municipality would recreate the intermunicipal competitiveness that was believed to have impaired the former Metro Toronto government.[37]
Metrolinx, an agency of the Government of Ontario, was established to oversee public transit development across the Greater Toronto Area.
Vast parts of the region remain farmland and forests, making it one of the distinctive features of the geography of the GTA. Most of the urban areas in the GTA hold large urban forest. For the most part designated as parkland, the ravines are largely undeveloped. Rouge Park is also one of the largest nature parks within the core of a metropolitan area.[39] Much of these areas also constitute the Toronto ravine system, which consists of deep and steep valleys, and a number of conservation areas in the region which are managed by Toronto and Region Conservation Authority.[40] The Cheltenham Badlands, in Caledon, is an example of environmental degradation from poor agricultural practice. The Scarborough Bluffs are part of the Glacial Lake Iroquois shoreline.
In 2005, the Government of Ontario also passed legislation to prevent urban development and sprawl on environmentally sensitiveland in the Greater Toronto Area, known as the Greenbelt; many of the areas include protected sections of the Oak Ridges Moraine, Rouge Park, and the Niagara Escarpment.[41] Nevertheless, low-density suburban developments continue to be built, some of which is on or near ecologically sensitive and protected areas. The provincial government attempted to address the issue through the "Places to Grow" legislation passed in 2005, which emphasizes higher-density growth in existing urban centres over the next 25 years (i.e., until 2030).[42]
Climate
The climate of the Greater Toronto Area is classified as humid continental, according to the Köppen climate classification. Much of the Greater Toronto Area is under Köppen Dfb (warm summer subtype) zone. Old Toronto (excluding the Toronto Islands) and some areas between there and Burlington to the southwest are under the Köppen Dfa climate zone, the hot summer subtype; this is the result of the urban heat island effect, especially in Old Toronto. Precipitation averages 832 millimetres (32.8 inches) annually, which is fairly distributed through the year but is driest in later winter with higher average totals in the later summer.
In winter, typical high temperatures will range from −5 to 3°C (23 to 37°F) and low temperatures from −12 to −5°C (10 to 23°F). Cold arctic outbreaks keep daytime highs below −10°C (14°F) for several days but that does not occur in every winter, and low temperatures sometimes drop below −18°C (0°F), with the accompanying wind chill making that feel much colder. Annual snowfall averages between 80 and 150 centimetres (31 and 59 inches) across the area. Mild and snow-free spells are also a feature of Toronto's winter, with temperatures surpassing 5°C (41°F) for several days to occasionally above 15°C (59°F). Spring is short and often cool to mild, and snow can sometimes fall well into April but rarely accumulates. The transition from spring into summer can be rapid. Summer is warm on average to hot and moderately humid with high temperatures typically between 24 and 31°C (75 and 88°F), while low temperatures average between 15°C (59°F) in the suburbs and 18 to 20°C (64 to 68°F) downtown and near the lake. Although fairly sunny, summers have long stretches of humid conditions that give rise to frequent thunderstorm activity, and very heavy rainfall sometimes results in flash flooding. Heat wave conditions with temperatures between 32 and 35°C (90 and 95°F) are common but typically do not last long, and rarely temperatures rarely reach 38°C (100°F). Humidex values can be high during heat episodes; at their highest, they have exceeded 50°C (122°F). Immediate lakeshore locations have generally lower average maximum temperatures but they can also experience hot conditions when offshore winds prevail. Normally, autumns alternate between wet and dry with lengthy periods of mild and calm weather. Temperatures fall and windspeeds increase sharply in November. By December, cold and snowy weather is more common, and the average temperature falls close to or just below 0°C (32°F).
This section needs to be updated. Please help update this article to reflect recent events or newly available information.(December 2015)
The Greater Toronto Area is a commercial, distribution, financial and economic centre and is the second-largest financial centre in North America.[63] The region generates about a fifth of Canada's GDP and is home to 40 per cent of Canada's business headquarters.[64][65] The economies of the municipalities in Greater Toronto are largely intertwined.[66] The work force is made up of approximately 2.9million people and more than 100,000 companies[67] The Greater Toronto Area produces nearly 20 per cent of the entire nation's GDP with $323billion, and from 1992 to 2002, experienced an average GDP growth rate of 4.0 per cent and a job creation rate of 2.4 per cent (compared with the national average GDP growth rate of 3 per cent and job creation rate of 1.6 per cent).[64][68] The Greater Toronto Area has the largest regional economy in Canada, with its GDP surpassing the Province of Quebec in 2015.[citation needed]
A worker at Oakville Assembly installs a battery on a Ford Flex. In 2010, the automotive industry accounted for roughly 10 per cent of Greater Toronto's GDP.
In 2010, over 51 per cent of the labour force in the Greater Toronto Area is employed in the service sector, with 19% in the manufacturing, 17% of the labour force employed in wholesale & retail trade, 8% of the labour force involved in transportation, communication and utilities, and 5% of the workforce is involved in construction.[69] Although the service industry makes up only 51% of Greater Toronto's workforce, over 72% of the region's GDP is generated by service industries.[64]
The largest industry in the Greater Toronto Area is the financial services in the province, accounting for an estimated 25% of the region's GDP.[64] Notably, the five largest banks in Canada all have their operational headquarters in Toronto's Financial District.[70] Toronto is also home to the headquarters of the Toronto Stock Exchange and the Standard and Poor TSX Composite Index and offices of the TSX Venture Exchange.[70] The TMX Group, the owners and operators of TSX Exchanges as well as the Montreal Exchange, are also headquartered in Toronto. The TSX and the TSX Venture Exchange represent 3,369 companies, including more than half of the world's publicly traded mining companies.[70]
Markham also attracted the highest concentration of high tech companies in Canada, and because of it, has positioned itself as Canada's High-Tech Capital.[71] The Greater Toronto Area is the second-largest automotive centre in North America (after Detroit). Currently,[when?]General Motors, Ford and Chrysler run six assembly plants in the area, with Honda and Toyota having assembly plants just outside the GTA. General Motors, Ford, Honda, KIA, Mazda, Suzuki, Nissan, Volkswagen, Toyota, Hyundai, Aston Martin, Jaguar, Land Rover, Subaru, Volvo, BMW, and Mitsubishi have chosen the Greater Toronto Area for their Canadian headquarters.[72]Magna International, the world's most diversified car supplier,[73] also has its headquarters in Aurora.[74] The automobile industry accounts for roughly 10% of the region's GDP.[64]
Agriculture
A farm in Caledon. There were 3,707 farms in the Greater Toronto Area according to the 2006 census.
While it was once the most dominant industry for residents in the Greater Toronto Area, agriculture now occupies a small percentage of the population though it is still a large part of land in the surrounding four regional municipalities. Census data from 2006 has shown there are 3,707 census farms in the GTA, down 4.2 percent from 2001 and covering 274,363ha (677,970 acres).[75] Almost every community in the GTA is currently experiencing a decrease in the acreage of farmland, with Mississauga seeing the most significant one. The only communities in the GTA that are experiencing a growth in the acreage of farmland are Aurora, Georgina, Newmarket, Oshawa, Richmond Hill, and Scugog, with Markham experiencing no growth or decline.[76] Most of the GTA's farmland is in Durham Region, with 55 per cent of their total land area being farmland. This is followed by York Region with 41 per cent of their lands being farmland, Peel Region with 34 percent, and Halton Region with 41 percent.[76] Toronto's remaining farmland is completely within Rouge Park in the Rouge Valley. The average size of the farm in the GTA (74 hectares [183 acres]) is much lower than the farms in the rest of Ontario (averaging 94 hectares [233 acres]). This has been attributed to the shift of farm types in the GTA from the traditional livestock and cash crop farms (requiring an extensive land base), towards more intensive enterprises including greenhouse, floriculture, nursery, vegetable, fruit, sheep and goats.[75]
The most numerous farm types in the GTA are miscellaneous specialty farms (including horse and pony, sheep and lamb, and other livestock specialty), followed by cattle, grain and oilseed, dairy and field crop farms.[76] Although the output of dairy production has dropped with farms from within the GTA, dairy has remained the most productive sector in the agricultural industry by annual gross farm receipts.[76] Despite the decreased amount of farmland around the region, farm capital value increased from $5.2billion in 1996 to $6.1billion in 2001, making the average farm capital value in the GTA continued to be the highest in the province.[76]
There are several public transportation operators within the Greater Toronto Area that provide services within their jurisdictions. While those operators are largely independent, provisions are being made to integrate them under Metrolinx, which manages transportation planning including public transport in the Greater Toronto and Hamilton Area.[77]GO Transit, which merged with Metrolinx during the late 2000s, is Ontario's only intra-regional public transit service, linking the communities in the GTA and the city of Hamilton, as well as the rest of the Greater Golden Horseshoe.[78] The implementation of the Presto card by Metrolinx has created a common means for all fare payments and allows for seamless connection between these and other transit operators.[79]
Highway 401 serves as a major roadway in the Greater Toronto Area.
The GTA also consists of several King's Highways and is supplemented by municipal expressways. One of the principal highways in the GTA, Highway 401, is also the longest in Ontario and is also one of the widest and busiest highways in the world.[81] Notably, a segment of the highway passing through the GTA is North America's busiest highway.[82] The GTA is laced with a number of limited-access highways including the 400-series highways. These include:[83]
The Greater Toronto Airport Authority has also placed a tentative proposal to develop a new airport in Pickering, which would also extend over into Markham and Uxbridge.[90] As the GTAA predicts Toronto Pearson would be unable to be the sole provider for the bulk of Toronto's commercial air traffic in the next 20 years from the report's publication in 2004 (i.e. in 2024), it believes that a new airport in Pickering would address the need for a regional/reliever airport east of Toronto Pearson and complement the airport in Hamilton, Ontario.[91] The GTAA also stated the new airport would create more opportunities for economic development in the eastern region of the Greater Toronto Area.[91] However, demand for the new airport lessened because of the COVID-19 pandemic and its aftermath, as well as the planned Alto high-speed rail network, which would eliminate many short-haul flights along the route between Toronto and Quebec City.
The Greater Toronto Area is served by seven distinct telephone area codes. Before 1993, the GTA used the 416 area code. In a 1993 zone split, Metropolitan Toronto retained the 416 code, while the other municipalities of the Greater Toronto Area were assigned the new area code 905.[92] This division by area code has become part of the local culture to the point where local media refer to something inside Toronto as "the 416" and outside of Toronto as "the 905".[93] For example, the Raptors 905 basketball team in the NBA G League is named after the area code the team represents. Though for the most part, the use of the area 905 as shorthand for the suburban areas outside Toronto city limits was correct, it is not entirely true as some portions of Durham and York Regions use the 705 area code.[94] Furthermore, there are areas, such as Hamilton, the Regional Municipality of Niagara and Port Hope (in Northumberland County) that use the 905 area code, but are not part of the GTA.[94] The unincorporated community of Acton (in Halton Hills), is the only community in the GTA that uses the 519 area code, which covers most of Southwestern Ontario.[95][96]
To meet the increased demand for phone numbers, two overlay area codes were introduced in 2001. Area code 647 (supplementing the 416 area code)[97] was introduced in March 2001 and area code 289 (supplementing the 905 area code) was introduced in July 2001.[98] Some individuals within the 905 area code region may have to dial long distance to reach each other; although residents of Mississauga and Hamilton share the same area code (905), an individual from Toronto, for example, would have to dial "1" to reach Hamilton, but not to reach Mississauga. Ten-digit telephone dialling, including the area code for local calls, is required throughout the GTA.[98] In March 2013, two additional area codes were introduced to the GTA: area code 437 in Toronto and area code 365 in the area served by 905 and 289.[99]
Federally, the Conservatives, Liberals, and the New Democrats (NDP) all hold several electoral districts in the GTA. The City of Toronto has often been supportive of the Liberal Party. Traditionally, Liberal support is strongest in Downtown Toronto, while Conservative support is stronger in the surrounding communities outside Toronto. The NDP also has a strong base within the GTA.[101] The Greater Toronto Area has the ability to influence election results and determine the governing party in Canada, due in part to its large population and riding count.[102]
From 1993 to 2011, a centre-right party failed to win a single seat in the former Metro Toronto.[citation needed] In the 2011 election, however, a surge in NDP support combined with a collapse in Liberal support allowed the Conservatives to win eight seats in Toronto itself, and another 24 in the suburbs.[citation needed] Toronto's political leanings now appeared to mirror those of surrounding communities that leaned toward the Conservatives.[citation needed]
The election of 2011 showed Liberal support, based on votes in the GTA, had collapsed from 43.7% to 30.6%, giving the Liberals only 14.9% of the local seats in the House of Commons. However, the support of the Conservatives and NDP increased accordingly, with the Conservatives increasing their vote share from 31.5% to 42.2% (and capturing 68.1% of the GTA seats) and the NDP increasing from 14.6% to 23.2% of the vote and 17% of the local Federal ridings.[citation needed]
In the 2015 federal election, the Liberals regained their dominance of the GTA after suffering devastating losses there four years earlier. They defeated a number of prominent incumbents from both the NDP and the Conservatives. The Liberals took all of Toronto itself. They also took back almost all of the suburban ridings they had lost in 2011. Both the NDP and the Conservatives suffered heavily as their support collapsed in the inner city and the suburbs respectively. Only a few Conservatives held onto their seats in the outer ring of the GTA, while the NDP failed to elect any MPs in this area.[103] The 2019, 2021 and 2025 federal elections have similar results.
On the provincial level of government, the Ontario Progressive Conservatives (PCs), Ontario Liberals, and the Ontario New Democrats all hold electoral districts in the GTA.[104] While the GTA provided a strong base of support for the Progressive Conservative government between 1995 and 2003, the Ontario Liberal Party achieved a major victory in the GTA during the 2003 election and has enjoyed strong support from the region ever since.[105] In the 2011 election, the Liberals won 33 of the 44 available seats in the GTA, allowing Premier Dalton McGuinty to hold onto a minority government. The 2014 election under McGuinty's successor, Kathleen Wynne, was an even bigger electoral landslide for the Liberals, as they won 38 seats in the region. They even took several ridings in territory that had voted PC for decades, like Durham, Burlington, Newmarket-Aurora and Halton. The PCs hold no seats in Peel Region and only one seat in each of the Halton, York, and Durham regions. While the NDP has been weak in the GTA since the 1995 election, it has seen some successes in Brampton and Durham Region, where they hold one seat each.
The Progressive Conservative Party of Ontario did not win a riding in the City of Toronto during a general election from 1999 to 2018.[106] On the other end of the spectrum, the NDP saw major losses in Toronto during the 2014 election and held only two seats in the city. That is no longer the case since the 2018 provincial election, as the Progressive Conservatives and the NDP made significant gains at the expense of the Liberals; that continues to hold true in the 2022 and 2025 provincial elections.
Municipal politics
In 2011, 244 politicians govern the Greater Toronto Area below the provincial and federal levels, holding offices in cities, towns, and regional municipalities.[107] There are no political parties at the municipal level in the Greater Toronto Area. Unusual for a large North American urban agglomeration, the GTA has very few agencies with powers that can cross boundaries. Attempts to create an interregional organization have been made, such as the Province of Ontario's Office of the Greater Toronto Area (OGTA) in 1988[108] and the Greater Toronto Services Board (GTSB) in 1998,[109][110] but they have failed by the lack of real authority in those agencies.[110][111]
According to the latest census data from 2021 from Statistics Canada, the population of this area is 6,712,341. Population growth studies have projected the City of Toronto's population in 2031 to be 3,000,000 and the Greater Toronto Area's population to be 7,450,000,[114] while the Ontario Ministry of Finance states it could reach 7.7million by 2025.[115] Statistics Canada identified in 2001 that four major urban regions in Canada exhibited a cluster pattern of concentrated population growth among which included the Greater Golden Horseshoe Census Region, which includes all of the Greater Toronto Area (which includes Oshawa), as well as other Southern Ontario cities including Hamilton, Guelph, Barrie, and the cities in Niagara Region and Waterloo Region. Combined, the Greater Golden Horseshoe has a population of 9,765,188 in 2021, containing over 20 per cent of Canada's population.
Distribution of visible minority groups in the Toronto CMA in the 2021 census.
South Asians
Black
Chinese
Filipinos
Arabs
Latin Americans
Southeast Asians (excluding Filipinos)
West Asians (excluding Arabs)
Immigration
In 2009, the Toronto CMA also has one of the largest proportions of foreign-born residents (46 per cent) as a share of the total population out of all metropolitan areas in the Organization for Economic Co-operation and Development (OECD). The Toronto region is also unusually diverse in the composition of its ethnicities. The four largest foreign-born populations of Toronto constitute only 15 per cent of the total foreign-born population. That is opposed to the four largest foreign-born populations of other metropolitan areas such as New York City and London, where they make up 25 per cent of their respective foreign-born populations.[65]
There are presently twelve public English first languageschool boards, and two French first language school boards operating within the GTA. Seven of these school boards operate secular schools, whereas the other seven operate separate schools; the seven separate school boards in the Greater Toronto Area all serve the Roman Catholic faith. In addition to public schools, there are also many private schools that operate within Greater Toronto.
Three of these GTA-based public school boards also manage institutions outside Greater Toronto, the two French first language school boards, based in Toronto, as well as the Dufferin-Peel Catholic District School Board (DPCDSB). Conversely, English first language public schools in Clarington, a municipality within Durham Region, are managed by school boards based outside the GTA.
The Greater Toronto Area is also home to six publicly funded colleges[156] that have campuses spread in and around the metropolitan area. The six publicly funded colleges based in the Greater Toronto Area include:
Another publicly funded college, Collège Boréal, also maintains a satellite campus in Toronto. However, Collège Boréal's main campus and administration is based outside the GTA, in Greater Sudbury. In addition to publicly funded colleges, there are also many private career colleges spread throughout the Greater Toronto Area.[157]
Universities
The University of Toronto, which was established in 1827, is the largest higher education institution in Canada. Building shown is 1 Spadina Crescent before renovation in the late 2010s.
The Greater Toronto Area is home to six publicly funded universities. Universities based within Greater Toronto include:[158]
↑Humidex, wind chill, average rain, average snow, rain days, snow days, and sunshine are from 1981 to 2010
↑Maximum and minimum temperature data at The Annex was recorded by human observers from March 1840 to June 2003 under the station name "TORONTO". From July 2003 to present, climate data has been recorded by an automatic weather station under the name "TORONTO CITY".[43]
↑Statistic includes all persons that did not make up part of a visible minority or an indigenous identity.
↑Statistic includes total responses of "Chinese", "Korean", and "Japanese" under visible minority section on census.
↑Statistic includes total responses of "Filipino" and "Southeast Asian" under visible minority section on census.
↑Statistic includes total responses of "West Asian" and "Arab" under visible minority section on census.
↑Statistic includes total responses of "Visible minority, n.i.e." and "Multiple visible minorities" under visible minority section on census.
12The school board is based outside the GTA, although it operates schools in Clarington, a municipality in Durham Region. In addition to Clarington, the school board also operates institutions in the City of Peterborough, Peterborough County, Northumberland County, and parts of Hastings County.
↑In addition to Peel Region, the school board oversees schools in Dufferin County.
↑In addition to the Greater Toronto Area, Durham College also operates a campus in Cobourg and Port Hope, two municipalities situated outside the Greater Toronto Area.
↑In addition to the Greater Toronto Area, Humber Polytechnic also operates a campus in Orangeville, a municipality situated outside the Greater Toronto Area.
↑In addition to the Greater Toronto Area, Seneca Polytechnic also operates a campus in Peterborough, a municipality situated outside Greater Toronto Area.
↑The Université de l'Ontario français was formally established in April 2018, although it is not expected to accept its first cohort of full-time students until 2021.
12"About Us". Metrolinx Website. Metrolinx. Archived from the original on May 5, 2010. Retrieved February 26, 2010.
↑"Planning for Growth"(PDF). Understanding the Growth Plan for the Greater Golden Horseshoe. Ministry of Public Infrastructure Renewal. Archived from the original(PDF) on July 6, 2011.
↑The Ojibwa-Iroquois War: The War the Five Nations Did Not Win. Leroy V. Eid. Ethnohistory, Vol. 26, No. 4 (Autumn, 1979), Duke University Press, pp. 297–324
↑Schmalz, Peter S., The Ojibwa of Southern Ontario. University of Toronto Press. ISBN0-8020-2736-9. pp 21–22
↑Robert M. Stamp (1991). "The Road to Rebellion". Tories and Reformers. Town of Richmond Hill Public Library. Archived from the original on September 28, 2011. Retrieved February 7, 2010.
↑Rose, Albert "Governing metropolitan Toronto: a social and political analysis, 1953–1971" Institute of Governmental Studies; University of California Press; 1st edition, ISBN0-520-02041-3 p.107, 166
↑Fletcher, Thomas Hobbs "From Love Canal to environmental justice: the politics of hazardous waste on the Canada-U.S. border" University of Toronto Press, ISBN1-55111-434-8 p28
↑Sanction, Andrew "Merger mania: the assault on local government" McGill-Queen's Press, ISBN0-7735-2163-1 p.114
↑Sanction, Andrew "Merger mania: the assault on local government" McGill-Queen's Press, ISBN0-7735-2163-1 p.115
↑Sanction, Andrew "Merger mania: the assault on local government" McGill-Queen's Press, ISBN0-7735-2163-1 p.116
↑Sanction, Andrew "Merger mania: the assault on local government" McGill-Queen's Press, ISBN0-7735-2163-1 p.121
↑Population and land area figures for Toronto and the regional municipalities come from the 2006 Canadian census: Archived September 6, 2007, at the Wayback Machine .
12"Toronto (City)". 1991 to 2020 Canadian Climate Normals. Environment and Climate Change Canada. March 27, 2024. Climate ID: 6158350. Retrieved May 6, 2024.
↑"Toronto". 1981 to 2010 Canadian Climate Normals. Environment and Climate Change Canada. September 18, 2023. Climate ID: 6158350. Archived from the original on September 25, 2023. Retrieved September 27, 2023.
↑"Bowmanville Mostert". Canadian Climate Normals 1981-2010 Station Data. Environment and Climate Change Canada. Retrieved October 22, 2021.
↑Ministry of Education, Ontario (2010). "About the Ministry". Government of Ontario. Queen's Printer for Ontario, 2010. Archived from the original on December 20, 2010. Retrieved December 14, 2010.
↑Ministry of Training, Colleges; Universities, Ontario (2010). "Welcome to TCU". Government of Ontario. Queen's Printer for Ontario, 2010. Archived from the original on December 21, 2010. Retrieved December 14, 2010.
↑"Getting to Know Ontario's Colleges". Ministry of Training, Colleges, and Universities. Find a College. Queen's Printer, Ontario. January 1, 2010. Archived from the original on February 26, 2010. Retrieved February 23, 2010.
↑"Private Career Colleges (PCC)". Ministry of Training, Colleges, and Universities. Queen's Printer, Ontario. November 18, 2007. Archived from the original on February 24, 2010. Retrieved February 28, 2010.
↑"Getting to Know Ontario's Universities". Ministry of Training, Colleges, and Universities. Finding a University. Queen's Printer, Ontario. April 24, 2009. Archived from the original on February 18, 2010. Retrieved February 23, 2010.
↑Office of Public Relations, McMaster University (June 17, 2009). "Celebrating expansion into Burlington". McMaster Daily News. McMaster University. Archived from the original on July 6, 2011. Retrieved May 6, 2011.
↑University of Guelph and Humber Institute of Technology and Advanced Learning (2005). "bout the University of Guelph-Humber". University of Guelph-Humber. Archived from the original on July 24, 2010. Retrieved December 10, 2018.
This page is based on this Wikipedia article Text is available under the CC BY-SA 4.0 license; additional terms may apply. Images, videos and audio are available under their respective licenses.


 South Asians
 Black
Black Chinese
 Filipinos
 Arabs
Arabs Latin Americans
 Southeast Asians (excluding Filipinos)
 West Asians (excluding Arabs)


