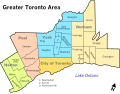
Halton is part of the Greater Toronto Area (GTA), although it is the only regional municipality in the GTA that is not situated directly adjacent to Toronto's city proper. However, the region is split between the census metropolitan areas (CMAs) of Toronto and Hamilton. Burlington is part of the Hamilton CMA, while the rest of the region is part of the Toronto CMA.
Halton experienced a growth rate of 17.1% between 2001 and 2006, and 14.2% between 2006 and 2011, giving it one of the highest growth rates in the country. Despite the unprecedented growth in residential development, agriculture and protected lands along the Niagara Escarpment are still the predominant land uses in the region. Halton has been ranked by Maclean's national crime ranking report as being the "safest place to live" in the GTA and one of the top five in Canada.[4]
History
The Regional Municipality of Halton was established on 1 January 1974 as the successor to the former Halton County by the Regional Municipality of Halton Act, 1973.[5] From 1 January 2003, it has been governed by the Municipal Act.[6]
Until the 2000 municipal elections, the chairperson of the regional council had been appointed by the Ontario government. From that date, it has been an elective position. Joyce Savoline was the last appointed chairperson, and was elected and reelected until her retirement from the position in 2006. The current regional chairperson is Gary Carr.
Regional council
The council consists of the elected chairperson, the mayors of the local municipalities, and regional councillors elected by wards from the local municipalities (who also sit on their respective municipal councils).
The current membership of the council is as follows:[citation needed]
In 2018, the Region had 27 emergency vehicles and 254 paramedics; the latter answered 53,094 paramedic calls. The Police service had 721 police officers; its 911 call centre received 121,971 reports of emergency.[8]
Fraud and corruption cases
Between 2016 and 2019, several high-ranking employees in Halton Region's water and wastewater division were convicted in two major fraud and corruption schemes that cost the municipality millions of dollars.
David Ohashi case
In January 2016, David Ohashi, the former manager of Plant Capital and Engineering, was dismissed following an internal investigation into irregular bidding processes. In 2019, Ohashi was convicted of fraud over $5,000 and uttering a forged document. The investigation revealed that between 2010 and 2016, Ohashi provided confidential bidding information to specific contractors in exchange for personal benefits, including travel and luxury items. While the jury found him guilty of fraud, the presiding judge later noted there was no proof of direct financial gain for Ohashi personally, leading to a suspended sentence and 18 months of probation.
Nicolas Rewa and Sirron Systems
A second, larger investigation began in 2015 involving Nicolas Rewa, the region's former Public Works Manager. Rewa was found to have defrauded the Region of approximately $770,000 between 2008 and 2017 by awarding service contracts to Hamilton-based Sirron Systems Inc. for non-existent supplies and labour. In 2018, Rewa pleaded guilty to fraud-related charges and was sentenced to three years in prison. He was also ordered to forfeit over $2 million in assets to the region. David Norris, the head of Sirron Systems, was also convicted of fraud and corruption in 2019.
Regional reforms
Following these incidents, Halton Region conducted an extensive forensic audit and implemented mandatory fraud training for all staff. The region also updated its employee and vendor codes of conduct and launched civil litigation seeking over $20 million in damages from the parties involved.[9][10][11]
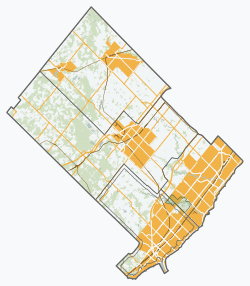
Geography
Identification of urban and rural features of the Region.
While the urban areas of Burlington, Oakville and Milton are experiencing rapid growth, there is still a significant proportion of the Region that is still rural, most of which is protected as part of the provincial Greenbelt or as part of the Niagara Escarpment Plan.
Halton is somewhat unusual, in that it has three distinct climate zones within its relatively small area,[12] which are as follows:
Zone 5a - Halton Hills lying to the north of the Niagara Escarpment, together with the Town of Milton within the Grand River watershed
Zone 5b - the remainder of Halton Hills, Milton north of Derry Road, and that part of Burlington lying north of the Niagara Escarpment
As a census division in the 2021 Census of Population conducted by Statistics Canada, the Regional Municipality of Halton had a population of 596,637 living in 208,601 of its 214,322 total private dwellings, a change of 8.8% from its 2016 population of 548,435. With a land area of 965.71km2 (372.86sqmi), it had a population density of 617.8/km2 (1,600.2/sqmi) in 2021. The unemployment rate was 5.3% during the year. The average household income was very high, at $121,000.[3]
Canada census – Regional Municipality of Halton community profile
Halton's agricultural sector is supported by regional infrastructure such as the Port of Hamilton which is a growing agri-food hub for the import of agricultural inputs and the export of local crops.
2018 economic report
The 2018 budget document contains additional specifics and updates as to the Region's finances. In that year, gross revenues were $1.2 billion while operating expenses totaled $821.5 million for a net revenue of $350.2 million, an increase of 1.2% over the previous year. The increase was mostly due to increases in grants and taxes. The Region included over 13,200 companies and employed over 229,000 persons. The credit rating of AAA was confirmed by S&P Global Ratings and Moody's Investors Service.[28]
This page is based on this Wikipedia article Text is available under the CC BY-SA 4.0 license; additional terms may apply. Images, videos and audio are available under their respective licenses.