East Asian Canadians

Last updated
East Asian Canadians
East Asian Canadians by census division.svg
East Asian ancestry % in Canada (2021)
Total population
2,289,805 [1] [2] [lower-alpha 1] [lower-alpha 2]
6.3% of the total Canadian population (2021)
Regions with significant populations
Southern Ontario, Metro Vancouver, Central Alberta, Montreal, Most urban areas
Languages
Canadian English  · Canadian French  ·
Mandarin  · Cantonese  · Korean  · Japanese  · Mongolian  · Min Nan  · Tibetan
Other East Asian Languages
Religion
Buddhism  · Chinese folk religion  · Christianity  · Confucianism  · Shintoism  · Taoism  · Irreligion
Related ethnic groups
East Asian diaspora
Chinese labourers working on the Canadian Pacific Railway, 1884 Chinese at work on CPR.jpg
Chinese labourers working on the Canadian Pacific Railway, 1884
Founding members of the Canadian Japanese Association at the Japanese Canadian War Memorial in Vancouver, 1920. Founding members of the Canadian Japanese Association at the Japanese Canadian War Memorial.jpeg
Founding members of the Canadian Japanese Association at the Japanese Canadian War Memorial in Vancouver, 1920.

East Asian Canadians are Canadians who were either born in or can trace their ancestry to East Asia. East Asian Canadians are also a subgroup of Asian Canadians. According to Statistics Canada, East Asian Canadians are considered visible minorities and can be further divided by on the basis of both ethnicity and nationality, such as Chinese Canadian, Hong Kong Canadian, Japanese Canadian, Korean Canadian, Mongolian Canadian, Taiwanese Canadian, or Tibetan Canadian, as seen on demi-decadal census data.

Contents

According to the 2021 Canadian census, 2,289,805 Canadians had trace their ancestry to East Asia, constituting 6.3 percent of the total population and 31.2 percent of the total Asian Canadian population. [1] [2] [lower-alpha 1] [lower-alpha 2] Additionally as of 2021, East Asians comprise the third largest pan-ethnic group in Canada after Europeans (69.8 percent) [3] and South Asians (7.1 percent). [2]

Terminology

For the census purposes and contemporary Canadian parlance, East Asian Canadians are typically identified and referred under the term "Asian"; popular usage of this term in Canada generally excludes both West and South Asians, both groups with ancestral origins in the Middle East and in the Indian subcontinent respectively, and instead solely referring to individuals of East Asian ancestry.

History

East Asian Canadian
Population History [lower-alpha 2]
YearPop.±%
20011,314,225    
20061,628,260+23.9%
20111,817,590+11.6%
20162,148,230+18.2%
20212,289,805 [lower-alpha 1] +6.6%
Source: Statistics Canada
[1] [2] [4] [5] [6] [7]

18th century

The first record of East Asians in what is known as Canada today can be dated back to 1788 when renegade British Captain John Meares hired a group of Chinese carpenters from Macau and employed them to build a ship at Nootka Sound, Vancouver Island, British Columbia. After the outpost was seized by Spanish forces, the eventual whereabouts of the carpenters was largely unknown.

19th century

In the mid-late 19th century, early settlers from East Asia (China and Japan) emigrated to Canada, predominantly settling in British Columbia.

During the mid-19th century, many Chinese arrived to take part in the British Columbia gold rushes. Beginning in 1858, early settlers formed Victoria's Chinatown and other Chinese communities in New Westminster, Yale, and Lillooet. Estimates indicate that about 1/3 of the non-native population of the Fraser goldfields was Chinese. [8] [9] Later, the construction of the Canadian Pacific Railway prompted another wave of immigration from the East Asian country. Mainly hailing from Guangdong, the Chinese helped build the Canadian Pacific Railway through the Fraser Canyon.

Many Japanese people also arrived in Canada during the mid to late 19th century and became fishermen and merchants in British Columbia. Early immigrants from the East Asian island nation most notably worked in canneries such as Steveston along the pacific coast.

By 1884, Nanaimo, New Westminster, Yale, and Victoria had the largest Chinese populations in the province. Other settlements such as Quesnelle Forks were majority Chinese and many early immigrants from the East Asian country settled on Vancouver Island, most notably in Cumberland. [10] In addition to work on the railway, most Chinese in the late 19th century British Columbia lived among other Chinese and worked in market gardens, coal mines, sawmills, and salmon canneries. [11]

In 1885, soon after the construction on the railway was completed, the federal government passed the Chinese Immigration Act, whereby the government began to charge a substantial head tax for each Chinese person trying to immigrate to Canada. A decade later, the fear of the "Yellow Peril" prompted the government of Mackenzie Bowell to pass an act forbidding any East Asian Canadian from voting or holding office. [12]

Many Chinese workers settled in Canada after the railway was constructed, however most could not bring the rest of their families, including immediate relatives, due to government restrictions and enormous processing fees. They established Chinatowns and societies in undesirable sections of the cities, such as East Pender Street in Vancouver, which had been the focus of the early city's red-light district until Chinese merchants took over the area from the 1890s onwards. [13]

20th century

Immigration restrictions stemming from anti-Asian sentiment in Canada continued during the early 20th century. Parliament voted to increase the Chinese head tax to $500 in 1902; this temporarily caused Chinese immigration to Canada to stop. However, in following years, Chinese immigration to Canada recommenced as many saved up money to pay the head tax.

Heightened anti-Asian sentiment resulted in the infamous anti-Asian pogrom in Vancouver in 1907. Spurred by similar riots in Bellingham targeting Punjabi Sikh South Asian settlers, The Asiatic Exclusion League organized attacks against homes and businesses owned by East Asian immigrants under the slogan "White Canada Forever!"; though no one was killed, much property damage was done and numerous East Asian Canadians (Chinese-Canadians and Japanese-Canadians) were beaten up.

In 1923, the federal government passed the Chinese Immigration Act of 1923, which banned all Chinese immigration, and led to immigration restrictions for all East Asians. In 1947, the act was repealed.

According to the 1931 Canadian census, subdivisions including Richmond (East Asians formed 40 percent of the total population), Skeena Coast (37 percent), Fraser Mills (34 percent), Cumberland (32 percent), Maple Ridge (27 percent), West Vancouver Island (27 percent), Mission (24 percent), Bella Coola Coast (24 percent), Duncan (18 percent), and Pitt Meadows (17 percent) had the largest East Asian concentrations in British Columbia. [14] :482

East Asian Canadian Population in British Columbia (1931 census) [14] :482
Subdivision Type
Population Percentage
Vancouver Urban 21,339
Victoria Urban3,999
Richmond Urban3,262
Maple Ridge Urban1,351
South Vancouver Island Rural 1,315
New Westminster Urban1,200
Skeena CoastRural955
Mission Urban868
Bella Coola CoastRural865
Upper Okanagan & Shuswap Rural809
Cumberland Urban769
West Vancouver Island Rural614
Surrey Urban596
Delta Urban567
Howe SoundRural529
South East Coast Vancouver Island Rural523
Nicola Rural475
North Cowichan Urban449
North East Coast Vancouver Island Rural442
Saanich Urban432
Nanaimo Urban420
Prince Rupert Urban390
Duncan Urban337
Kamloops Urban329
Kelowna Urban322
North Vancouver Island Rural279
Burnaby Urban266
Saltspring & Islands Rural266
Knight Inlet Coast Rural228
Vernon Urban218
Port Alberni Urban217
Fraser Mills Urban210
Matsqui Rural200
Powell River Coast Rural195
Nelson Urban176
Coquitlam Urban175
Upper Kootenay RiverRural173
Portland Canal-NassRural167
Similkameen RiverRural154
Lower Fraser ValleyRural151
Port MoodyUrban155
CranbrookUrban147
Pitt MeadowsUrban145
North VancouverRural126
ChilliwackRural119
ArmstrongUrban107
RevelstokeUrban106
TrailUrban102
Upper Columbia RiverRural93
Kootenay & Slocan LakesRural91
SummerlandUrban88
LangleyUrban86
West VancouverUrban86
University Endowment AreaUrban83
ColdstreamUrban78
Prince GeorgeUrban77
CaribooRural75
North ThompsonRural74
Oak BayUrban73
ChilliwackUrban68
North Columbia RiverRural65
Bridge-LillooetRural62
ShuswapRural62
PentictonUrban60
SpallumcheenUrban52
MerrittUrban48
Skeena-BulkleyRural42
North VancouverUrban39
QuesnelUrban39
KentUrban35
Elk & Flathead RiversRural35
South Columbia RiverRural34
RosslandUrban33
Salmon ArmUrban33
KasloUrban32
Port CoquitlamUrban32
Kettle RiverRural27
North CoastRural27
CourtenayUrban26
FernieUrban25
Queen Charlotte IslandsRural25
Salmon ArmRural25
SmithersUrban25
EsquimaltUrban23
South ChilcotinRural20
LadysmithUrban18
Kiskatinaw RiverRural15
SumasUrban15
GlenmoreUrban14
North ChilcotinRural14
Nechako-Fraser-ParsnipRural12
AbbotsfordUrban10
CrestonUrban10
East LillooetRural10
Grand ForksUrban10
HopeUrban9
EnderbyUrban8
TerraceUrban8
Williams LakeUrban8
AlberniUrban7
Stikine-LiardRural7
Atlin LakeRural5
Burns LakeUrban5
Fraser-CanoeRural5
VanderhoofUrban5
Upper NechakoRural3
Babine-Stuart-Takla LakesRural2
Beaton RiverRural2
SilvertonUrban2
TadanacUrban2
GreenwoodUrban1
British ColumbiaTotal49,344

World War II prompted the federal government used the War Measures Act to brand Japanese Canadians enemy aliens and categorized them as security threats in 1942. Tens of thousands of Japanese Canadians were placed in internment camps in British Columbia; prison of war camps in Ontario; and families were also sent as forced labourers to farms throughout the prairies. By 1943, all properties owned by Japanese Canadians in British Columbia were seized and sold without consent.

Unlike Korean Americans who have relatively much longer history settling in the United States, very few settled in Canada; as late as 1965, the total permanent Korean population of Canada was estimated at only 70. [15] However, with the 1966 reform of Canadian immigration laws, South Korean immigration to Canada began to grow. [15] By 1969, there were an estimated 2000 Koreans in Canada. [16]

In the late 1990s, South Korea became the fifth-largest source of immigrants to Canada. [17] Toronto has the country's largest absolute number of Koreans, but Vancouver is experiencing the highest rate of growth in its Korean population, with a 69% increase since 1996. Montreal was the third most popular destination for Korean migrants during this period. [18] The 1990s growth in South Korean migration to Canada occurred at a time when Canadian unemployment was high and income growth was low relative to the United States. [19] One pair of researchers demonstrated that numbers of migrants were correlated with the exchange rate; the weakness of the Canadian dollar relative to the United States dollar meant that South Korean migrants bringing savings to Canada for investment would be relatively richer than those going to the United States. [20] Other factors suggested as drivers behind the growth of South Korean immigration to Canada included domestic anti-Americanism and the large presence of Canadian English teachers in local hagwon . [21]

When Hong Kong reverted to mainland Chinese rule, people emigrated and found new homes in Canada.

Demography

Ethnic and national origins

East Asian Canadians Demography by Ethnic and National Origins (2001−2021)
Ethnic/National
Origins
2021 [1] [2] 2016 [4] 2011 [5] 2006 [6] 2001 [7]
Pop. %Pop.%Pop.%Pop.%Pop.%
Flag of China.svg Chinese 1,715,7701,769,19511,487,58011,346,51011,094,7001
Flag of South Korea.svg Korean 218,140198,210168,890146,545101,715
Flag of Japan.svg Japanese 129,425121,485109,74098,90585,230
Flag of Hong Kong.svg Hong Kong 81,680N/AN/AN/AN/AN/AN/AN/AN/A
Flag of Taiwan.svg Taiwanese 64,02036,51530,33017,70518,080
Flag of Tibet.svg Tibetan 9,3508,0405,8204,2751,425
Flag of Mongolia.svg Mongolian 9,0907,4755,3553,9601,675
Hmong 1,030805830815595
Other East
Asian
Origins
61,3006,5059,0459,54510,805
Flag of Canada.svg Total East Asian
Canadian Population
[lower-alpha 2]
2,289,8052,148,2301,817,5901,628,2601,314,225
1Including Hong Kong Canadians.

Geographical distribution

Provinces & territories

East Asian Canadians by province and territory (2001−2016) [lower-alpha 2]
Province 2016 [4] 2011 [5] 2006 [6] 2001 [7]
Pop. %Pop.%Pop.%Pop.%
Flag of Ontario.svg Ontario 1,008,780855,280767,160614,915
Flag of British Columbia.svg British Columbia 679,015586,545539,350457,555
Flag of Alberta.svg Alberta 232,535191,305166,105129,590
Flag of Quebec.svg Quebec 140,235117,580105,24574,015
Flag of Manitoba.svg Manitoba 37,82529,00023,20017,550
Flag of Saskatchewan.svg Saskatchewan 22,95017,15012,77510,815
Flag of Nova Scotia.svg Nova Scotia 12,5709,0456,7204,895
Flag of New Brunswick.svg New Brunswick 6,5855,3453,9602,430
Flag of Newfoundland and Labrador.svg Newfoundland and Labrador 2,9702,2751,9301,260
Flag of Prince Edward Island.svg Prince Edward Island 3,1052,385475305
Flag of the Northwest Territories.svg Northwest Territories 715620530410
Flag of Yukon.svg Yukon 825920650365
Flag of Nunavut.svg Nunavut 1501109555
Flag of Canada.svg Canada2,148,2301,817,5901,628,2601,314,225

See also

Notes

  1. 1 2 3 Chinese: 1,715,770 persons [2]
    Korean: 218,140 persons [2]
    Japanese: 129,425 persons [1]
    Hong Konger: 81,680 persons [1]
    Taiwanese: 64,020 persons [1]
    Tibetan: 9,350 persons [1]
    Mongolian: 9,090 persons [1]
    Hmong: 1,030 persons [1]
    Other East Asian: 61,300 persons [1]
  2. 1 2 3 4 5 Statistic includes combined population of Chinese Canadians, Korean Canadians, Japanese Canadians, Hong Kong Canadians Taiwanese Canadians, Tibetan Canadians, Mongolian Canadians, Hmong Canadians, and Other East Asian Canadians.

Related Research Articles

<span class="mw-page-title-main">Demographics of Canada</span>

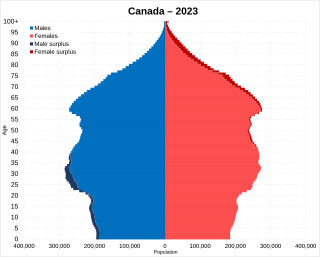
Statistics Canada conducts a country-wide census that collects demographic data every five years on the first and sixth year of each decade. The 2021 Canadian census enumerated a total population of 36,991,981, an increase of around 5.2 percent over the 2016 figure. It is estimated that Canada's population surpassed 40 million in 2023 and 41 million in 2024. Between 1990 and 2008, the population increased by 5.6 million, equivalent to 20.4 percent overall growth. The main driver of population growth is immigration. Between 2011 and May 2016, Canada's population grew by 1.7 million people, with immigrants accounting for two-thirds of the increase.

<span class="mw-page-title-main">Ethnic origins of people in Canada</span>

According to the 2021 Canadian census, over 450 "ethnic or cultural origins" were self-reported by Canadians. The major panethnic origin groups in Canada are: European (52.5%), North American (22.9%), Asian (19.3%), North American Indigenous (6.1%), African (3.8%), Latin, Central and South American (2.5%), Caribbean (2.1%), Oceanian (0.3%), and Other (6%). Statistics Canada reports that 35.5% of the population reported multiple ethnic origins, thus the overall total is greater than 100%.

<span class="mw-page-title-main">Greater Vancouver</span> Metropolitan area in British Columbia, Canada

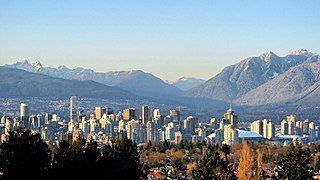
Greater Vancouver, also known as Metro Vancouver, is the metropolitan area with its major urban centre being the city of Vancouver, British Columbia, Canada. The term "Greater Vancouver" describes an area that is roughly coterminous with the region governed by the Metro Vancouver Regional District (MVRD), though it predates the 1966 creation of the regional district. It is often used to include areas beyond the boundaries of the regional district but does not generally include wilderness and agricultural areas that are included within the MVRD.

<span class="mw-page-title-main">Cowichan Valley Regional District</span> Regional district in British Columbia, Canada

The Cowichan Valley Regional District is a regional district in the Canadian province of British Columbia that is on the southern part of Vancouver Island, bordered by the Nanaimo and Alberni-Clayoquot Regional Districts to the north and northwest, and by the Capital Regional District to the south and east. As of the 2021 Census, the Regional District had a population of 89,013. The regional district offices are in Duncan.

<span class="mw-page-title-main">South Asian Canadians</span>

South Asian Canadians are Canadians who were either born in or can trace their ancestry to the Indian subcontinent, which includes the nations of India, Pakistan, Bangladesh, Nepal, Sri Lanka, Bhutan, and the Maldives.

Lebanese Canadians are Canadians of Lebanese origin. According to the 2016 census there were 219,555 Canadians who claimed Lebanese ancestry, showing an increase compared to the 2006 census, making them by far the largest group of people with Arabic-speaking roots. As of the 2016 census, they are also one of the largest communities of Asian origin in the country.

<span class="mw-page-title-main">Port Hardy</span> District municipality in British Columbia, Canada

Port Hardy is a district municipality in British Columbia, Canada located on the north-east tip of Vancouver Island. Port Hardy has a population of 3,902 as of the 2021 census.

The demographics of Toronto, Ontario, Canada make Toronto one of the most multicultural and multiracial cities in the world. In 2021, 57.0 percent of the residents of the metropolitan area belonged to a visible minority group, compared with 51.4 percent in 2016, and 13.6 percent in 1981. Toronto also has established ethnic neighbourhoods such as the multiple Chinatowns, Corso Italia, Little Italy, Little India, Greektown, Koreatown, Little Tokyo, Little Jamaica, Little Portugal, Little Malta, Roncesvalles (Polish), and Bloor West Village (Ukrainian), all of which celebrate the city's multiculturalism. Data from the suburban municipalities are also included for some metrics as most of these municipalities are part of the Toronto CMA.

The demographics of Metro Vancouver indicate a multicultural and multiracial region. Metro Vancouver is a metropolitan area, with its major urban centre being Vancouver, British Columbia, Canada. The Vancouver census metropolitan area, as defined by Statistics Canada, encompasses roughly the same territory as the Metro Vancouver Regional District, a regional district in British Columbia. The regional district includes 23 local authorities. Figures provided here are for the Vancouver census metropolitan area and not for the City of Vancouver.

<span class="mw-page-title-main">Demographics of British Columbia</span>

British Columbia is a Canadian province with a population of about 5.6 million people. The province represents about 13.2% of the population of the Canadian population. Most of the population is between the ages of 15 and 49. About 60 percent of British Columbians have European descent with significant Asian and Aboriginal minorities and just under 30% of British Columbians are immigrants. Over half of the population is irreligious, with Christianity and Sikhism being the most followed religions.

<span class="mw-page-title-main">Demographics of Ontario</span>

Ontario, one of the 13 provinces and territories of Canada, is located in east-central Canada. It is Canada's most populous province by a large margin, accounting for nearly 40 percent of all Canadians, and is the second-largest province in total area. Ontario is fourth-largest in total area when the territories of the Northwest Territories and Nunavut are included. It is home to the nation's capital city, Ottawa, and the nation's most populous city, Toronto.

<span class="mw-page-title-main">Demographics of Alberta</span>

Alberta has experienced a relatively high rate of growth in recent years, due in large part to its economy. Between 2003 and 2004, the province saw high birthrates, relatively high immigration, and a high rate of interprovincial migration when compared to other provinces. Approximately 81% of the population live in urban areas and only about 19% live in rural areas. The Calgary–Edmonton Corridor is the most urbanized area in Alberta and is one of Canada's four most urban regions. Many of Alberta's cities and towns have also experienced high rates of growth in recent history. From a population of 73,022 in 1901, Alberta has grown to 4,262,635 in 2021 and in the process has gone from less than 1.5% of Canada's population to 11.5%. It is the fourth most populated province in Canada. Between the 2016 and 2021 censuses, the Alberta population grew by 4.8%.

<span class="mw-page-title-main">Demographics of Saskatchewan</span>

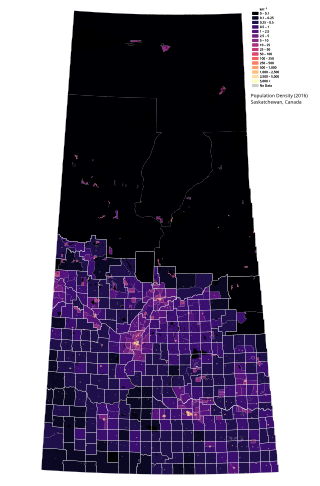
Saskatchewan is the middle province of Canada's three Prairie provinces. It has an area of 651,900 km² (251,700 mi²) and a population of 1,132,505 (Saskatchewanians) as of 2021. Saskatchewan's population is made of 50.3% women and 49.7% men. Most of its population lives in the Southern half of the province.

<span class="mw-page-title-main">Asian Canadians</span> Ethnic group in Canada

Asian Canadians are Canadians who were either born in or can trace their ancestry to the continent of Asia. Canadians with Asian ancestry comprise both the largest and fastest growing group in Canada, after European Canadians, forming approximately 20.2 percent of the Canadian population as of 2021. Most Asian Canadians are concentrated in the urban areas of Southern Ontario, Southwestern British Columbia, Central Alberta, and other large Canadian cities.

<span class="mw-page-title-main">Indo-Canadians</span> Community of Canadians of Indian descent or with Indian citizenship

Indo-Canadians or Indian Canadians, are Canadians who have ancestry from India. The term East Indian is sometimes used to avoid confusion with the Indigenous peoples of Canada. Categorically, Indo-Canadians comprise a subgroup of South Asian Canadians which is a further subgroup of Asian Canadians. According to Statistics Canada, Indians are one of the fastest growing communities in Canada and one of the largest non-European ethnic groups.

Nordic and Scandinavian Canadians are Canadian citizens with ancestral roots in the Nordic countries and/or Scandinavia

The demographics of Winnipeg reveal the city to be a typically Canadian one: multicultural and multilingual. Winnipeg is also prominent in the size and ratio of its First Nations population, which plays an important part in the city's makeup. About 12.4% of Winnipeggers are of Indigenous descent, which vastly exceeds the national average of 5.0%.

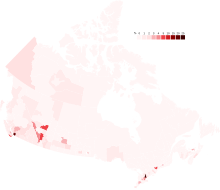
South Asian Canadians in Metro Vancouver are the third-largest pan-ethnic group in the region, comprising 369,295 persons or 14.2 percent of the total population as of 2021. Sizable communities exist within the city of Vancouver along with the adjoining city of Surrey, which houses one of the world's largest South Asian enclaves.

<span class="mw-page-title-main">South Asian Canadians in British Columbia</span>

The South Asian community in British Columbia was first established in 1897. The first immigrants originated from Punjab, British India, a northern region and state in modern-day India and Pakistan. Punjabis originally settled in rural British Columbia at the turn of the twentieth century, working in the forestry and agricultural industries.

<span class="mw-page-title-main">Canada immigration statistics</span> Historic and contemporary immigration statistics of Canada

Since confederation in 1867 through to the contemporary era, decadal and demi-decadal census reports in Canada have compiled detailed immigration statistics. During this period, the highest annual immigration rate in Canada occurred in 1913, when 400,900 new immigrants accounted for 5.3 percent of the total population, while the greatest number of immigrants admitted to Canada in single year occurred in 2023, with 471,550 persons accounting for 1.2 percent of the total population.

References

  1. 1 2 3 4 5 6 7 8 9 10 11 Government of Canada, Statistics Canada (2022-10-26). "Ethnic or cultural origin by gender and age: Canada, provinces and territories, census metropolitan areas and census agglomerations with parts". www12.statcan.gc.ca. Retrieved 2023-01-13.
  2. 1 2 3 4 5 6 7 Government of Canada, Statistics Canada (2022-10-26). "Visible minority and population group by generation status: Canada, provinces and territories, census metropolitan areas and census agglomerations with parts". www12.statcan.gc.ca. Retrieved 2023-01-13.
  3. Government of Canada, Statistics Canada (2022-10-26). "The Canadian census: A rich portrait of the country's religious and ethnocultural diversity". www12.statcan.gc.ca. Retrieved 2022-01-10. In 2021, just over 25 million people reported being White in the census, representing close to 70% of the total Canadian population. The vast majority reported being White only, while 2.4% also reported one or more other racialized groups.
  4. 1 2 3 Government of Canada, Statistics Canada (2019-06-17). "Ethnic Origin (279), Single and Multiple Ethnic Origin Responses (3), Generation Status (4), Age (12) and Sex (3) for the Population in Private Households of Canada, Provinces and Territories, Census Metropolitan Areas and Census Agglomerations, 2016 Census - 25% Sample Data". www12.statcan.gc.ca. Retrieved 2022-08-31.
  5. 1 2 3 Government of Canada, Statistics Canada (2019-01-23). "Ethnic Origin (264), Single and Multiple Ethnic Origin Responses (3), Generation Status (4), Age Groups (10) and Sex (3) for the Population in Private Households of Canada, Provinces, Territories, Census Metropolitan Areas and Census Agglomerations, 2011 National Household Survey". www12.statcan.gc.ca. Retrieved 2022-08-31.
  6. 1 2 3 Government of Canada, Statistics Canada (2020-05-01). "Ethnic Origin (247), Single and Multiple Ethnic Origin Responses (3) and Sex (3) for the Population of Canada, Provinces, Territories, Census Metropolitan Areas and Census Agglomerations, 2006 Census - 20% Sample Data". www12.statcan.gc.ca. Retrieved 2022-08-31.
  7. 1 2 3 Government of Canada, Statistics Canada (2013-12-23). "Ethnic Origin (232), Sex (3) and Single and Multiple Responses (3) for Population, for Canada, Provinces, Territories, Census Metropolitan Areas and Census Agglomerations, 2001 Census - 20% Sample Data". www12.statcan.gc.ca. Retrieved 2022-08-31.
  8. Claiming the Land, Dan Marshall, UBC Ph.D Thesis, 2002 (unpubl.)
  9. McGowan's War, Donald J. Hauka, New Star Books, Vancouver (2000) ISBN   1-55420-001-6
  10. Lim, Imogene L. "Pacific Entry, Pacific Century: Chinatowns and Chinese Canadian History" (Chapter 2). In: Lee, Josephine D., Imogene L. Lim, and Yuko Matsukawa (editors). Re/collecting Early Asian America: Essays in Cultural History. Temple University Press, 2002. ISBN   1439901201, 9781439901205. Start: 15. CITED: p. 18.
  11. Harris, Cole. The Resettlement of British Columbia: Essays on Colonialism and Geographical Change. University of British Columbia Press, Nov 1, 2011. ISBN   0774842563, 9780774842563. p. 145.
  12. "How Canada tried to bar the "yellow peril"" (PDF). Maclean's. 1 July 1999. Archived from the original (PDF) on 18 October 2015. Retrieved 4 January 2015.
  13. Lisa Rose Mar (2010). Brokering Belonging: Chinese in Canada's Exclusion Era, 1885-1945. Oxford University Press. p. 112. ISBN   9780199780051.
  14. 1 2 Government of Canada, Statistics Canada (2013-04-03). "Seventh census of Canada, 1931 . v. 2. Population by areas". www12.statcan.gc.ca. Retrieved 2023-12-30.
  15. 1 2 Yoon 2006 , p. 17
  16. Kim, Jung G (Spring–Summer 1982). "Korean-language press in Ontario". Polyphony: The Bulletin of the Multicultural History Society of Ontario. 4 (1): 82. Archived from the original on 2015-09-24. Retrieved 2022-09-19.
  17. Kwak 2004 , p. 8
  18. Kwak 2004 , p. 3
  19. Han & Ibbott 2005 , p. 157
  20. Han & Ibbott 2005 , p. 155
  21. Han & Ibbott 2005 , p. 160

    Sources