Romanian Canadians

Last updated
Romanian Canadians
Total population
215,885
(by ancestry, 2021 Census ) [1]
Regions with significant populations
Greater Toronto Area, Greater Montreal
Languages
Romanian, Canadian English, French
Religion
Mainly Romanian Orthodoxy, but also Romanian Greek Catholicism, Roman Catholicism, Protestantism, Judaism
Related ethnic groups
Romanian Americans, European Canadians

Romanian Canadians are Canadian citizens of Romanian descent or Romania-born people who reside in Canada.

Contents

According to the 2021 Canadian census, there are 215,885 Romanian-Canadians. [1]

History of Romanian migration in Canada

Before World War I

Romanians moved to Canada in several periods. The first period was at the end of the 19th century and the beginning of the 20th century. Romanians had discovered Canada towards the end of the 19th century, after Clifford Sifton – Minister of Home Affairs representing a Liberal government that had promised to populate the West – had visited Bukovina.[ citation needed ] From 1896 to 1900, a group of Romanians established themselves in Assiniboia (now Saskatchewan), at Clifford Sifton's advice.[ citation needed ] The first two Romanian families that migrated to Canada from the Bukovina village of Boian stopped in Alberta in 1898. Other 100 Bucovina families took their example and followed them and they gave the settlement the name of their home village.[ citation needed ]

At the end of the 19th century and the beginning of the 20th century, many Romanians from the former Austro-Hungarian Empire (Transylvania, Bukovina, Banat, Crişana, and Maramureş) migrated to the Prairie provinces of Canada to work as farmers. The Dominion Lands Act encouraged homesteaders to come to the area. The migrants from the Romanian Old Kingdom were mostly Romanian Jews. Many Romanians moved to Canada and the United States between 1895 and 1920. [2]

St Nicholas's Romanian Orthodox Church (established in 1902 [3] in Regina) is the oldest Romanian Orthodox parish in North America; [4] St George's Cathedral (founded in 1914 [5] though the present building dates from the early 1960s), is the episcopal seat of the Romanian Orthodox Bishop of Regina. Today, the Romanian school from Boian, Alberta is a museum showcasing Romanian immigration, photos of the first Romanian settlers in the area and the typical Romanian farmer's life in rural Canada.

During the interwar period the number of ethnic Romanians who migrated to Canada decreased as a consequence of the economic development in Romania, but the number of Romanian Jews who migrated to Canada increased, mostly after the rise of the Iron Guard.[ citation needed ]

According to the 1911 Canadian census, in Canada lived 15,000 Romanians and in 1941: 25,000.[ citation needed ]

After World War II

The second period was between 1945 and 1955, when Romanians moved after World War II, during Communist Romania, at a time when Romania was in a difficult period in its history. In this period, 1,460,000 Romanian citizens left their country. Many of them were political refugees. Many of them left for Canada.

Post-communism

Another wave of Romanian emigration to Canada occurred after 1989 following the Romanian Revolution of 1989, when people obtained the right to leave Romania subsequent to the fall of Communism in Central and Eastern Europe. The wave intensified after the Mineriad of 13–15 June 1990. After 1998, for the fourth time, a large number of Romanians were leaving Europe to come to Canada.[ citation needed ]

In 2001, there were 131,830 Canadian residents who identified themselves of Romanian origin, of which 53,320 were single-origin Romanians and 78,505 were of mixed Romanian and other origins. [6] The largest concentrations of Romanian-Canadians are in the Greater Toronto Area (approx. 75,000) and in the Greater Montreal Area (approx. 40,000). According to the 2001 Canadian census, the number of people of Romanian mother tongue in Canada was 50,895 and 61,330 Canadians claimed to speak Romanian. The number of people born in Romania was 61,330 and 2,380 were born in Moldova.

According to the 2016 census, there were 238,050 Canadian residents who identified themselves of Romanian origin, of which 96,910 were single-origin Romanians and 141,145 were of mixed Romanian and other origins. [7] Almost 100,000 Romanian Canadians live in Ontario. [8]

According to the 2021 census, there were 215,885 Canadian residents declaring themselves of Romanian origin; [9] Romanian was the mother tongue of 93,160 of Canadian residents. [1] There were 86,770 Canadian residents who were born in Romania. [9]

Immigration from Romania reached a high in the early 2000s. Figures from Citizenship and Immigration Canada show that the annual number of new permanent residents from Romania increased from an average of over 3,700 per year in the late 1990s to an average of over 5,500 per year since 2001, peaking in 2004 at 5,658.[ citation needed ] After 2004, the immigration from Romania constantly decreased.[ citation needed ]

Map of North America highlighting the OCA Romanian Episcopate Map of North America highlighting OCA Romanian Episcopate.svg
Map of North America highlighting the OCA Romanian Episcopate
Romanian immigrants to Canada
YearNumber of people
19953,851
19963,670
19973,916
19982,976
19993,468
20004,431
20015,589
20025,688
20035,466
20045,658
20054,964
20064,468
20073,834
20082,836
20092,076
20101,922
20111,776
20121,588
20131,512
20141,552
20151,183
20161,361
2017980
2018810
2019675

Source: Citizenship and Immigration Canada , 2014:, [10] 2015: [11] Facts and Figures 2016: [12]

Community life and associations

A few parishes and non-profit organizations deal with a series of community related issues. These include the "Buna Vestire" Parish Montreal, the Romanian Association of Canada, the Federation of Romanian Associations of Canada, Women's Society, and Constantin Brancoveanu Society.

In 1914-18 was built the "Buna Vestire" Church (Annunciation Church) (Cernăuți Metropolitan seat), the oldest Romanian Orthodox Church in Montreal. Among the Buna Vestire Church priests were Jida, Glicherie Moraru (1930–1938), Constantin Juga (1938–1950), Petre Popescu (June 10, 1951 – 2003), and Nicolae Stoleru, Tofan

In 1939, on Iberville Street, in Montreal, was built "Casa Romana", where was set up a Romanian school.

In 1957, was set up the Romanian Cultural Association of Hamilton, Ontario. Cuvântul românesc is the newspaper of the association. "The Week of the Romanians" continues the tradition of almost 40 years of the "Romanian Field Week" at Hamilton, Ontario. Through the years, the place has combined cultural tributes to Romania with anticommunist manifestations from Romanians in North America. The Romanian Field covers 40 acres (160,000 m2) in a natural environment near Hamilton. The place features the Nae Ionescu Cultural Center, the St. Mary Chapel, sports fields, a pool, as well as a couple of bungalows and accommodation for mobile homes. The place for the St. Mary Chapel was chosen by Valerian Trifa. The Writers' Alley (Rotonda) includes busts (sculptor Nicăpetre (1936–2008) of Nae Ionescu, Vasile Posteucă, George Donev, Aron Cotruş, Vintilă Horia, Mircea Eliade and Mihai Eminescu.

Another recreational and Romanian cultural facility in Canada is the Camp at Fort Qu'Appelle, Saskatchewan. Although not quite completed, the camp was blessed and opened for use by Archbishop Valerian Trifa in the summer of 1971.

On July 24, 1998, the Romanian community of Boian, Alberta celebrated its centenary. Besides religious services, there was a cultural program and demonstrations of the early life of the Romanians in Canada. The Romanian Orthodox parish in Boian has a Romanian ethnic museum housed on its premises. The museum and St. Mary Orthodox Church was proclaimed historical site by the authorities.

Association of Romanian Writers in Canada was incorporated in 2001. Association of Romanian Engineers in Canada was founded in 2003.

Timeline

Romanian Canadians by Canadian province or territory (2016)

ProvincePopulationPercentageSource
Flag of Ontario.svg  Ontario 98,2350.7% [13]
Flag of Quebec.svg  Quebec 53,0600.7% [14]
Flag of Alberta.svg  Alberta 34,2300.9% [15]
Flag of British Columbia.svg  British Columbia 31,2500.7% [16]
Flag of Saskatchewan.svg  Saskatchewan 12,7301.2% [17]
Flag of Manitoba.svg  Manitoba 5,8350.5% [18]
Flag of Nova Scotia.svg  Nova Scotia 1,1950.1% [19]
Flag of New Brunswick.svg  New Brunswick 9400.1% [20]
Flag of Newfoundland and Labrador.svg  Newfoundland and Labrador 1850.0% [21]
Flag of Prince Edward Island.svg  Prince Edward Island 1250.1% [22]
Flag of the Northwest Territories.svg  Northwest Territories 1200.3% [23]
Flag of Nunavut.svg  Nunavut 150.0% [24]
Flag of Yukon.svg  Yukon 1350.4% [25]
Flag of Canada (Pantone).svg  Canada 238,050 0.7% [26]


See also

Related Research Articles

<span class="mw-page-title-main">Demographics of Canada</span>

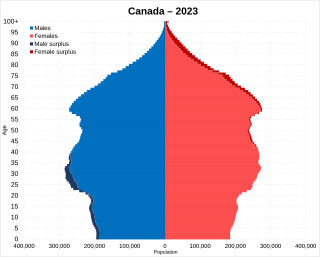
Statistics Canada conducts a country-wide census that collects demographic data every five years on the first and sixth year of each decade. The 2021 Canadian census enumerated a total population of 36,991,981, an increase of around 5.2 percent over the 2016 figure. It is estimated that Canada's population surpassed 40 million in 2023 and 41 million in 2024. Between 1990 and 2008, the population increased by 5.6 million, equivalent to 20.4 percent overall growth. The main driver of population growth is immigration, with 6.2% of the country's population being made up of temporary residents as of 2023, or about 2.5 million people. Between 2011 and May 2016, Canada's population grew by 1.7 million people, with immigrants accounting for two-thirds of the increase.

<span class="mw-page-title-main">Ukrainian Canadians</span> Canadian citizens of Ukrainian descent

Ukrainian Canadians are Canadian citizens of Ukrainian descent or Ukrainian-born people who immigrated to Canada.

Spanish Canadians are Canadians of full or partial Spanish heritage or people who hold a European Union citizenship from Spain as well as one from Canada. They likely also include many Canadians of Latin-American ethnic origin who use the term "Spanish" as a panethnic ethnonym rather than only their specific country of ancestry. For example, someone whose familial origins are from El Salvador, Honduras, Colombia or Guatemala may call themself "Spanish" to identify with the larger Spanish speaking community. See Latin American Canadian for more information.

<span class="mw-page-title-main">Polish Canadians</span> Canadians with Polish ancestry

Polish Canadians are citizens of Canada with Polish ancestry, and Poles who immigrated to Canada from abroad. At the 2016 Census, there were 1,106,585 Canadians who claimed full or partial Polish heritage.

Lebanese Canadians are Canadians of Lebanese origin. According to the 2016 census there were 219,555 Canadians who claimed Lebanese ancestry, showing an increase compared to the 2006 census, making them by far the largest group of people with Arabic-speaking roots. As of the 2016 census, they are also one of the largest communities of Asian origin in the country.

Haitian Canadians are Canadians of Haitian descent or Haiti-born people who reside in Canada. As of 2016, more than 86% of Haitian Canadians reside in Quebec.

Afghan Canadians are Canadians with ancestry from Afghanistan. They form the second largest Afghan community in North America after Afghan Americans. Their ethnic origin may come from any of the ethnic groups of Afghanistan, which include Pashtun, Tajik, Uzbek, Hazara, Turkmen, etc. In the Canada 2016 Census about 83,995 Canadians were from Afghanistan.

<span class="mw-page-title-main">Russian Canadians</span> Canadians with Russian ancestry

Russian Canadians comprise Canadian citizens of Russian heritage or Russians who immigrated to and reside in Canada. According to the 2021 Census, there were 548,140 Canadians who claimed full or partial Russian ancestry. The areas of Canada with the highest percentage population of Russian Canadians are the Prairie Provinces.

Laotian Canadians, are Canadian citizens of Laotian origin or descent. In the 2016 Census, 24,580 people indicated Laotian ancestry. Bilateral relations between Canada and Laos were established in 1954 with the formalization of the independence of the Kingdom of Laos from France. In August 2015, Canada's first resident diplomat opened the Office of the Embassy of Canada in Vientiane, Laos.

Welsh Canadians are Canadian citizens of Welsh descent or Wales-born people who reside in Canada.

Barbadian Canadian or Bajan Canadians are Canadian citizens of Barbadian descent or Barbados-born people who reside in Canada. According to the 2016 Census 37,780 Canadians claimed full or partial Barbadian ancestry. Barbadian Canadians have the highest median income and the lowest incidence of poverty among Black Canadian groups. Barbadians first start migrating to Nova Scotia in the early 1900s settling largely in the neighbourhood of Whitney Pier in Sydney. In Cape Breton, they established chapters of the United Negro Improvement Association and the African Orthodox Church. As of 2016, over 70% of the Bajan population in Canada resides in Ontario.

<span class="mw-page-title-main">Demographics of Alberta</span>

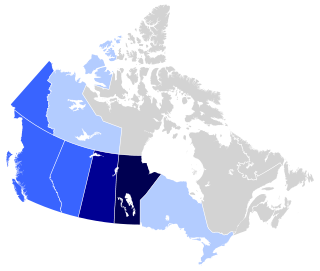
Alberta has experienced a relatively high rate of growth in recent years, due in large part to its economy. Between 2003 and 2004, the province saw high birthrates, relatively high immigration, and a high rate of interprovincial migration when compared to other provinces. Approximately 81% of the population live in urban areas and only about 19% live in rural areas. The Calgary–Edmonton Corridor is the most urbanized area in Alberta and is one of Canada's four most urban regions. Many of Alberta's cities and towns have also experienced high rates of growth in recent history. From a population of 73,022 in 1901, Alberta has grown to 4,262,635 in 2021 and in the process has gone from less than 1.5% of Canada's population to 11.5%. It is the fourth most populated province in Canada. Between the 2016 and 2021 censuses, the Alberta population grew by 4.8%.

Egyptian Canadians are Canadian citizens of Egyptian descent, first-generation Egyptian immigrants, or descendants of Egyptians who emigrated to Canada. According to the 2011 Census there were 73,250 Canadian citizens who are from Egypt, having an increase compared to those in the 2006 Census.

Nordic and Scandinavian Canadians are Canadian citizens with ancestral roots in the Nordic countries and/or Scandinavia

Cambodian Canadians are Canadians of Cambodian ethnic origin or descent. There are a total of 38,490 Canadian Cambodians, most of whom reside in Toronto and Montreal.

Belgian Canadians are Canadian citizens of Belgian ancestry or Belgium-born people who reside in Canada. According to the 2011 census there were 176,615 Canadians who claimed full or partial Belgian ancestry. It encompasses immigrants from both French and Dutch-speaking parts of Belgium.

Ghanaian Canadians are a Canadian ethnic group of full or partial Ghanaian ancestry. Ghanaians who became naturalized citizens of Canada preferably refer to themselves as Ghanaian Canadians.

<span class="mw-page-title-main">Yugoslav Canadians</span> Ethnic group

Yugoslav Canadians are Canadians of full or partial Yugoslav ancestry. At the 2016 Census, the total number of Canadians whose origins lie in former Yugoslavia, majority of whom indicated specific ethnic origin, was 386,340 or 1.12% of the total population.

<span class="mw-page-title-main">West Asian Canadians</span> Ethnic group

West Asian Canadians, officially known as West Central Asian and Middle Eastern Canadians are Canadians who were either born in or can trace their ancestry to West Asia and Central Asia. The term West Asian Canadian is a subgroup of Asian Canadians and Middle Eastern Canadians. According to Statistics Canada, West Asian Canadians are considered visible minorities and can be further divided by nationality, such as Lebanese Canadian or Iranian Canadian.

References

  1. 1 2 3 "Profile table, Census Profile, 2021 Census of Population - Canada [Country]". 9 February 2022.
  2. "target audience - Demographic Information". Romedia.us. Retrieved 2011-02-28.
  3. Romanian Orthodox Episcopate of America parish directory Archived 2007-06-18 at the Wayback Machine , retrieved 10 June 2007.
  4. Saskatchewan Settlement Experience: Religion – Churches and Congregations. Retrieved 4 December 2007.
  5. Romanian Orthodox Episcopate of America parish directory Archived 2007-06-18 at the Wayback Machine , retrieved 10 June 2007.
  6. "Ethno-Cultural Portrait of Canada, Table 1". 2.statcan.ca. Retrieved 2011-02-28.
  7. "Immigration and Ethnocultural Diversity Highlight Tables - Ethnic Origin, both sexes, age (total), Canada, 2016 Census – 25% Sample data". 2.statcan.gc.ca. 2017-11-01. Retrieved 2021-02-24.
  8. "Immigration and Ethnocultural Diversity Highlight Tables - Ethnic Origin, both sexes, age (total), Ontario, 2016 Census – 25% Sample data". 2.statcan.gc.ca. 2017-11-01. Retrieved 2021-02-24.
  9. 1 2 Government of Canada, Statistics Canada (9 February 2022). "Profile table, Census Profile, 2021 Census of Population - Canada [Country]". www12.statcan.gc.ca. Retrieved 16 March 2023.
  10. "Immigration to Canada by source country 2014 - Statistics - Immigration Trends". canadaimmigrants.com.
  11. "Canada Immigration by Source Country 2015 - Statistics - Immigration Trends". canadaimmigrants.com.
  12. "Facts and figures" (PDF). www.cic.gc.ca. 2016. Retrieved 2021-02-24.
  13. "Ethnic Origin, both sexes, age (total), Ontario, 2016 Census – 25% Sample data". Canada 2016 Census . Statistics Canada. 25 October 2017. Retrieved 30 January 2020.
  14. "Ethnic Origin, both sexes, age (total), Quebec, 2016 Census – 25% Sample data". Canada 2016 Census . Statistics Canada. 25 October 2017. Retrieved 30 January 2020.
  15. "Ethnic Origin, both sexes, age (total), Alberta, 2016 Census – 25% Sample data". Canada 2016 Census . Statistics Canada. 25 October 2017. Retrieved 30 January 2020.
  16. "Ethnic Origin, both sexes, age (total), British Columbia, 2016 Census – 25% Sample data". Canada 2016 Census . Statistics Canada. 25 October 2017. Retrieved 30 January 2020.
  17. "Ethnic Origin, both sexes, age (total), Saskatchewan, 2016 Census – 25% Sample data". Canada 2016 Census . Statistics Canada. 25 October 2017. Retrieved 30 January 2020.
  18. "Ethnic Origin, both sexes, age (total), Manitoba, 2016 Census – 25% Sample data". Canada 2016 Census . Statistics Canada. 25 October 2017. Retrieved 30 January 2020.
  19. "Ethnic Origin, both sexes, age (total), Nova Scotia, 2016 Census – 25% Sample data". Canada 2016 Census . Statistics Canada. 25 October 2017. Retrieved 30 January 2020.
  20. "Ethnic Origin, both sexes, age (total), New Brunswick, 2016 Census – 25% Sample data". Canada 2016 Census . Statistics Canada. 25 October 2017. Retrieved 30 January 2020.
  21. "Ethnic Origin, both sexes, age (total), Newfoundland and Labrador, 2016 Census – 25% Sample data". Canada 2016 Census . Statistics Canada. 25 October 2017. Retrieved 30 January 2020.
  22. "Ethnic Origin, both sexes, age (total), Prince Edward Island, 2016 Census – 25% Sample data". Canada 2016 Census . Statistics Canada. 25 October 2017. Retrieved 30 January 2020.
  23. "Ethnic Origin, both sexes, age (total), Northwest Territories, 2016 Census – 25% Sample data". Canada 2016 Census . Statistics Canada. 25 October 2017. Retrieved 30 January 2020.
  24. "Ethnic Origin, both sexes, age (total), Nunavut, 2016 Census – 25% Sample data". Canada 2016 Census . Statistics Canada. 25 October 2017. Retrieved 30 January 2020.
  25. "Ethnic Origin, both sexes, age (total), Yukon, 2016 Census – 25% Sample data". Canada 2016 Census . Statistics Canada. 25 October 2017. Retrieved 30 January 2020.
  26. "Immigration and Ethnocultural Diversity Highlight Tables". statcan.gc.ca. 25 October 2017.

Further reading