Ethnic origins of people in Canada

Last updated

Map of the dominant self-identified ethnic origins per census division of 2006
.mw-parser-output .legend{page-break-inside:avoid;break-inside:avoid-column}.mw-parser-output .legend-color{display:inline-block;min-width:1.25em;height:1.25em;line-height:1.25;margin:1px 0;text-align:center;border:1px solid black;background-color:transparent;color:black}.mw-parser-output .legend-text{}
Canadian
English
French
Scottish
German
Italian
First Nations
Ukrainian
Indian
Inuit Censusdivisions-ethnic.png
Map of the dominant self-identified ethnic origins per census division of 2006
100,000+
50,000-99,999
20,000-49,999
10,000-19,999 COB data Canada.PNG

According to the 2021 Canadian census, over 450 "ethnic or cultural origins" were self-reported by Canadians. [2] The major panethnic origin groups in Canada are: European (

Contents

The country's ten largest self-reported specific ethnic or cultural origins in 2021 were Canadian [lower-alpha 2] (accounting for 15.6 percent of the population), followed by English (14.7 percent), Irish (12.1 percent), Scottish (12.1 percent), French (11.0 percent), German (8.1 percent), Chinese (4.7 percent), Italian (4.3 percent), Indian (3.7 percent), and Ukrainian (3.5 percent). [7] [3]

Of the 36.3 million people enumerated in 2021 approximately 25.4 million reported being white, representing 69.8 percent of the population. [2] [8] The indigenous population representing 5 percent or 1.8 million individuals, grew by 9.4 percent compared to the non-Indigenous population, which grew by 5.3 percent from 2016 to 2021. [9] One out of every four Canadians or 26.5 percent of the population belonged to a non-White and non-Indigenous visible minority, [8] [lower-alpha 3] the largest of which in 2021 were South Asian (2.6 million people; 7.1 percent), Chinese (1.7 million; 4.7 percent) and Black (1.5 million; 4.3 percent). [2]

Between 2011 and 2016, the visible minority population rose by 18.4 percent. [11] In 1961, less than two percent of Canada's population (about 300,000 people) were members of visible minority groups. [12] The 2021 census indicated that 8.3 million people, or almost one-quarter (23.0 percent) of the population reported themselves as being or having been a landed immigrant or permanent resident in Canada—above the 1921 census previous record of 22.3 percent. [13] In 2021, India, China, and the Philippines were the top three countries of origin for immigrants moving to Canada. [14]

Statistics Canada report on race and ethnicity in Canada in 2022

The 2020 General Social Survey revealed that 92% of adult Canadians said that "[ethnic] diversity is a Canadian value". [15] About 25% of Canadians were "racialized"; [2] By 2021, 23% of the Canadian population were immigrantsthe "largest proportion since Confederation", according to Statistics Canada. [15] [16] Prior to the early 1970s, most new Canadians came from Europe. Since then, more immigrants have come from Asia, the Middle East, and Africa. [15] In 2021, most immigrants came from Asia, which includes the Middle East. [15] About 25% of Canadians were "racialized"; [2] By 2021, almost 5% of Canadians self-identify as Muslim. [2] [16] Almost a million Canadians self-identified as Indigenous. [16]

Data collection method

Listed below are the ethnic groups of Canadian residents (citizens, landed immigrants and non-citizen temporary residents) as self-identified in the 2016 census in which approximately 35,151,000 census forms were completed). The relevant census question asked for "the ethnic or cultural origins" of the respondent's ancestors and not the respondents themselves. As data were collected by self-declaration, ethnic groups may not necessarily correspond to the true ancestry of respondents. [17] Many respondents acknowledged multiple ancestries. These people were added to the "multiple origin" total for each origin listed. These include responses as varied as a respondent who listed eight different origins and a respondent who answered "French Canadian" (leading to them being counted once for "French" and once for "Canadian"). As with all self-reported data, understanding of the question may have varied from respondent to respondent.

Larger ethnic origins (200,000 or more individuals per group; 2016 census)

The top 168 ethnic or cultural origins self-reported by Canadians in the 2021 Census. Canadian ethnocultural diversity.png
The top 168 ethnic or cultural origins self-reported by Canadians in the 2021 Census.
A map showing the largest ethnic or cultural origins in Canada by census division in 2021.
Canadian/Canadien
English
Irish
Scottish
French
German
Chinese
Indian
Ukrainian
Metis
Acadian
Mennonite
Inuit
Cree
Ojibway
Dene
Heiltsuk Canada ethnic origin map 2021.png
A map showing the largest ethnic or cultural origins in Canada by census division in 2021.
100,000+
50,000-99,999
20,000-49,999
10,000-19,999 COB data Canada.PNG
Ethnicity [19] Combined
responses [19]
As single
response [19]
One of multiple
responses [19]
Flag of Canada (Pantone).svg Canadian [lower-alpha 2] 11,135,9656,436,9404,699,030
Flag of England.svg English 6,320,0851,098,9305,221,150
Flag of Scotland.svg Scottish 4,799,010475,5754,323,430
Flag of France.svg French 4,670,5951,006,1803,664,415
Flag of Ireland.svg Irish 4,627,000457,9054,169,095
Flag of Germany.svg German 3,322,405569,6502,752,750
Flag of the People's Republic of China.svg Chinese 1,769,1951,439,980329,215
Flag of Italy.svg Italian 1,587,970695,420892,550
First Nations [lower-alpha 4] 1,525,565526,570999,000
Flag of India.svg Indian 1,374,7101,096,845277,865
Flag of Ukraine.svg Ukrainian 1,359,655273,8101,085,845
Flag of the Netherlands.svg Dutch 1,111,655289,675821,980
Flag of Poland.svg Polish 1,106,585264,415842,170
Flag of the Philippines.svg Filipino 837,130651,390185,740
Flag of the United Kingdom.svg British Isles,
not included elsewhere
644,695132,830511,865
Flag of Russia.svg Russian 622,445120,165502,280
Métis 600,00091,255508,740
Flag of Portugal.svg Portuguese 482,610264,815217,790
Flag of Wales (1959-present).svg Welsh 474,80525,190449,615
Flag of Norway.svg Norwegian 463,27535,905427,370
Flag of Spain.svg Spanish 396,46070,330326,130
Flag of the United States.svg American 377,41029,590347,810
Flag of Sweden.svg Swedish 349,64021,775327,870
Flag of Hungary.svg Hungarian (Magyar) 348,08583,400264,685
Flag of Jamaica.svg Jamaican 309,485161,495147,995
Flag of Greece.svg Greek 271,405141,580129,830
Flag of South Vietnam.svg Flag of Vietnam.svg Vietnamese 240,615165,38575,225
Flag of Romania.svg Romanian 238,05096,910141,145
Flag of Lebanon.svg Lebanese 219,555130,59088,965
Flag of Pakistan.svg Pakistani 215,555156,30059,255
Flag of the African Union.svg African,
not included elsewhere
212,00576,790135,210
Flag of Iran.svg Iranian 210,405170,75539,650
Flag of Denmark.svg Danish 207,47026,985180,485
Flag of Austria.svg Austrian 207,05020,225186,820

Smaller ethnic origins (2016 census)

Ethnicity [19] Combined
responses [19]
As single
response [19]
One of multiple
responses
per respondent [19]
Korean 198,210177,92020,285
Québécois 194,555119,98574,575
Belgian 186,66531,765154,895
Haitian 165,100125,78039,320
Swiss 155,12025,235129,885
Sri Lankan 152,590114,12038,475
Jewish 143,66039,710103,950
Finnish 143,64525,875117,765
Croatian 133,96555,59578,370
Mexican 128,48054,30074,180
Japanese 121,48556,72564,760
Acadian 119,67022,98096,690
Punjabi,
not included elsewhere
118,40071,53546,860
Arab,
not included elsewhere
111,40573,33038,070
Czech 104,58523,25081,330
Moroccan 103,94572,62531,320
Icelandic 101,7958,63093,165
Egyptian 99,14062,91036,230
Serbian 96,53552,73043,800
Colombian 96,32569,04027,285
Guyanese 84,27530,82553,445
Afghan 83,99570,24013,755
Inuit 79,13044,76034,37
Trinidadian/Tobagonian 78,96523,90055,065
Syrian 77,05043,68533,36
South Asian,
not included elsewhere
76,40055,44520,955
Slovak 72,29020,47551,815
Iraqi 70,92554,55516,365
West Indian 70,27530,26040,010
European,
not included elsewhere
67,89533,36034,53
Algerian 67,33049,52017,810
Salvadorean 66,21540,51025,705
Turk 63,95529,88534,070
Armenian 63,81034,56029,250
Somali 62,55054,7507,790
Lithuanian 59,28511,18548,095
Scandinavian,
not included elsewhere
52,7855,08547,695
Nigerian 51,83538,16513,670
Tamil
not included elsewhere
48,67022,14526,525
Bangladeshi 58,73545,94539,255
Chilean 45,19018,68526,510
Palestinian 44,82025,19519,630
Ethiopian 44,06034,2609,805
Macedonian 43,11018,40524,705
Australian 42,3154,52037,800
Peruvian 42,14520,64521,500
Maltese 41,91512,82029,100
South African 41,3808,00533,37
Czechoslovakian,
not otherwise specified
40,7155,07535,640
Slovenian 40,47013,69026,78
Cambodian 38,49021,44517,045
Yugoslav
not included elsewhere
38,4808,57029,91
Congolese38,37029,6758,685
Barbadian 37,77511,60526,170
Berber 37,06022,96514,100
Brazilian 36,83011,03525,795
Taiwanese 36,51523,26013,250
Albanian 36,18528,4257,760
Ghanaian 35,49526,5358,960
Bulgarian 34,56019,96514,595
Latvian 30,7257,04023,685
Black 30,3855,53524,855
Cuban 29,06510,04019,030
Israeli 28,7406,45022,280
Latin, Central or South American,
not included elsewhere
28,45514,29514,155
Caribbean,
not included elsewhere
26,8308,93017,900
Bosnian 26,74015,61011,125
Venezuelan 26,34510,30516,040
Guatemalan26,27013,90512,370
Tunisian 25,65017,6208,030
Ecuadorian25,41013,92511,485
West Asian,
not included elsewhere
25,28513,43011,855
Eritrean 25,25520,6254,630
Cameroonian24,61520,6054,010
Laotian 24,58013,37511,205
Estonian 24,5306,15518,375
Dominican23,1309,93013,200
Bengali22,90518,4354,470
Asian,
not otherwise specified
22,74015,7606,980
Aboriginal from Central/South America22,7202,08020,645
Newfoundlander 22,2154,89517,325
Indonesian 21,3954,77516,615
Belarusian 20,7105,12515,585
Argentinian 20,6804,16516,510
Eastern European,
not included elsewhere
20,4205,87514,545
Sudanese 19,96015,2504,710
Fijian19,3708,27011,105
Thai 19,0057,74011,265
Grenadian17,9157,51510,400
Vincentian/Grenadinian17,4257,24510,180
East African 17,3057,22010,085
Nepali 17,13513,6953,440
Malaysian 16,9202,55514,365
Kurdish 16,32010,4705,845
New Zealander 15,3951,30014,095
Central and West African origins,
not included elsewhere
15,3807,8007,585
Moldovan14,9157,4157,505
Jordanian 14,2507,9556,295
Assyrian 13,8308,8704,960
Nicaraguan13,7056,3607,350
Breton 11,8453,2308,615
Flemish 11,6851,48510,200
Hispanic 11,0505,6605,395
Burundian10,9908,9652,025
Ivoirean10,9357,7953,140
Kenyan10,9155,4455,465
Rwandan10,7758,0802,690
Honduran10,6505,3255,325
Senegalese10,1756,4903,685
Yoruba 9,5856,8702,715
Burmese9,3354,6604,675
Mauritanian9,3253,5205,805
St. Lucian8,9854,0404,945
Gujarati8,3505,2903,060
Zimbabwean 8,0904,9453,140
Tibetan 8,0407,0151,030
Libyan 7,7455,7551,985
Mongolian 7,4802,5554,925
Sinhalese7,2854,3552,930
Guinean7,2404,7052,540
Basque 6,9707156,250
Sicilian6,9401,3455,600
Saudi Arabian 6,8104,2002,615
Uruguayan 6,7951,8104,985
Yemeni 6,6402,9403,700
East or Southeast Asian,
not included elsewhere
6,5054,2352,270
Azerbaijani 6,4252,2804,145
Maya6,2901,1805,105
Manx6,1252855,845
North African,
not included elsewhere
6,1152,9053,210
Goan6,0702,0404,030
Ugandan5,7053,2452,460
Cypriot5,6501,2654,385
Costa Rican5,5352,1403,395
Igbo 5,3203,4751,845
Togolese5,3003,0952,205
Bolivian5,0551,8903,160
Beninese4,9902,6502,340
Slavic,
not otherwise specified
4,8701,4703,400
Tatar 4,8258803,940
Pashtun 4,8102,2452,565
Georgian 4,7751,9002,875
Yakut4,7611,8862,875
Tanzanian4,7101,8352,875
Panamanian4,7001,0903,610
Roma (Gypsy) 4,6307453,895
Frisian4,5907953,790
Karen4,5153,835680
Antiguan4,5051,2753,225
Malagasy4,5002,1552,345
Malian4,4852,3102,180
Paraguayan4,3256703,660
Montenegrin 4,1659153,245
Bantu,
not otherwise specified
3,9652,3151,645
Uzbek 3,9201,7302,190
Luxembourger 3,9154403,475
Bahamian3,6708102,860
Bhutanese3,6002,4401,160
Channel Islander3,5904353,155
Coptic 3,5351,4902,040
Puerto Rican 3,4104452,960
Western European origins,
not included elsewhere
3,3708402,530
Oromo3,3552,410945
Kazakh 3,3251,4651,860
Hawaiian3,2951203,175
Burkinabe3,1551,9801,165
Kashmiri 3,1151,0952,020
Bermudan3,0753102,765
Carib3,0351302,905
Angolan2,9551,1401,820
Kittitian/Nevisian2,9207502,165
Tajik 2,9101,2401,665
Kosovar2,8701,7101,160
Singaporean 2,8504952,355
Alsatian2,8003752,425
Sierra Leonean2,6201,5801,040
Maori2,5001552,345
Liberian2,4851,520965
Peulh2,4401,4251,015
Pacific Islands origins,
not included elsewhere
2,3354701,865
Kuwaiti2,2351,0801,155
Southern European origins,
not included elsewhere
2,1654401,730
Tigrian2,1551,340810
Martinican2,0053701,635
Cornish 1,9701201,855
Akan1,9551,235720
Edo1,9451,180765
Other North American origins,
not included elsewhere
1,8956551,240
Afrikaner1,8702801,595
Zambian1,8651,055805
Chadian1,8451,185655
Belizean1,7552501,505
Corsican1,7501651,590
Djiboutian1,710980730
Ashanti1,585765825
Uighur1,5551,010540
Amhara1,530710820
Samoan1,5301501,375
Hazara1,515585930
Arawak1,440551,385
Gabonese1,405595820
Seychellois1,285575710
Catalan1,2752001,075
Maure1,190400790
Guadeloupean1,130245885
Malinké1,120675455
Polynesian,
not otherwise specified
1,105901,015
Kyrgyz1,060580475
Turkmen1,040390655
Gambian975580395
Zulu945285660
Bavarian94050890
Montserratian935190745
Dinka900585320
Ewe845320525
Wolof835465375
Hmong810585220
Harari660395265
Chechen 100100100

Evolution from 1871 to 1921

During the fifty-year period beginning from the first census of independent Canada in 1871 until the census of 1921, the national ethnic composition was multicultural, however in the early period was dominated by four origin groups from western and northern Europe: French, English, Irish, and Scottish. [20] :512 Following the French and British Isles origin groups, Continental European communities were the largest in Canada, and grew fairly rapidly between the 1901 census and the 1921 census. [20] :512 Nominally small East Asian, South Asian, West Asian, and West African descended communities also existed during this time period. [20] :512

The ethnic French population, comprising a plurality of the total population from confederation until just prior to the 1921 census, overwhelmingly relied on natural increase for growth, with progeny stemming from early settlers who arrived throughout the 17th and 18th centuries; migration from France had been severely curtailed by the British Empire and early governments of independent Canada. Population growth amongst the French population occurred at relatively high pace, increasing from 1,082,940 persons in 1871 to 2,452,743 persons in 1921. [20] :512 Despite an increase of nearly 1.5 million persons during this fifty-year period, the French proportion of the total Canadian population dropped slightly, from 31.1 percent, to 27.1 percent. [20] :512

By contrast, large population increases amongst the three main ethnic groups from the British Isles (English, Irish, and Scottish) occurred through natural increase but relied heavily on high immigration rates that began in the early-mid 19th century dubbed the Great Migration of Canada − this continued through the early 20th century, spurred by record immigration rates during the 1900s and 1910s, when English immigrants formed a majority or plurality of all immigrants to Canada on an annual and decadal basis.

The English population, in particular, grew at a rapid pace, increasing from 705,369 persons in 1871 to 2,545,358 persons in 1921, representing an increase of nearly 2 million persons during the fifty-year period. [20] :512 During the same time period, the English proportion of the total Canadian population rose from 20.3 percent to 29.0 percent. [20] :512 The English community experienced massive growth principally during the first two decades of the 20th century as a result of record immigration at the time; during the era, persons of English descent also became the single largest ethnic group in Canada, comprising a plurality of the Canadian population by the 1921 census. [20] :512

The Irish population, meanwhile, witnessed steady, slowing population growth during the late 19th and early 20th century, with the proportion of the total Canadian population dropping from 24.3 percent in 1871 to 12.6 percent in 1921 and falling from the second-largest ethnic group in Canada from to fourth − principally due to massive immigration flows from England to Canada at the time − despite the population increasing from 846,414 persons to 1,107,803 persons in the fifty-year timeframe. [20] :512 The largest Irish population increases occurred prior to confederation, spurred by mass immigration during the mid-19th century at the height of the Great Migration of Canada, and was primarily due to The Great Famine and related poor economic conditions in Ireland at the time.

At the turn of the 20th century, overall immigrant proportions from the British Isles to Canada gradually dropped from a majority to a plurality. At the time, the federal government began supplementing increased mass immigration from the British Isles (mainly England) by also permitting large migration flows from continental Europe, especially Germany, Scandinavia, and the Soviet Union. This was primarily as a result of federal policy aimed at settling the Prairies through ethnic block settlements and ultimately led to the highest annual immigration rates in Canadian history since confederation in 1867 that remain unsurpassed in the contemporary era, including 1913 (new immigrants accounted for 5.3 percent of the total population), 1912 (5.1 percent), 1911 (4.6 percent), 1907 (4.3 percent) and 1910 (4.1 percent). [21] [22]

Largely due to increased immigration levels outside of the British Isles, the continental European population grew rapidly during the first two decades of the 20th century − comprising 1,246,151 persons or 14.2 percent as proportion of the total Canadian population by the 1921 census, representing a numerical increase of over 1 million persons from fifty years earlier in 1871, when the continental European population stood at approximately 236,043 persons or 6.8 percent of the total Canadian population. [20] :512

Broadening the multicultural makeup of Canada, the diversity across the Prairie provinces during the early 20th century was soon dubbed a cultural mosaic by journalist Victoria Hayward in the early 1920s:

"New Canadians, representing many places and widely separated sections of Old Europe, have contributed to the Prairie Provinces a variety in the way of Church Architecture. Cupolas and domes distinctly Eastern, almost Turkish, startle one above the tops of Manitoba maples or the bush of the river banks. These architectural figures of the landscape, apart altogether of their religious significance, are centers where, crossing the threshold on Sundays, one has the opportunity of hearing Swedish music, or the rich, deep chanting of the Russian responses; and of viewing at close hand the artistry that goes to make up the interior appointments of these churches transplanted from the East to the West… It is indeed a mosaic of vast dimensions and great breadth, essayed of the Prairie." [23]

Ethnic Origins of Canadians (1871−1921)
Ethnic
Origin
1871
[20] :512
1881
[20] :512
1901
[20] :512 [24] :370 [25] :354
1911
[20] :512 [24] :370 [25] :354
1921
[20] :512 [25] :356
Pop. %Pop.%Pop.%Pop.%Pop.%
French 1,082,9401,298,9291,649,3712,061,7192,452,743
Irish 846,414957,403988,7211,074,7381,107,803
English 705,369881,3011,260,8991,871,2682,545,358
Scottish 549,946699,863800,1541,027,0151,173,625
German 202,991254,319310,601403,417294,635
Indigenous 102,358108,547127,941105,611114,083
Dutch 29,66230,41233,84555,961117,505
African 21,49621,39417,43716,99418,291
Other
British
7,7739,94713,42126,06041,932
Scandinavian 1,6235,22331,042112,682167,369
Italian 1,0351,84910,83445,96366,769
Russian 6071,22719,82544,376100,064
Jewish 12566716,13176,199126,196
Chinese 4,38317,31227,83139,587
Austrian 10,94744,036107,671
Polish 6,28533,65253,403
Ukrainian 5,68275,432108,721
Japanese 4,7389,06715,868
Swiss 3,8666,62612,837
Belgian 2,9949,66420,234
Finnish 2,50215,50021,494
Syrian
Lebanese
Turkish
Armenian
1,6813,8809,260
Hungarian 1,54911,64813,181
Bulgarian
Romanian
3345,88315,235
Greek 2913,6145,740
Indian 1002,3421,018
Czech
Slovak
8,840
Yugoslav 3,906
Spanish 2,208
Lithuanian 1,970
Portuguese 487
Flag of Canada.svg Canada3,483,7614,324,8105,371,3157,206,6438,787,949

Evolution from 1996 to 2016

As regards combined responses, Canadian is the most common ethnic origin (11,113,965) in the 2016 Census (see above). This was also the case in the 2011 NHS (10,563,805), [26] 2006 Census (10,066,290), [27] 2001 Census (11,682,680), [28] and the 1996 Census (8,806,975). [29] Canadian was also the most common single ethnic origin in the 1996 (5,326,995), 2001 (6,748,135), 2006 (5,748,725), 2011 (5,834,535), and 2016 (6,436,940).

Ethnic Origin (Single Responses), 1996–2016
1996 [29] 2001 [28] 2006 [27] 2011 [26] 2016 [30]
#Ethnic OriginPop.#Ethnic OriginPop.#Ethnic OriginPop.#Ethnic OriginPop.#Ethnic OriginPop.
1Canadian5,326,9951Canadian6,748,1351Canadian5,748,7251Canadian5,834,5351Canadian6,436,940
2French2,665,2502English1,479,5252English1,367,1252English1,312,5702Chinese1,439,980
3English2,048,2753French1,060,7603French1,230,5353Chinese1,210,9453English1,098,925
4Chinese800,4704Chinese936,2104Chinese1,135,3654French1,165,4654Indian1,096,850
5Italian729,4555Italian726,2755Indian780,1755Indian919,1555French1,006,180
6German726,1456German705,6006Italian741,0456Italian700,8456Italian695,415
7Scottish642,9707Scottish607,2357German670,6407German608,5207Filipino651,390
8Irish504,0308Indian581,6658Scottish568,5158Scottish544,4408German569,650
9Indian438,7709Irish496,8659First Nations512,1509First Nations517,5509First Nations526,570
10First Nations394,55510First Nations455,80510Irish491,03010Filipino506,54510Scottish475,575
11Ukrainian331,68011Ukrainian326,19511Filipino321,39011Irish506,44511Irish457,905
12Dutch313,88012Dutch316,22012Dutch303,40012Dutch297,88512Dutch289,675
13Polish265,93013Filipino266,14013Ukrainian300,59013Ukrainian276,05513Ukrainian273,810
14Portuguese252,64014Polish260,41514Polish269,37514Polish255,13514Portuguese264,815
15Filipino198,42015Portuguese252,83515Portuguese262,23015Portuguese250,32015Polish264,415
16Jewish195,81016Jewish186,47516Greek145,25016Vietnamese157,45016Korean177,925
17Greek144,94017Greek143,78517Korean137,79017Korean154,35517Iranian170,755
18Jamaican128,57018Jamaican138,18018Vietnamese136,44518Jamaican142,87018Vietnamese165,390
19Vietnamese110,39019Vietnamese119,12019Jamaican134,32019Greek141,75519Jamaican161,495
20Hungarian94,18520Korean95,20020Jewish134,04520Iranian131,10020Pakistani156,300
Ethnic Origin (Single and Multiple Responses), 1996–2016
1996 [29] 2001 [28] 2006 [27] 2011 [26] 2016 [30]
#Ethnic OriginPop.#Ethnic OriginPop.#Ethnic OriginPop.#Ethnic OriginPop.#Ethnic OriginPop.
1Canadian8,806,2751Canadian11,682,6801Canadian10,066,2901Canadian10,563,8051Canadian11,135,965
2English6,832,0952English5,978,8752English6,570,0152English6,509,5002English6,320,085
3French5,597,8453French4,668,4103French4,941,2103French5,065,6903Scottish4,799,005
4Scottish4,260,8404Scottish4,157,2104Scottish4,719,8504Scottish4,714,9704French4,670,595
5Irish3,767,6105Irish3,822,6605Irish4,354,1555Irish4,544,8705Irish4,627,000
6German2,757,1406German2,742,7656German3,179,4256German3,203,3306German3,322,405
7Italian1,207,4757Italian1,270,3707Italian1,445,3357Italian1,488,4257Chinese1,769,195
8Ukrainian1,026,4758Chinese1,094,7008Chinese1,346,5108Chinese1,487,5808Italian1,587,970
9Chinese921,5859Ukrainian1,071,0609North American Indian1,253,6159First Nations1,369,1159First Nations1,525,570
10Dutch916,21510North American Indian1,000,89010Ukrainian1,209,08510Ukrainian1,251,17010Indian1,374,715
11North American Indian867,22511Dutch923,31011Dutch1,035,96511Indian1,165,14511Ukrainian1,359,655
12Polish786,73512Polish817,08512Polish984,56512Dutch1,067,24512Dutch1,111,655
13Indian548,08013Indian713,33013Indian962,66513Polish1,010,70513Polish1,106,585
14Jewish351,70514Norwegian363,76014Russian500,60014Filipino662,60014Filipino837,135
15Norwegian346,31015Portuguese357,69015Welsh440,96515British Isles, n.i.e.576,03015British Isles, n.i.e.644,695
16Welsh338,90516Welsh350,36516Filipino436,19016Russian550,52016Russian622,445
17Portuguese335,11017Jewish348,60517Norwegian432,51517Welsh458,70517Métis599,995
18Swedish278,97518Russian337,96018Portuguese410,85018Norwegian452,70518Portuguese482,605
19Russian272,33519Filipino327,55019Métis409,06519Métis447,65519Welsh474,805
20Hungarian250,52520Métis307,84520British Isles, n.i.e.403,91520Portuguese429,85020Norwegian463,275

Visible minority

Visible minority population by province and territory, 2016 [31]
Province/territory South Asian Chinese Black Filipino Latin American Arab Southeast Asian West Asian Korean Japanese Visible minority, n.i.e. Multiple visible minoritiesTotal visible minority populationTotal populationPercent visible minority
Alberta [32] 230,930158,200129,390166,19555,09056,70043,98520,98021,27512,1659,90028,360933,1653,978,14523.46%
British Columbia [33] 365,705508,48043,500145,02544,11519,84054,92048,69560,49541,2308,76040,4651,381,2354,560,24030.29%
Manitoba [34] 42,06022,54030,33579,8159,8955,0308,5652,6954,3751,8503,1956,485216,8501,240,70017.48%
New Brunswick [35] 2,5353,9257,0001,9801,2852,9601,2307301,68523030567524,535730,7103.36%
Newfoundland and Labrador [36] 2,6452,3252,3551,3906351,375340220806015025511,810512,2502.31%
Northwest Territories [37] 6153007601,3001351002555010015095903,96041,1359.63%
Nova Scotia [38] 7,9108,64021,9153,4001,6858,1101,1951,5401,5406956301,39558,650908,3406.46%
Nunavut [39] 11575330230404030101010201090535,5802.54%
Ontario [40] 1,150,415754,550527,715311,675195,950210,435133,855154,67088,93530,83097,970128,5853,885,58513,242,16029.34%
Prince Edward Island [41] 9202,57082567025558514521521011055856,640139,6854.75%
Quebec [42] 90,33599,505319,23034,910133,920213,74062,82032,4058,0554,5709,84023,0451,032,3657,965,45012.96%
Saskatchewan [43] 19,96015,54514,92532,3404,1954,3005,7452,0651,8759551,1502,820115,8751,070,56010.82%
Yukon [44] 5004152701,19013010180307065151203,00035,1158.54%
Canada [45] 1,924,6351,577,0601,198,540780,125447,325523,325313,260264,305188,71092,920132,090232,3757,674,58034,460,06522.27%
Visible minority in Canadian cities over 100,000 people, 2016 [46]
CityPopulationVisible minority Black East Asian Latin American South Asian Southeast Asian West Asian Arab Multiracial Other
Toronto 2,731,57151.5%8.9%13.2%2.9%12.6%7.2%2.2%1.3%1.8%1.4%
Montreal 1,704,69434.2%10.3%3.7%4.1%3.3%3.5%0.9%7.3%0.7%0.3%
Calgary 1,239,22036.2%4.2%8.5%2.1%9.5%7.3%1.0%2.0%1.1%0.4%
Ottawa 934,24326.3%6.6%5.1%1.2%4.2%2.7%1.0%4.5%0.9%0.3%
Edmonton 932,54637.1%5.9%7.3%1.9%9.5%7.7%0.7%2.6%1.1%0.4%
Mississauga 721,59957.2%6.6%8.7%2.3%23.2%7.2%1.1%5.1%1.9%1.3%
Winnipeg 705,22428.0%3.9%3.6%1.0%5.4%11.8%0.4%0.7%0.9%0.4%
Vancouver 631,48651.6%1.0%30.2%1.8%6.0%8.7%1.4%0.5%1.8%0.2%
Brampton 593,63873.3%13.9%1.7%2.4%44.3%4.8%0.9%1.0%1.6%2.7%
Hamilton 536,91719.0%3.8%2.5%1.6%4.2%2.8%0.9%2.0%0.7%0.5%
Quebec City 531,9026.4%2.4%0.5%1.3%0.3%0.5%0.1%1.2%0.1%0.1%
Surrey 517,88758.5%1.8%7.8%1.4%32.8%8.8%0.7%1.1%1.2%0.4%
Laval 422,99326.1%7.8%1.0%3.1%2.1%2.1%1.0%8.2%0.3%0.1%
Halifax 403,13111.4%3.8%2.2%0.3%1.6%0.9%0.3%1.8%0.3%0.1%
London 383,82219.9%3.0%3.8%2.4%3.1%2.1%0.9%3.6%0.6%0.4%
Markham 328,96677.9%2.9%46.8%0.5%17.8%3.8%2.4%1.0%2.1%0.9%
Vaughan 306,23335.4%2.7%8.7%2.4%10.1%5.1%2.9%1.4%1.4%0.8%
Gatineau 276,24513.5%6.1%1.0%1.5%0.4%0.7%0.3%3.1%0.3%0.2%
Longueuil 239,70018.6%7.0%1.4%3.1%0.8%1.3%0.8%3.2%0.4%0.3%
Burnaby 232,75563.6%1.6%38.9%2.0%8.1%7.7%2.2%0.7%2.1%0.3%
Saskatoon 246,37619.8%2.2%3.6%0.8%5.5%5.4%0.5%1.0%0.6%0.2%
Kitchener 233,22221.8%4.1%2.6%2.6%5.0%2.9%1.2%1.8%0.8%0.8%
Windsor 217,18826.9%5.0%3.6%1.2%4.5%3.0%0.6%7.5%0.9%0.6%
Regina 215,10619.2%3.0%6.2%0.6%5.9%5.2%0.3%0.7%0.4%0.2%
Richmond 198,30976.3%0.6%55.6%0.8%7.3%7.9%0.6%0.8%2.4%0.2%
Richmond Hill 195,02260.0%2.0%32.5%0.8%7.7%2.7%10.4%1.8%1.6%0.4%
Oakville 193,83230.8%2.9%9.0%1.9%8.9%2.4%1.1%3.2%1.0%0.4%
Burlington 183,31416.0%2.1%2.9%1.3%4.8%2.0%0.6%1.4%0.6%0.4%
Greater Sudbury 161,5313.8%0.9%0.7%0.2%0.9%0.4%0.1%0.4%0.1%0.0%
Sherbrooke 161,3237.3%2.2%0.4%1.7%0.3%0.4%0.8%1.2%0.2%0.0%
Oshawa 159,45816.0%5.5%2.0%0.8%3.8%1.6%0.4%0.6%0.8%0.8%
Saguenay 145,9491.4%0.5%0.2%0.2%0.1%0.1%0.0%0.2%0.0%0.0%
Lévis 143,4142.2%0.7%0.3%0.4%0.1%0.2%0.0%0.4%0.0%0.0%
Barrie 141,43410.3%2.7%1.8%1.1%2.2%1.4%0.2%0.3%0.4%0.3%
Abbotsford 141,39733.7%1.0%3.0%0.8%25.5%2.2%0.2%0.2%0.5%0.2%
St. Catharines 133,11312.7%2.9%2.7%1.7%1.4%1.8%0.3%1.1%0.7%0.2%
Trois-Rivières 134,4133.5%1.4%0.3%0.8%0.1%0.2%0.0%0.6%0.0%0.0%
Cambridge 129,92015.6%2.5%1.4%1.3%6.2%2.1%0.3%0.8%0.4%0.6%
Coquitlam 139,28450.2%1.1%29.3%1.6%4.5%5.2%5.6%1.0%1.7%0.2%
Kingston 123,7989.7%1.5%2.7%0.7%2.0%1.1%0.4%0.8%0.4%0.1%
Whitby 128,37725.3%8.0%3.1%1.1%6.6%2.4%1.0%0.8%1.5%0.9%
Guelph 131,79418.8%2.2%3.6%1.0%5.0%4.1%1.2%0.6%0.9%0.2%
Kelowna 127,3809.5%0.8%2.9%0.6%2.6%1.6%0.3%0.2%0.3%0.2%
Saanich 114,14822.1%1.0%10.5%0.7%5.0%3.0%0.4%0.6%0.6%0.2%
Ajax 119,67756.7%16.7%3.2%1.4%20.9%5.3%2.4%1.7%2.4%2.7%
Thunder Bay 107,9094.5%0.6%1.1%0.3%0.9%0.8%0.2%0.3%0.2%0.0%
Terrebonne 111,57511.8%4.5%0.4%1.7%0.1%0.6%0.1%1.7%0.1%0.0%
St. John's 108,8607.0%1.4%1.6%0.5%1.5%0.7%0.2%1.0%0.1%0.1%
Langley 117,28518.7%1.0%8.0%0.9%4.4%3.0%0.3%0.3%0.5%0.1%
Chatham-Kent 101,6474.6%2.1%0.6%0.2%0.6%0.5%0.0%0.2%0.2%0.1%
Milton 110,12842.8%4.8%3.1%2.4%21.0%4.7%0.9%3.5%1.4%0.9%
Waterloo 104,98626.4%1.9%10.6%1.4%6.4%1.7%1.1%1.8%0.9%0.6%
Delta 102,23836.0%0.8%9.2%0.8%20.3%3.2%0.3%0.3%0.8%0.3%
Red Deer 100,41815.5%1.8%1.8%1.8%1.7%7.0%0.4%0.5%0.4%0.1%

Aboriginal population

Total aboriginal population
Group1996 [47] 2001 [48] 2006 [49] 2011 [50] 2016 [51]
 %Total %Total %Total %Total %Total
Total Aboriginal2.8%799,0053.3%976,3053.8%1,172,7854.3%1,400,6854.9%1,673,780
First Nations 1.8%529,0402.1%608,8502.2%698,0252.6%851,5602.8%977,230
Métis 0.7%204,1151.0%292,3051.2%389,7801.4%451,7951.7%587,545
Inuit 0.14%40,2200.16%50,4850.2%59,4450.2%65,025

Note: Inuit, other Aboriginal and mixed Aboriginal groups are not listed as their own, but they are all accounted for in total Aboriginal

Aboriginal population by province and territory, 2011 [46]
Province/territoryNot Aboriginal First Nations Métis Inuit Aboriginal, n.i.e.Multiple Aboriginal identitiesTotal Aboriginal populationTotal population
Alberta [32] 2,690,960116,67096,8701,9853,3001,870220,6953,567,980
British Columbia [33] 2,911,295155,02069,4751,5703,7452,480232,2904,324,455
Manitoba [34] 824,830114,22578,8305801,0551,200195,8951,174,350
New Brunswick [35] 696,08016,1204,8504851,02015022,620735,835
Newfoundland and Labrador [36] 464,54019,3157,6606,2652,30026035,800507,270
Northwest Territories [37] 16,92013,3503,2504,3351854521,16040,800
Nova Scotia [38] 825,05521,89510,05069598022533,850906,175
Nunavut [39] 3,82512513027,070152027,36531,700
Ontario [40] 9,070,800201,10086,0203,3558,0402,910301,43012,651,795
Prince Edward Island [41] 130,8901,5204105523502,230137,380
Quebec [42] 6,740,37582,42540,96012,5704,4151,545141,9157,732,525
Saskatchewan [43] 787,745103,20552,4502901,120675157,7401,008,760
Yukon [44] 23,5906,58584517570257,70533,320
Canada [45] 25,186,890851,560451,79559,44026,47511,4151,400,68532,852,325
CityPopulationTotal Aboriginal First Nations Métis
Toronto 2,576,0250.7%0.5%0.2%
Montreal 1,612,6400.6%0.3%0.2%
Calgary 1,082,2352.7%1.2%1.4%
Ottawa 867,0902.1%1.2%0.7%
Edmonton 795,6755.3%2.4%2.7%
Mississauga 708,7250.5%0.3%0.1%
Winnipeg 649,99511.7%5.9%6.3%
Vancouver 590,2102.0%1.3%0.6%
Brampton 521,3150.7%0.4%0.2%
Hamilton 509,6402.0%1.6%0.3%
Quebec City 502,5950.9%0.5%0.4%
Surrey 463,3402.9%1.9%1.0%
Laval 392,7250.6%0.3%0.2%
Halifax 384,3302.5%1.5%0.8%
London 360,7151.9%1.4%0.4%
Markham 300,1350.2%0.1%0.1%
Vaughan 286,3050.2%0.1%0.0%
Gatineau 261,6653.5%1.8%1.5%
Longueuil 227,9701.0%0.6%0.0%
Burnaby 220,2551.5%0.9%0.5%
Saskatoon 218,31510.2%4.9%4.6%
Kitchener 215,9501.5%0.9%0.5%
Windsor 208,0152.3%1.3%0.9%
Regina 189,7409.9%5.8%3.9%
Richmond 189,3051.0%0.7%0.3%
Richmond Hill 184,3700.2%0.1%0.0%
Oakville 180,4300.6%0.4%0.2%
Burlington 173,4950.9%0.5%0.3%
Greater Sudbury 157,7658.2%3.8%4.1%
Sherbrooke 150,2550.9%0.5%0.3%
Oshawa 147,6802.0%1.2%0.8%
Saguenay 141,3352.5%0.8%1.6%
Lévis 135,8350.5%0.2%0.2%
Barrie 133,2402.6%1.4%1.2%
Abbotsford 130,9504.0%2.5%1.6%
St. Catharines 128,7701.9%1.2%0.6%
Trois-Rivières 126,9801.1%0.6%0.4%
Cambridge 125,0602.0%1.2%0.6%
Coquitlam 125,0152.1%1.1%0.9%
Kingston 118,9302.9%2.0%0.8%
Whitby 120,2851.2%0.7%0.4%
Guelph 120,5501.6%1.0%0.6%
Kelowna 114,5704.5%2.1%2.3%
Saanich 107,8552.7%1.5%1.1%
Ajax 109,2201.0%0.7%0.3%
Thunder Bay 105,9509.5%7.3%2.0%
Terrebonne 105,6100.7%0.5%0.1%
St. John's 103,9052.6%1.2%0.8%
Langley 103,1453.4%1.6%1.7%
Chatham-Kent 101,6802.9%1.7%0.9%

See also

Notes

  1. The 2021 census on ethnic or cultural origins, Statistics Canada states: "Given the fluid nature of this concept and the changes made to this question, 2021 Census data on ethnic or cultural origins are not comparable to data from previous censuses and should not be used to measure the growth or decline of the various groups associated with these origins". [2]
  2. 1 2 All citizens of Canada are classified as "Canadians" as defined by Canada's nationality laws. "Canadian" as an ethnic group has since 1996 been added to census questionnaires for possible ancestral origin or descent. "Canadian" was included as an example on the English questionnaire and "Canadien" as an example on the French questionnaire. [4] "The majority of respondents to this selection are from the eastern part of the country that was first settled. Respondents generally are visibly European (Anglophones and Francophones) and no longer self-identify with their ethnic ancestral origins. This response is attributed to a multitude of reasons such as generational distance from ancestral lineage." [5] [6]
  3. Indigenous peoples are not considered a visible minority in Statistics Canada calculations. Visible minorities are defined by Statistics Canada as "persons, other than aboriginal peoples, who are non-Caucasian in race or non-white in colour". [10]
  4. The category "North American Indian" includes respondents who indicated that their ethnic origins were from a Canadian First Nation, or another non-Canadian North American aboriginal group (excluding Inuit and Métis).
    Source: "How Statistics Canada Identifies Aboriginal Peoples". Statistics Canada. Retrieved January 16, 2011.

Related Research Articles

<span class="mw-page-title-main">Demographics of Canada</span>

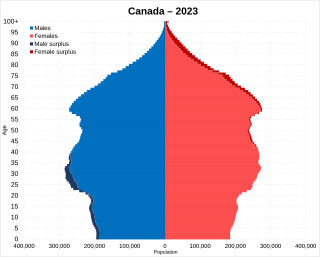
Statistics Canada conducts a country-wide census that collects demographic data every five years on the first and sixth year of each decade. The 2021 Canadian census enumerated a total population of 36,991,981, an increase of around 5.2 percent over the 2016 figure, Between 1990 and 2008, the population increased by 5.6 million, equivalent to 20.4 percent overall growth. The main driver of population growth is immigration. Between 2011 and May 2016, Canada's population grew by 1.7 million people, with immigrants accounting for two-thirds of the increase.

The demographics of Toronto, Ontario, Canada make Toronto one of the most multicultural and multiracial cities in the world. In 2021, 57.0 percent of the residents of the metropolitan area belonged to a visible minority group, compared with 51.4 percent in 2016, and 13.6 percent in 1981. Toronto also has established ethnic neighbourhoods such as the multiple Chinatowns, Corso Italia, Little Italy, Little India, Greektown, Koreatown, Little Tokyo, Little Jamaica, Little Portugal, Little Malta, Roncesvalles (Polish), and Bloor West Village (Ukrainian), all of which celebrate the city's multiculturalism. Data from the suburban municipalities are also included for some metrics as most of these municipalities are part of the Toronto CMA.

Danish Canadians are Canadian citizens of Danish ancestry. According to the 2006 Census, there were 200,035 Canadians with Danish background, 17,650 of whom were born in Denmark.

The demographics of Metro Vancouver indicate a multicultural and multiracial region. Metro Vancouver is a metropolitan area, with its major urban centre being Vancouver, British Columbia, Canada. The Vancouver census metropolitan area, as defined by Statistics Canada, encompasses roughly the same territory as the Metro Vancouver Regional District, a regional district in British Columbia. The regional district includes 23 local authorities. Figures provided here are for the Vancouver census metropolitan area and not for the City of Vancouver.

<span class="mw-page-title-main">Demographics of British Columbia</span>

British Columbia is a Canadian province with a population of about 5.5 million people. The province represents about 13.2% of the population of the Canadian population. Most of the population is between the ages of 15 and 49. About 60 percent of British Columbians have European descent with significant Asian and Aboriginal minorities and just under 30% of British Columbians are immigrants. Over half of the population is irreligious, with Christianity and Sikhism being the most followed religions.

<span class="mw-page-title-main">Demographics of Ontario</span>

Ontario, one of the 13 provinces and territories of Canada, is located in east-central Canada. It is Canada's most populous province by a large margin, accounting for nearly 40 percent of all Canadians, and is the second-largest province in total area. Ontario is fourth-largest in total area when the territories of the Northwest Territories and Nunavut are included. It is home to the nation's capital city, Ottawa, and the nation's most populous city, Toronto.

<span class="mw-page-title-main">Demographics of Alberta</span>

Alberta has experienced a relatively high rate of growth in recent years, due in large part to its economy. Between 2003 and 2004, the province saw high birthrates, relatively high immigration, and a high rate of interprovincial migration when compared to other provinces. Approximately 81% of the population live in urban areas and only about 19% live in rural areas. The Calgary–Edmonton Corridor is the most urbanized area in Alberta and is one of Canada's four most urban regions. Many of Alberta's cities and towns have also experienced high rates of growth in recent history. From a population of 73,022 in 1901, Alberta has grown to 4,262,635 in 2021 and in the process has gone from less than 1.5% of Canada's population to 11.5%. It is the fourth most populated province in Canada. Between the 2016 and 2021 censuses, the Alberta population grew by 4.8%.

<span class="mw-page-title-main">Demographics of Prince Edward Island</span>

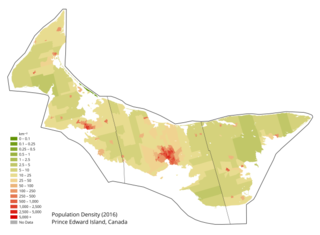
Prince Edward Island is a Canadian province. According to the 2011 National Household Survey, the largest ethnic group consists of people of Scottish descent (39.2%), followed by English (31.1%), Irish (30.4%), French (21.1%), German (5.2%), and Dutch (3.1%) descent. Prince Edward Island is mostly a white community and there are few visible minorities. Chinese people are the largest visible minority group of Prince Edward Island, comprising 1.3% of the province's population. Almost half of respondents identified their ethnicity as "Canadian." Prince Edward Island is by a strong margin the most Celtic and specifically the most Scottish province in Canada and perhaps the most Scottish place (ethnically) in the world, outside Scotland. 38% of islanders claim Scottish ancestry, but this is an underestimate and it is thought that almost 50% of islanders have Scottish roots. When combined with Irish and Welsh, almost 80% of islanders are of some Celtic stock, albeit most families have resided in PEI for at least two centuries. Few places outside Europe can claim such a homogeneous Celtic ethnic background. The only other jurisdiction in North America with such a high percentage of British Isles heritage is Newfoundland.

<span class="mw-page-title-main">Demographics of Saskatchewan</span>

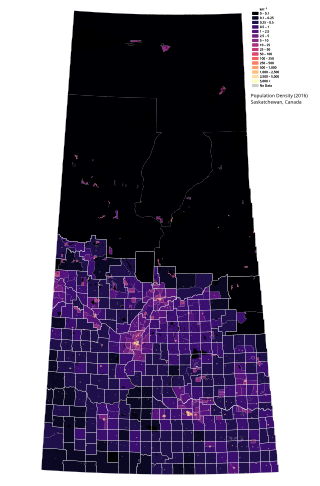
Saskatchewan is the middle province of Canada's three Prairie provinces. It has an area of 651,900 km² (251,700 mi²) and a population of 1,132,505 (Saskatchewanians) as of 2021. Saskatchewan's population is made of 50.3% women and 49.7% men. Most of its population lives in the Southern half of the province.

<span class="mw-page-title-main">Demographics of Manitoba</span>

Manitoba is one of Canada's 10 provinces. It is the easternmost of the three Prairie provinces.

<span class="mw-page-title-main">Demographics of Newfoundland and Labrador</span>

Newfoundland and Labrador is a province of Canada on the country's Atlantic coast in northeastern North America. The province has an area of 405,212 square kilometres and a population in 2023 of 533,710, with approximately 95% of the provincial population residing on the Island of Newfoundland, with more than half of the population residing on the Avalon Peninsula. People from Newfoundland and Labrador are called "Newfoundlanders," "Labradorians", or "Newfoundlanders and Labradorians".

<span class="mw-page-title-main">Demographics of Nova Scotia</span> Demographics of region

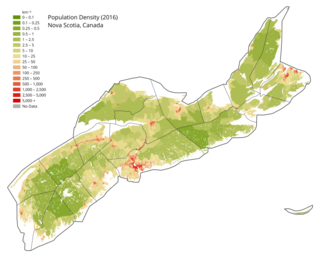
Nova Scotia is a Canadian province located on the country's southeastern coast. It is the most populous province in Atlantic Canada, and its capital, Halifax, is a major economic centre of the region. Geographically, Nova Scotia is the second smallest province in Canada, with an area of 52,824.71 km2 (20,395.73 sq mi). As of 2021, it has a population of 969,383 people.

<span class="mw-page-title-main">Demographics of New Brunswick</span>

New Brunswick is one of Canada's three Maritime provinces and the only officially bilingual province in the country. The provincial Department of Finance estimates that the province's population in 2006 was 729,997 of which the majority is English-speaking but with a substantial French-speaking minority of mostly Acadian origin.

The Northwest Territories is a territory of Canada. It has an area of 1,171,918 square kilometres and a population of 41,786 as of the 2016 Canadian census.

Yukon is the westernmost of Canada's three northern territories. Its capital is Whitehorse. People from Yukon are known as Yukoners. Unlike in other Canadian provinces and territories, Statistics Canada uses the entire territory as a single at-large census division.

<span class="mw-page-title-main">Demographics of Nunavut</span>

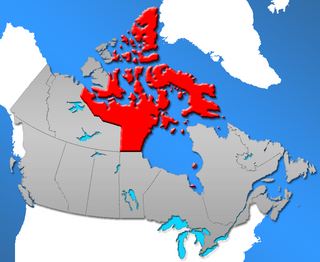
Nunavut is a territory of Canada. It has a land area of 1,877,787.62 km2 (725,017.85 sq mi). It has a population of 36,858 in the 2021 Census. In the 2016 census the population was 35,944, up 12.7% from the 2011 census figure of 31,906. In 2016, 30,135 people identified themselves as Inuit, 190 as North American Indian (0.5%), 165 Métis (0.5%) and 5,025 as non-aboriginal (14.0%).

According to the 2021 census, the City of Edmonton had a population of 1,010,899 residents, compared to 4,262,635 for all of Alberta, Canada. The total population of the Edmonton census metropolitan area (CMA) was 1,418,118, making it the sixth-largest CMA in Canada.

The demographics of Winnipeg reveal the city to be a typically Canadian one: multicultural and multilingual. Winnipeg is also prominent in the size and ratio of its First Nations population, which plays an important part in the city's makeup. About 12.4% of Winnipeggers are of Indigenous descent, which vastly exceeds the national average of 5.0%.

South African Canadians are Canadians of South African descent. Most South African Canadians are White South Africans, mostly of British and Afrikaner ancestry. According to the 2021 Canada census there were 51,590 South African-born immigrants in Canada. It includes those who hold or have ever held permanent resident status in Canada, including naturalized citizens. 12,270 people considered Afrikaans their mother tongue.

<span class="mw-page-title-main">Canada immigration statistics</span> Historic and contemporary immigration statistics of Canada

Since confederation in 1867 through to the contemporary era, decadal and demi-decadal census reports in Canada have compiled detailed immigration statistics. During this period, the highest annual immigration rate in Canada occurred in 1913, when 400,900 new immigrants accounted for 5.3 percent of the total population, while the greatest number of immigrants admitted to Canada in single year occurred in 2022, with 437,500 persons accounting for 1.1 percent of the total population.

References

  1. 1 2 "Population and growth components (1851–2001 Censuses)". Statistics Canada. 2010. Retrieved 2011-01-19.
  2. 1 2 3 4 5 6 7 8 9 "The Canadian census: A rich portrait of the country's religious and ethnocultural diversity". Statistics Canada, Government of Canada. The Daily. 26 October 2022b. Retrieved 1 January 2023.
  3. 1 2 Government of Canada, Statistics Canada (2022-10-26). "Ethnic or cultural origin by gender and age: Canada, provinces and territories, census metropolitan areas and census agglomerations with parts". www12.statcan.gc.ca. Archived from the original on 2023-12-12. Retrieved 2022-10-26.
  4. Simon, Patrick; Piché, Victor (2013). Accounting for Ethnic and Racial Diversity: The Challenge of Enumeration. Routledge. pp. 48–49. ISBN   978-1-317-98108-4.
  5. Bezanson, Kate; Webber, Michelle (2016). Rethinking Society in the 21st Century (4th ed.). Canadian Scholars' Press. pp. 455–456. ISBN   978-1-55130-936-1.
  6. Edmonston, Barry; Fong, Eric (2011). The Changing Canadian Population. McGill-Queen's University Press. pp. 294–296. ISBN   978-0-7735-3793-4.
  7. Government of Canada, Statistics Canada (2022-10-26). "Census Profile, 2021 Census of Population Profile table Canada [Country] Total - Ethnic or cultural origin for the population in private households - 25% sample data". www12.statcan.gc.ca. Archived from the original on 2022-10-29. Retrieved 2022-10-28.
  8. 1 2 Government of Canada, Statistics Canada (2022-10-26). "Visible minority and population group by generation status: Canada, provinces and territories, census metropolitan areas and census agglomerations with parts". www12.statcan.gc.ca. Retrieved 2022-10-29.
  9. "The Daily — Indigenous population continues to grow and is much younger than the non-Indigenous population, although the pace of growth has slowed". Statistics Canada. 2022-09-21. Retrieved 2022-10-29.
  10. "Classification of visible minority". Statistics Canada. July 25, 2008. Archived from the original on July 14, 2011. Retrieved September 18, 2009.
  11. "Census Profile, 2016 Census". Statistics Canada. February 8, 2017. Archived from the original on October 15, 2017. Retrieved February 16, 2018.
  12. Pendakur, Krishna. "Visible Minorities and Aboriginal Peoples in Vancouver's Labour Market". Simon Fraser University. Archived from the original on May 16, 2011. Retrieved June 30, 2014.
  13. "The Daily — Immigrants make up the largest share of the population in over 150 years and continue to shape who we are as Canadians". Statistics Canada. 2022-10-26. Retrieved 2022-10-29.
  14. "2021 Annual Report to Parliament on Immigration". Immigration, Refugees and Citizenship Canada. 2022-03-15.
  15. 1 2 3 4 Government of Canada, Statistics Canada (2022-10-26). "Immigrants make up the largest share of the population in over 150 years and continue to shape who we are as Canadians". The Daily. Retrieved 2023-01-02.
  16. 1 2 3 Adams, Michael; Parkin, Andrew (December 31, 2022). "Canadians aren't just adapting to diversity – there's data to show we're embracing it". The Globe and Mail. Retrieved January 1, 2023.
  17. Source: "Ethnocultural Portrait of Canada – Data table". Statistics Canada. Archived from the original on 2013-07-27. Retrieved 2011-01-16.Additional data: "2006 Census release topics". Statistics Canada. Retrieved 2011-01-16.
  18. ""Canadian" tops the more than 450 ethnic or cultural origins reported by the population of Canada". Statistics Canada. October 26, 2022. Retrieved July 8, 2023.
  19. 1 2 3 4 5 6 7 8 "Immigration and Ethnocultural Diversity Highlight Tables". statcan.gc.ca. 25 October 2017.
  20. 1 2 3 4 5 6 7 8 9 10 11 12 13 14 15 Government of Canada, Statistics Canada (2013-04-03). "Seventh census of Canada, 1931 . v. 13. Monographs - unemployment, dependency of youth, rural and urban composition of the Canadian population, racial origins and nativity of the Canadian people". www12.statcan.gc.ca. Retrieved 2022-11-07.
  21. Government of Canada, Statistics Canada (17 May 2018). "150 years of immigration in Canada". www12.statcan.gc.ca. Retrieved 2022-11-09.
  22. Government of Canada, Statistics Canada (2013). "Censuses of Canada 1665 to 1871: Estimated population of Canada, 1605 to present" . Retrieved 2022-11-09.
  23. Day, Richard J.F. (2000). Multiculturalism and the History of Canadian Diversity. Toronto: University of Toronto Press, 149-150.
  24. 1 2 Government of Canada, Statistics Canada (2013-04-03). "Fifth census of Canada 1911 . v. 2. Religions, origins, birthplace, citizenship, literacy and infirmities, by provinces, districts and sub-districts". www12.statcan.gc.ca. Retrieved 2022-11-07.
  25. 1 2 3 Government of Canada, Statistics Canada (2013-04-03). "Sixth census of Canada,1921 . v. 1. Population: number, sex and distribution, racial origins, religions". www12.statcan.gc.ca. Retrieved 2022-11-07.
  26. 1 2 3 Government of Canada, Statistics Canada (2013-05-08). "2011 National Household Survey: Data tables – Ethnic Origin (264), Single and Multiple Ethnic Origin Responses (3), Generation Status (4), Age Groups (10) and Sex (3) for the Population in Private Households of Canada, Provinces, Territories, Census Metropolitan Areas and Census Agglomerations, 2011 National Household Survey". www12.statcan.gc.ca. Retrieved 2019-09-20.
  27. 1 2 3 Government of Canada (2008-04-02). "Statistics Canada: Ethnocultural Portrait of Canada Highlight Tables, 2006 Census". Statistics Canada. Retrieved 2019-09-20.
  28. 1 2 3 "English title / Titre en anglais". www12.statcan.gc.ca. Retrieved 2019-09-20.
  29. 1 2 3 Government of Canada, Statistics Canada (1998-02-17). "1996 Census of Canada: Data tables – Population by Ethnic Origin (188) and Sex (3), Showing Single and Multiple Responses (3), for Canada, Provinces, Territories and Census Metropolitan Areas, 1996 Census (20% Sample Data)". www12.statcan.gc.ca. Retrieved 2019-09-20.
  30. 1 2 Government of Canada, Statistics Canada (2017-10-25). "Ethnic Origin (279), Single and Multiple Ethnic Origin Responses (3), Generation Status (4), Age (12) and Sex (3) for the Population in Private Households of Canada, Provinces and Territories, Census Metropolitan Areas and Census Agglomerations, 2016 Census - 25% Sample Data". www12.statcan.gc.ca. Retrieved 2019-09-21.
  31. "File Not Found". Statistics Canada.
  32. 1 2 Statistics Canada, National Household Survey (NHS) Profile, 2011
  33. 1 2 Statistics Canada, National Household Survey (NHS) Profile, 2011
  34. 1 2 Statistics Canada, National Household Survey (NHS) Profile, 2011
  35. 1 2 Statistics Canada, National Household Survey (NHS) Profile, 2011
  36. 1 2 Statistics Canada, National Household Survey (NHS) Profile, 2011
  37. 1 2 Statistics Canada, National Household Survey (NHS) Profile, 2011
  38. 1 2 Statistics Canada, National Household Survey (NHS) Profile, 2011
  39. 1 2 Statistics Canada, National Household Survey (NHS) Profile, 2011
  40. 1 2 Statistics Canada, National Household Survey (NHS) Profile, 2011
  41. 1 2 Statistics Canada, National Household Survey (NHS) Profile, 2011
  42. 1 2 Statistics Canada, National Household Survey (NHS) Profile, 2011
  43. 1 2 Statistics Canada, National Household Survey (NHS) Profile, 2011
  44. 1 2 Statistics Canada, National Household Survey (NHS) Profile, 2011
  45. 1 2 Statistics Canada, National Household Survey (NHS) Profile, 2011
  46. 1 2 Canada, Government of Canada, Statistics (15 January 2001). "Census Program". www12.statcan.gc.ca. Retrieved 2018-04-12.{{cite web}}: CS1 maint: multiple names: authors list (link)
  47. Statistics Canada, Population by Aboriginal Groups and Sex, Showing Age Groups, for Canada, 1996 Census (20% Sample Data)
  48. Statistics Canada Archived 2008-10-06 at the Wayback Machine , Community Highlights for Canada
  49. Statistics Canada Archived 2009-04-20 at the Wayback Machine , 2006 Community Profiles: Canada (Country)
  50. Statistics Canada, NHS Profile, Canada, 2011
  51. Government of Canada, Statistics Canada (October 25, 2017). "Aboriginal Identity (9), Age (20), Registered or Treaty Indian Status (3) and Sex (3) for the Population in Private Households of Canada, Provinces and Territories, Census Metropolitan Areas and Census Agglomerations, 2016 Census - 25% Sample Data". www12.statcan.gc.ca.

Further reading