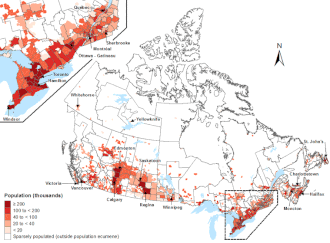
Canada ranks 36th by population among countries of the world, comprising about 0.5% of the world's total, [2] with more than 40 million Canadians as of 2024. [3] [4] Despite being the second-largest country by total area (fourth-largest by land area), the vast majority of the country is sparsely inhabited, with most of its population south of the 55th parallel north. Just over 60 percent of Canadians live in just two provinces: Ontario and Quebec. Though Canada's overall population density is low, many regions in the south, such as the Quebec City–Windsor Corridor, have population densities higher than several European countries. Canada has six population centres with more than one million people: Toronto, Montreal, Vancouver, Calgary, Edmonton and Ottawa.
The large size of Canada's north, which is currently not arable, and thus cannot support large human populations, significantly lowers the country's carrying capacity. In 2021, the population density of Canada was 4.2 people per square kilometre. [5]
The historical growth of Canada's population is complex and has been influenced in many different ways, such as Indigenous populations, expansion of territory, and human migration. Immigration has been, and remains, the most important factor in Canada's population growth. [6] The 2021 Canadian census counted a total population of 36,991,981, an increase of around 5.2 per cent over the 2016 figure. [7] [8] Between 1990 and 2008, the population increased by 5.6 million, equivalent to 20.4 per cent overall growth. [9]
A variety of estimations have been postulated for the Indigenous population in what is now Canada prior to European contact. [11] Estimates of this population during the late 15th century range between 200,000 [12] and two million, [13] with a figure of 500,000 currently accepted by Canada's Royal Commission on Aboriginal Peoples. [14] Although not without conflict, European Canadians' early interactions with First Nations and Inuit populations were relatively peaceful. [15] However repeated outbreaks of European infectious diseases such as influenza, measles and smallpox (to which they had no natural immunity), [16] combined with other effects of European contact, resulted in a twenty-five per cent to eighty per cent Indigenous population decrease post-contact. [12] Roland G Robertson suggests that during the late 1630s, smallpox killed over half of the Wyandot (Huron), who controlled most of the early North American fur trade in the area of New France. [17] In 1822 the Indigenous Canadian population, excluding the Métis, was estimated as 283,500 people. [18] In 1871 there was an enumeration of the Indigenous population within the limits of Canada at the time, showing a total of only 102,358 individuals. [19] In 1885 the number of Indigenous people in Canada was reported as 131,952 individuals. [20] From 2006 to 2016, the Indigenous population has grown by 42.5 per cent, four times the national rate. [21] The Indigenous population representing 5 percent or 1.8 million individuals, grew by 9.4 percent compared to the non-Indigenous population, which grew by 5.3 percent from 2016 to 2021. [22] The 2021 Census data reveals that there are over 1. 8 million Indigenous people in Canada, comprising 5. 0% of the overall Canadian population, a slight increase from 4. 9% in 2016, [23]
The European population grew slowly under French rule, [24] thus remained relatively low as growth was largely achieved through natural births, rather than by immigration. [25] Most of the French were farmers, and the rate of natural increase among the settlers themselves was very high. [26] The women had about 30 per cent more children than comparable women who remained in France. [27] Demographer Yves Landry says, "Canadians had an exceptional diet for their time." [27] The 1666 census of New France was the first census conducted in North America. [28] It was organized by Jean Talon, the first Intendant of New France, between 1665 and 1666. [28] According to Talon's census there were 3,215 people in New France, comprising 538 separate families. [29] The census showed a great difference in the number of men at 2,034 versus 1,181 women. [29] By the early 1700s the New France settlers were well established along the Saint Lawrence River and Acadian Peninsula with a population around 15,000 to 16,000. [30] Mainly due to natural increase and modest immigration from Northwest France (Brittany, Normandy, Île-de-France, Poitou-Charentes and Pays de la Loire) the population of New France increased to 55,000 according to the last French census of 1754. [31] This was an increase from 42,701 in 1730. [32]
During the late 18th and early 19th century Canada under British rule experienced strong population growth. In the wake of the 1775 invasion of Canada by the newly formed Continental Army during the American Revolutionary War, approximately 60,000 of the 80,000 Americans loyal to the Crown, designated later as United Empire Loyalists fled to British North America, a large portion of whom migrated to Nova Scotia and New Brunswick (separated from Nova Scotia) in 1784. [33] Although the exact numbers cannot be certain because of unregistered migration [34] At least 20,000 went to Nova Scotia, 14,000 to New Brunswick; 1,500 to PEI and 6,000 to Ontario(13,000 including 5,000 blacks went to England and 5,500 to the Caribbean). For the rest of the 1780s additional immigrants arrived from the south. From 1791 An additional 30,000 Americans, called "Late Loyalists", were lured into Ontario in the 1790s by the promise of land and swearing loyalty to the Crown. [35] As a result of the period known as the Great Migration by 1831, Lower Canada's population had reached approximately 553,000, with Upper Canada reaching about 237,000 individuals. [36] The Great Famine of Ireland of the 1840s had significantly increased the pace of Irish immigration to Prince Edward Island and the Province of Canada, peaking in 1847 with 100,000 distressed individuals. [37] By 1851, the population of the Maritime colonies also reached roughly 533,000 (277,000 in Nova Scotia, 194,000 in New Brunswick and 62,000 in Prince Edward Island). [38] To the west British Columbia had about 55,000 individuals by 1851. [38] Beginning in the late 1850s, the immigration of Chinese into the Colony of Vancouver Island and Colony of British Columbia peaked with the onset of the Fraser Canyon Gold Rush. [39] By 1861, as a result of natural births and the Great Migration of Canada from the British Isles, the Province of Canada population increased to 3.1 million inhabitants. [38] Newfoundland's population by 1861 reached approximately 125,000 individuals. [38]
The population has increased every year since the establishment of the Dominion of Canada in 1867; however, the population of Newfoundland was not included prior to its entry into confederation as Canada's tenth province in 1949. [40] [41] The first national census of the country was taken in 1871, with a population count around 3,689,000. [42] The year with the least population growth (in real terms) was 1882–1883, when only 30,000 new individuals were enumerated. [41]
The 1911 census was a detailed enumeration of the population showing a count of 7,206,643 individuals. [43] This was an increase of 34% over the 1901 census of 5,371,315. [44] The year with the most population growth was during the peak of the Post-World War II baby boom in 1956–1957, when the population grew by over 529,000, in a single twelve-month period. [41] The Canadian baby boom, defined as the period from 1947 to 1966, saw more than 400,000 babies born annually. [45] The 1996 census recorded a total population of 28,846,761. [46] This was a 5.7% increase over the 1991 census of 27,296,859. [46] The 2001 census had a total population count of 30,007,094. [47] In contrast, the official Statistics Canada population estimate for 2001 was 31,021,300. [48]
Canada's total population enumerated by the 2006 census was 31,612,897. [49] This count was lower than the official 1 July 2006 population estimate of 32,623,490 people. [49] Ninety per cent of the population growth between 2001 and 2006 was concentrated in the main metropolitan areas. [50] The 2011 census was the fifteenth decennial census with a total population count of 33,476,688 up 5.9% from 2006. On average, censuses have been taken every five years since 1905. Censuses are required to be taken at least every ten years as mandated in section 8 of the Constitution Act, 1867. [51]
A population estimate for 2022 put the total number of people in Canada at 38,232,593. [52]
Demographic statistics according to the World Population Review in 2022. [53]
In 2010, Canada's annual population growth rate was 1.238%, or a daily increase of 1,137 individuals. [41] Between 1867 and 2009 Canada's population grew by 979%. [41] Canada had the highest net migration rate (0.61%) of all G-8 member countries between 1994 and 2004. [41] Natural growth accounts for an annual increase of 137,626 persons, at a yearly rate of 0.413%. [41] Between 2001 and 2006, there were 1,446,080 immigrants and 237,418 emigrants, resulting in a net migration of just over 1.2 million people. [41] Since 2001 until 2010, immigration has ranged between 221,352 and 262,236 immigrants per annum. [54]
In 2023, Canada's population jumped by over 1 million people for the first time in the country's history. The population now stands at 39.5 million and is set to pass the 40 million mark later this year. The population growth has largely been fuelled by migrants who have been brought into the country to ease labour shortages. [55]
Prior to Canadian confederation in 1867 the population counts reflected only the former colonies and settlements and not the country to be as a whole with Indigenous nations separated. [56]
Year | Area/colony | Population | Notes [57] |
---|---|---|---|
1000 | L'Anse aux Meadows (Newfoundland) | 30 to 160 | Archaeological evidence of a short-lived Norse settlement was found at L'Anse aux Meadows, on the northernmost tip of the island of Newfoundland (carbon dating estimate 990–1050 AD. [58] ) There is no record of how many men and women lived at the site at any given time, however archaeological evidence of the dwellings suggest it had the capacity of supporting 30 to 160 individuals. [59] |
1541 | Cap-Rouge (Quebec City) | 400 | Jacques Cartier established Charlesbourg-Royal at Cap-Rouge on his third voyage. Even though scurvy was cured through the Indigenous remedy (Thuja occidentalis infusion), the impression left is of a general misery with the effort being abandoned. [60] During the winter 35 of Cartier's men perished. [60] |
1543 | Cap-Rouge (Quebec City) | 200 | In 1542, Jean-François Roberval tried to re-invigorate the Charlesbourg-Royal colony at Cap-Rouge which Roberval renamed France-Roy, however after a set of disastrous winters the effort was abandoned. [61] En route to Charlesbourg-Royal, Roberval had abandoned his near-relative Marguerite de La Rocque with her lover on the "Isle of Demons" (now called Harrington Island), in the Gulf of Saint Lawrence, as punishment for their affair. [62] The young man, their servant and baby died, but Marguerite survived to be rescued by fishermen and returned to France two years later. [62] |
1583 | St. John Bay (Newfoundland) | 260 | Humphrey Gilbert with 260 men planned a settlement; however, during exploration of the coast line a ship was lost containing many of the prospective colonists and their provisions. [63] |
1598 | Sable Island (Nova Scotia) | 50 | Marquis de La Roche-Mesgouez and 40 convicts (peasants and beggars) with 10 soldiers settled on Sable Island, but this colonization attempt failed, culminating in a revolt with only 11 survivors evacuated. [64] [65] |
1600 | Tadoussac (Quebec) | 16 | François Gravé Du Pont with 16 men built a fur trading post at Tadoussac; however, only five of the men survived the winter before returning to France. [65] |
1604 | Saint Croix (Maine) | 79 | The St. Croix settlement of Maine was the first real attempt at a year-round base of operation in New France. The expedition was led by Pierre Du Gua de Monts with 79 settlers including François Gravé Du Pont, Royal cartographer Samuel de Champlain, the Baron de Poutrincourt, apothecary Louis Hébert, a priest Nicolas Aubry, and Mathieu de Costa a linguist. [66] The St. Croix settlement was abandoned the following summer for a new habitation at Port-Royal after 35 died of scurvy. [67] |
The first in date of the Colonies which became successful, and which consequently marked the starting point of European settlements on what would be Canada , was the foundation of Port Royal, Acadia. [68] List of censuses. [69] [70]
Year | Area/colony | Population [71] [72] [73] | Notes [56] |
---|---|---|---|
1605 | Port Royal (Nova Scotia) | 44 | The 44 colonists are surviving members of 79 from the now abandoned St. Croix settlement of Maine. [65] However, the habitation at Port-Royal was also abandoned and left in the care of the local Mi'kmaq. [67] The settlement was later moved upstream and to the south bank of the Annapolis River, keeping the name Port-Royal and becoming the capital of Acadia. [74] |
1608 | Quebec City | 28 | Samuel de Champlain establishes the colony with 28 settlers. [65] Half of the men that winter the first year die of scurvy or starvation. [75] Nevertheless, new settlers arrive resulting in Quebec being the first permanent settlement, and also the capital of, the French colony of Canada. |
1610 | Cuper's Cove (Newfoundland) | 40 | The Newfoundland Colony is established by John Guy his brother Phillip and his brother-in-law William Colston with 39 colonists who spend the winter of 1610–1611 at Cuper's Cove. [76] By the fall of 1613 sixteen structures are completed by about 60 settlers on the site. [77] [78] As England tried to create a foothold in the north, other settlements were established at Bristol's Hope, Renews, New Cambriol, South Falkland and Avalon, an area that became known as the English Shore. However the majority of the population did not stay year round returning in the spring of each year. Over the next 100 years the English colonies of Newfoundland grew very slowly, and had only 3,000 permanent residents by the 1720s. [79] |
1629 | Quebec city | 117 | *90 wintering belonged to Kirke's English Expedition that had captured the city. [80] Under brief British control the city begins to grow and be fortified. [81] Prior to 1632 only eight births were recorded among the 60 to 70 permanent European settlers. [81] [82] The first European child born in Quebec had been Hélène Desportes, in 1620. [83] |
1641 | New France | 240 | De facto population of Canada (New France) and Acadia, now situated partly in the future United States. [82] |
1642 | Fort Ville-Marie (Old Montreal) | 50 | New colony with the majority of immigrants coming directly from France led by Paul de Chomedey and Jeanne Mance, a lay woman. [84] |
1666 | Canada (New France) | 3,215 | The 1660s marked the only real "wave" of French settlers arriving until the Treaty of Utrecht in 1713. [85] Following the initial wave of French settlers natural growth was the main contributing factor to population growth. [81] Quebec city 2,100, Trois-Rivières 455, Montreal 655. (Comprising 528 families with 2,034 men and 1,181 women. Professionals included 3 notaries, 3 schoolmasters, 3 locksmiths, 4 bailiffs, 5 surgeons, 5 bakers, 8 barrel makers, 9 millers, 18 official merchants, 27 joiners, and 36 carpenters.) [56] |
1677 | Indigenous Nations | 10,750 | Estimated Indigenous population in and around New France territory 10,750, including 2,150 warriors. (Mohawks 5 villages, 96 lodges, 300 warriors – Oneidas 1 village, 100 lodges, 200 warriors – Onondagas 2 villages, 164 lodges, 350 warriors – Cayugas 3 villages, 100 lodges, 300 warriors – Senecas 4 villages, 324 lodges, 1,000 warriors). [19] |
1679 | Acadia | 515 | Majority are from the Poitou region of France. |
1681 | New France | 9,677 | New France sees new settlements develop as residents leave Quebec City (population 1,345) and Trois-Rivières (150) with Montreal gaining influence (population 1,418). [56] |
1687 | Newfoundland | 663 | French population only. |
1695 | New France | 13,639 | Population of Saint John River New Brunswick 49. |
1698 | New France | 15,355 | English population of Newfoundland at the time 1,500. |
Year | Area/colony | Population [73] [86] | Notes [56] |
---|---|---|---|
1705 | Newfoundland | 520 | French population only |
1706 | New France | 16,417 | Covering territory that is now situated partly in the United States of America and partly in Canada. |
1712 | New France | 18,440 | Married – men 2,786, women 2,588. Unmarried – males 6,716, females 6,350. [56] |
1718 | New France | 22,983 | Married – men 3,662, women 3,926. Unmarried – males 7,911, females 7,484. [56] |
1720 | St.John Island (Prince Edward Island) | 100 | 17 families |
1730 | New France | 33,682 | Married – men 6,050, women 5,728. Unmarried – males 11,314, females 10,590. [56] |
1736 | Indigenous Nations | 17,575 | Estimated population of First Nations in New France that are now within Canada – Abenakis 2,950 – Algonquins, Ottawas, Potawatomi, Saulteaux and Crees 11,475 – Wyandot-Huron 1,300 – Iroquois 1,850. [19] |
1737 | New France | 39,970 | Married – men 7,378, women 6,804. Unmarried – males 13,330, females 12,458. [56] |
1741 | Newfoundland | 6,000 | English population only. |
1749 | Nova Scotia | 2,544 | Married – men, 509; women 509. Unmarried – men, 660; women, 3. Children-boys, 228; girls, 216. Servants-men, 277; women, 142. [56] |
1749 | Île-Royale (Cape Breton) | 1,000 | French population only. |
1749 | Acadian Mainland (New Brunswick) | 1,000 | French population only. |
1749 | Acadian Peninsula | 13,000 | French population only. |
1749 | St. John Island (Prince Edward Island) | 1,000 | French population only. |
1752 | Acadia (non-French) | 4,203 | British and German population only. Men over sixteen years old, 574; women over sixteen years old, 607. Children boys, 1,899; children girls, 1,123. |
1760 | New France | 70,000 | Expulsion of the Acadians three-quarters of the Acadian population of 18,000 forcibly relocated between 1755 and 1764. [87] |
1765 | Province of Quebec (1763–91) | 69,810 | French and English populations. |
1775 | Province of Quebec (1763–91) | 90,000 | French and English populations. |
1785 | Newfoundland | 10,244 | French and English populations. |
1790 | Nova Scotia | 30,000 | French and English populations. |
1797 | St. John Island (Prince Edward Island) | 4,500 | French and English populations. |
Year | Area/Province | Population [88] |
---|---|---|
1806 | New Brunswick | 35,000 |
1806 | Prince Edward Island | 9,676 |
1806 | Upper Canada | 70,718 |
1806 | Lower Canada | 250,000 |
1806 | Newfoundland | 26,505 |
1807 | Nova Scotia | 65,000 |
1822 | Prince Edward Island | 24,600 |
1823 | Newfoundland | 52,157 |
1824 | Upper Canada | 150,066 |
1824 | New Brunswick | 74,176 |
1825 | Upper Canada | 157,923 |
1825 | Lower Canada | 479,288 |
1831 | Lower Canada | 553,134 |
1832 | Upper Canada | 263,554 |
1832 | Newfoundland | 59,280 |
1833 | Prince Edward Island | 32,292 |
1844 | Canada East | 697,084 |
1845 | Newfoundland | 96,295 |
1846 | Assiniboia (North-West Territories) | 4,871 |
1848 | Canada West | 725,879 |
1861 | Colony of Vancouver Island | 3,024 |
1869 | Newfoundland | 146,536 |
1871 | British Columbia | 36,247 |
1871 | Manitoba | 25,228 |
1871 | Ontario | 1,620,851 |
1871 | Quebec | 1,191,516 |
1871 | New Brunswick | 285,594 |
1871 | Nova Scotia | 387,800 |
1871 | Prince Edward Island | 94,021 |
1871 | Northwest Territories | 48,000 |
Year | Canada as a whole | Population | Provinces/Area [19] [18] [20] |
---|---|---|---|
1822 | Indigenous population | 283,500 | British North America 283,500 |
1871 | Indigenous population | 102,358 | Prince Edward Island 323 – Nova Scotia 1,666 – New Brunswick 1,403 – Quebec 6,988 – Ontario 12,978 – British Columbia 23,000 – Rupert's Land 33,500 – Manitoba 500 and Labrador and the Arctic Watersheds 22,000 |
1885 | Indigenous population | 131,952 | Prince Edward Island 292 - Nova Scotia 2,197 - New Brunswick 1,524 - Quebec 12,023 - Ontario 16,892 - British Columbia 39,011 - Eastern Rupert's Land 4,016 - Manitoba and Northwest Territories 33,959 - Peace River district 2,038 - Athabaska district 8,000 - McKenzie district 7,000 - Labrador (Canadian interior) 1,000 - Arctic coast 4,000 |
|
|
|
Year | Pop. | ±% |
---|---|---|
1822 | 283,500 | — |
1871 | 102,358 | −63.9% |
1881 | 108,547 | +6.0% |
1885 | 131,952 | +21.6% |
1901 | 147,941 | +12.1% |
1911 | 105,611 | −28.6% |
1921 | 114,083 | +8.0% |
1931 | 128,899 | +13.0% |
1941 | 160,937 | +24.9% |
1951 | 165,607 | +2.9% |
1961 | 220,121 | +32.9% |
1971 | 312,765 | +42.1% |
1981 | 491,460 | +57.1% |
1986 | 711,725 | +44.8% |
1991 | 1,016,340 | +42.8% |
1996 | 799,010 | −21.4% |
2001 | 976,305 | +22.2% |
2006 | 1,172,790 | +20.1% |
2011 | 1,400,690 | +19.4% |
2016 | 1,673,785 | +19.5% |
2021 | 1,807,250 | +8.0% |
Source: Statistics Canada [19] [91] [92] : 5&6 [93] : 3 [94] : 1 [95] : 17 [96] [97] [98] [99] [100] [101] [18] [20] Note: Population decline between 1991 and 1996 censuses attributed to change in criteria in census count; "the 1996 Royal Commission on Aboriginal Peoples used a more restrictive definition of Aboriginal". [102] |
Year | Pop. | ±% |
---|---|---|
1871 | 3,689,257 | — |
1881 | 4,324,810 | +17.2% |
1891 | 4,833,239 | +11.8% |
1901 | 5,371,315 | +11.1% |
1911 | 7,206,643 | +34.2% |
1921 | 8,787,949 | +21.9% |
1931 | 10,374,196 | +18.1% |
1941 | 11,506,655 | +10.9% |
1951 | 14,009,429 | +21.8% |
1961 | 18,238,247 | +30.2% |
1971 | 21,568,311 | +18.3% |
1976 | 22,992,604 | +6.6% |
1981 | 24,343,181 | +5.9% |
1986 | 25,309,331 | +4.0% |
1991 | 27,296,859 | +7.9% |
1996 | 28,846,761 | +5.7% |
2001 | 30,007,094 | +4.0% |
2006 | 31,612,897 | +5.4% |
2011 | 33,476,688 | +5.9% |
2016 | 35,151,728 | +5.0% |
2021 | 36,991,981 | +5.2% |
[103] [104] [105] [106] [107] [108] [109] [110] [111] |
In 2006, Statistics Canada projected for the decade 2021 to 2031 the population to grow by more than 5 million, or more than 10%. [112] Between 1990 and 2008, the population increased by 5.6 million, equivalent to 20.4 per cent overall growth. [9] The 2016 Canadian census counted a total population of 35.1 million, [7] or 1.5 million under the 2006 projection.
In October 2020, the Trudeau government announced its plans to bring in more than 1.2 million immigrants over the subsequent three years, to catch up to the high-growth scenario. [113]
Year | Pop. | ±% |
---|---|---|
2011 | 33,470,000 | — |
2016 | 36,540,000 | +9.2% |
2021 | 39,110,000 | +7.0% |
2026 | 41,750,000 | +6.8% |
2031 | 44,430,000 | +6.4% |
2036 | 47,130,000 | +6.1% |
2041 | 49,900,000 | +5.9% |
2046 | 52,910,000 | +6.0% |
2051 | 56,070,000 | +6.0% |
2056 | 59,400,000 | +5.9% |
2061 | 63,000,000 | +6.1% |
Statistics Canada conducts a country-wide census that collects demographic data every five years on the first and sixth year of each decade. The 2021 Canadian census enumerated a total population of 36,991,981, an increase of around 5.2 percent over the 2016 figure. It is estimated that Canada's population surpassed 40 million in 2023 and 41 million in 2024. Between 1990 and 2008, the population increased by 5.6 million, equivalent to 20.4 percent overall growth. The main driver of population growth is immigration, with 6.2% of the country's population being made up of temporary residents as of 2023, or about 2.5 million people. Between 2011 and May 2016, Canada's population grew by 1.7 million people, with immigrants accounting for two-thirds of the increase.
According to the 2021 Canadian census, over 450 "ethnic or cultural origins" were self-reported by Canadians. The country's ten largest self-reported specific ethnic or cultural origins in 2021 were Canadian, followed by English (14.7 percent), Irish (12.1 percent), Scottish (12.1 percent), French (11.0 percent), German (8.1 percent), Chinese (4.7 percent), Italian (4.3 percent), Indian (3.7 percent), and Ukrainian (3.5 percent).
The Demographics of Montreal concern population growth and structure for Montreal, Quebec, Canada. The information is analyzed by Statistics Canada and compiled every five years, with the most recent census having taken place in 2021.
The demographics of Metro Vancouver indicate a multicultural and multiracial region. Metro Vancouver is a metropolitan area, with its major urban centre being Vancouver, British Columbia, Canada. The Vancouver census metropolitan area, as defined by Statistics Canada, encompasses roughly the same territory as the Metro Vancouver Regional District, a regional district in British Columbia. The regional district includes 23 local authorities. Figures provided here are for the Vancouver census metropolitan area and not for the City of Vancouver.
Statistics Canada conducts a national census of population and census of agriculture every five years and releases the data with a two-year lag.
British Columbia is a Canadian province with a population of about 5.7 million people. The province represents about 13.2% of the population of the Canadian population. Most of the population is between the ages of 15 and 49. About 60 percent of British Columbians have European descent with significant Asian and Aboriginal minorities. Just under 30% of British Columbians are immigrants. Over half of the population is irreligious, with Christianity and Sikhism being the most followed religions.
Ontario, one of the 13 provinces and territories of Canada, is located in east-central Canada. It is Canada's most populous province by a large margin, accounting for nearly 40 percent of all Canadians, and is the second-largest province in total area. Ontario is fourth-largest in total area when the territories of the Northwest Territories and Nunavut are included. It is home to the nation's capital city, Ottawa, and the nation's most populous city, Toronto.
Alberta has experienced a relatively high rate of growth in recent years, due in large part to its economy. Between 2003 and 2004, the province saw high birthrates, relatively high immigration, and a high rate of interprovincial migration when compared to other provinces. Approximately 81% of the population live in urban areas and only about 19% live in rural areas. The Calgary–Edmonton Corridor is the most urbanized area in Alberta and is one of Canada's four most urban regions. Many of Alberta's cities and towns have also experienced high rates of growth in recent history. From a population of 73,022 in 1901, Alberta has grown to 4,262,635 in 2021 and in the process has gone from less than 1.5% of Canada's population to 11.5%. It is the fourth most populated province in Canada. Between the 2016 and 2021 censuses, the Alberta population grew by 4.8%.
Prince Edward Island is a Canadian province. According to the 2011 National Household Survey, the largest ethnic group consists of people of Scottish descent (39.2%), followed by English (31.1%), Irish (30.4%), French (21.1%), German (5.2%), and Dutch (3.1%) descent. Prince Edward Island is mostly a white community and there are few visible minorities. Chinese people are the largest visible minority group of Prince Edward Island, comprising 1.3% of the province's population. Almost half of respondents identified their ethnicity as "Canadian." Prince Edward Island is by a strong margin the most Celtic and specifically the most Scottish province in Canada and perhaps the most Scottish place (ethnically) in the world, outside Scotland. 38% of islanders claim Scottish ancestry, but this is an underestimate and it is thought that almost 50% of islanders have Scottish roots. When combined with Irish and Welsh, almost 80% of islanders are of some Celtic stock, albeit most families have resided in PEI for at least two centuries. Few places outside Europe can claim such a homogeneous Celtic ethnic background. The only other jurisdiction in North America with such a high percentage of British Isles heritage is Newfoundland.
Saskatchewan is the middle province of Canada's three Prairie provinces. It has an area of 651,900 km2 (251,700 mi2) and a population of 1,132,505 (Saskatchewanians) as of 2021. Saskatchewan's population is made of 50.3% women and 49.7% men. Most of its population lives in the Southern half of the province.
Newfoundland and Labrador is a province of Canada on the country's Atlantic coast in northeastern North America. The province has an area of 405,212 square kilometres and a population in 2024 of 545,880, with approximately 95% of the provincial population residing on the Island of Newfoundland, with more than half of the population residing on the Avalon Peninsula. People from Newfoundland and Labrador are called "Newfoundlanders," "Labradorians", or "Newfoundlanders and Labradorians".
Nova Scotia is a Canadian province located on the country's southeastern coast. It is the most populous province in Atlantic Canada, and its capital, Halifax, is a major economic centre of the region. Geographically, Nova Scotia is the second smallest province in Canada, with an area of 52,824.71 km2 (20,395.73 sq mi). As of 2021, it has a population of 969,383 people.
New Brunswick is one of Canada's three Maritime provinces and the only bilingual province in the country. The provincial Department of Finance estimates that the province's population in 2006 was 729,997 of which the majority is English-speaking but with a substantial French-speaking minority of mostly Acadian origin.
The Northwest Territories is a territory of Canada. It has an area of 1,171,918 square kilometres and a population of 41,786 as of the 2016 Canadian census.
Yukon is the westernmost of Canada's three northern territories. Its capital is Whitehorse. People from Yukon are known as Yukoners. Unlike in other Canadian provinces and territories, Statistics Canada uses the entire territory as a single at-large census division.
Nunavut is a territory of Canada. It has a land area of 1,877,787.62 km2 (725,017.85 sq mi). It has a population of 36,858 in the 2021 Census. In the 2016 census the population was 35,944, up 12.7% from the 2011 census figure of 31,906. In 2016, 30,135 people identified themselves as Inuit, 190 as North American Indian (0.5%), 165 Métis (0.5%) and 5,025 as non-aboriginal (14.0%).
According to the 2021 census, the City of Edmonton had a population of 1,010,899 residents, compared to 4,262,635 for all of Alberta, Canada. The total population of the Edmonton census metropolitan area (CMA) was 1,418,118, making it the sixth-largest CMA in Canada.
In the 2021 Census, the City of Calgary had a population of 1,306,784 residents, representing 30.7% of the 4,262,635 residents in all of Alberta, and 3.5% compared to a population of 36,991,981 in all of Canada. The total population of the Calgary census metropolitan area (CMA) was 1,481,806. Calgary is the largest city in Alberta, and the third-largest municipality and fifth-largest metropolitan area in Canada, as of 2021.
The demographics of Winnipeg reveal the city to be a typically Canadian one: multicultural and multilingual. Winnipeg is also prominent in the size and ratio of its First Nations population, which plays an important part in the city's makeup. About 12.4% of Winnipeggers are of Indigenous descent, which exceeds the national average of 5.0%.
Since confederation in 1867 through to the contemporary era, decadal and demi-decadal census reports in Canada have compiled detailed immigration statistics. During this period, the highest annual immigration rate in Canada occurred in 1913, when 400,900 new immigrants accounted for 5.3 percent of the total population, while the greatest number of immigrants admitted to Canada in single year occurred in 2023, with 471,550 persons accounting for 1.2 percent of the total population.