
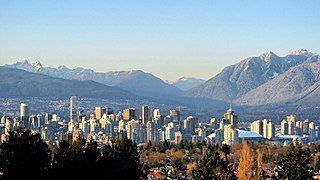
Burnaby is a city in the Lower Mainland region of British Columbia, Canada. Located in the centre of the Burrard Peninsula, it neighbours the City of Vancouver to the west, the District of North Vancouver across the confluence of the Burrard Inlet with its Indian Arm to the north, Port Moody and Coquitlam to the east, New Westminster and Surrey across the Fraser River to the southeast, and Richmond on the Lulu Island to the southwest.

The census geographic units of Canada are the census subdivisions defined and used by Canada's federal government statistics bureau Statistics Canada to conduct the country's quinquennial census. These areas exist solely for the purposes of statistical analysis and presentation; they have no government of their own. They exist on four levels: the top-level (first-level) divisions are Canada's provinces and territories; these are divided into second-level census divisions, which in turn are divided into third-level census subdivisions and fourth-level dissemination areas.
Greater Vancouver, also known as Metro Vancouver, is the metropolitan area with its major urban centre being the city of Vancouver, British Columbia, Canada. The term "Greater Vancouver" describes an area that is roughly coterminous with the region governed by the Metro Vancouver Regional District (MVRD), though it predates the 1966 creation of the regional district. It is often used to include areas beyond the boundaries of the regional district but does not generally include wilderness and agricultural areas that are included within the MVRD.
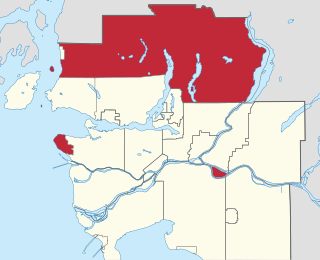
Metro Vancouver Electoral Area A is a part of Metro Vancouver in British Columbia. It includes several unincorporated areas: the University Endowment Lands and the University of British Columbia, west of the City of Vancouver; Bowyer, Passage, and Barnston Islands; the west side of Pitt Lake; the northern portion of Indian Arm; and a large area to the north of the North Shore that is mostly mountainous and sparsely populated except for certain subdivisions between Horseshoe Bay and the Village of Lions Bay.
The demographics of Metro Vancouver indicate a multicultural and multiracial region. Metro Vancouver is a metropolitan area, with its major urban centre being Vancouver, British Columbia, Canada. The Vancouver census metropolitan area, as defined by Statistics Canada, encompasses roughly the same territory as the Metro Vancouver Regional District, a regional district in British Columbia. The regional district includes 23 local authorities. Figures provided here are for the Vancouver census metropolitan area and not for the City of Vancouver.
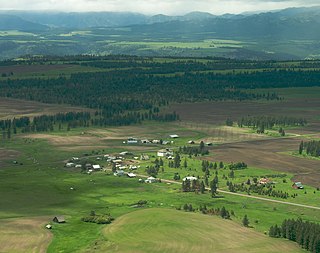
In geography, statistics and archaeology, a settlement, locality or populated place is a community of people living in a particular place. The complexity of a settlement can range from a minuscule number of dwellings grouped together to the largest of cities with surrounding urbanized areas. Settlements include hamlets, villages, towns and cities. A settlement may have known historical properties such as the date or era in which it was first settled, or first settled by particular people. The process of settlement involves human migration.
