A population centre, in Canadian census data, is a populated place, or a cluster of interrelated populated places, which meets the demographic characteristics of an urban area, having a population of at least 1,000 people and a population density of no fewer than 400 persons per square km2. [1]
The term was first introduced in the Canada 2011 Census; prior to that, Statistics Canada used the term urban area. [1]
In the 2021 Census of Population, Statistics Canada listed 54 population centres in the province of Manitoba. [2]
The below table is a list of those population centres in Manitoba from the 2021 Census of Population as designated, named, and delineated by Statistics Canada. [2]
Rank | Population centre [2] | Size group [2] | Population (2021) [2] | Population (2016) [2] | Change [2] | Land area (km2) [2] | Population density [2] |
---|---|---|---|---|---|---|---|
1 | Winnipeg | Large urban | 758,515 | 712,858 | +6.4% | 356.99 | 2,124.8/km2 |
2 | Brandon | Medium | 50,532 | 48,345 | +4.5% | 28.73 | 1,758.9/km2 |
3 | Steinbach | Small | 17,589 | 15,790 | +11.4% | 17.8 | 988.1/km2 |
4 | Winkler | Small | 15,335 | 14,311 | +7.2% | 19.02 | 806.3/km2 |
5 | Portage la Prairie | Small | 12,944 | 13,013 | −0.5% | 9.93 | 1,303.5/km2 |
6 | Thompson | Small | 12,329 | 13,037 | −5.4% | 7.81 | 1,578.6/km2 |
7 | Selkirk | Small | 9,761 | 9,604 | +1.6% | 5.93 | 1,646.0/km2 |
8 | Morden | Small | 9,103 | 8,058 | +13.0% | 8.53 | 1,067.2/km2 |
9 | Dauphin | Small | 8,034 | 8,233 | −2.4% | 7.95 | 1,010.6/km2 |
10 | The Pas | Small | 7,302 | 6,402 | +14.1% | 8.4 | 869.3/km2 |
11 | Niverville | Small | 5,593 | 4,363 | +28.2% | 4.23 | 1,322.2/km2 |
12 | Stonewall | Small | 5,046 | 4,809 | +4.9% | 5.96 | 846.6/km2 |
13 | Oakbank | Small | 5,041 | 4,604 | +9.5% | 5.39 | 935.3/km2 |
14 | Neepawa | Small | 4,938 | 3,939 | +25.4% | 2.36 | 2,092.4/km2 |
15 | Flin Flon | Small | 4,722 | 4,810 | −1.8% | 3.74 | 1,262.6/km2 |
16 | Altona | Small | 4,227 | 4,177 | +1.2% | 4.8 | 880.6/km2 |
17 | Swan River | Small | 3,989 | 3,969 | +0.5% | 5.73 | 696.2/km2 |
18 | Lorette | Small | 3,230 | 2,904 | +11.2% | 3.15 | 1,025.4/km2 |
19 | Mitchell | Small | 3,136 | 2,523 | +24.3% | 4.08 | 768.6/km2 |
20 | Beausejour | Small | 3,123 | 3,003 | +4.0% | 3.11 | 1,004.2/km2 |
21 | Carman | Small | 2,970 | 3,022 | −1.7% | 2.85 | 1,042.1/km2 |
22 | Virden | Small | 2,904 | 3,082 | −5.8% | 2.33 | 1,246.4/km2 |
23 | Ste. Anne | Small | 2,891 | 2,114 | +36.8% | 4.14 | 698.3/km2 |
24 | Killarney | Small | 2,499 | 2,315 | +7.9% | 3.45 | 724.3/km2 |
25 | La Salle | Small | 2,471 | 1,874 | +31.9% | 3 | 823.7/km2 |
26 | Minnedosa | Small | 2,407 | 2,224 | +8.2% | 2.23 | 1,079.4/km2 |
27 | Gimli | Small | 2,345 | 2,251 | +4.2% | 3.02 | 776.5/km2 |
28 | Stony Mountain | Small | 2,160 | 1,800 | +20.0% | 1.99 | 1,085.4/km2 |
29 | Souris | Small | 1,935 | 1,900 | +1.8% | 2.5 | 774.0/km2 |
30 | Cross Lake 19A | Small | 1,826 | 2,041 | −10.5% | 3.3 | 553.3/km2 |
31 | Carberry | Small | 1,823 | 1,748 | +4.3% | 2.4 | 759.6/km2 |
32 | Morris | Small | 1,801 | 1,714 | +5.1% | 2.26 | 796.9/km2 |
33 | Grunthal | Small | 1,782 | 1,680 | +6.1% | 2.7 | 660.0/km2 |
34 | Blumenort | Small | 1,738 | 1,675 | +3.8% | 3.17 | 548.3/km2 |
35 | Wasagamack | Small | 1,689 | 579 | +191.7% | 3.66 | 461.5/km2 |
36 | Russell | Small | 1,622 | 1,498 | +8.3% | 1.9 | 853.7/km2 |
37 | Roblin | Small | 1,603 | 1,614 | −0.7% | 2.71 | 591.5/km2 |
38 | St. Adolphe | Small | 1,595 | 1,367 | +16.7% | 1.74 | 916.7/km2 |
39 | Ile des Chênes | Small | 1,572 | 1,528 | +2.9% | 1.83 | 859.0/km2 |
40 | Boissevain | Small | 1,567 | 1,656 | −5.4% | 2.54 | 616.9/km2 |
41 | Pinawa | Small | 1,512 | 1,441 | +4.9% | 2.14 | 706.5/km2 |
42 | Oak Bluff | Small | 1,442 | 1,051 | +37.2% | 2.52 | 572.2/km2 |
43 | Cross Lake 19 | Small | 1,387 | 1,252 | +10.8% | 3.05 | 454.8/km2 |
44 | Shilo CFB-BFC | Small | 1,362 | 1,419 | −4.0% | 1.25 | 1,089.6/km2 |
45 | Nelson House 170 | Small | 1,351 | 1,675 | −19.3% | 2.7 | 500.4/km2 |
46 | La Broquerie | Small | 1,332 | 1,034 | +28.8% | 2.98 | 447.0/km2 |
47 | St-Pierre-Jolys | Small | 1,305 | 1,170 | +11.5% | 2.61 | 500.0/km2 |
48 | Landmark | Small | 1,284 | 1,237 | +3.8% | 2.22 | 578.4/km2 |
49 | Arborg | Small | 1,279 | 1,222 | +4.7% | 2 | 639.5/km2 |
50 | Chemawawin 2 | Small | 1,163 | 1,131 | +2.8% | 1.51 | 770.2/km2 |
51 | Teulon | Small | 1,087 | 1,095 | −0.7% | 1.87 | 581.3/km2 |
52 | St. Theresa Point | Small | 1,083 | 1,038 | +4.3% | 1.53 | 707.8/km2 |
53 | Lac du Bonnet | Small | 1,064 | 1,089 | −2.3% | 2.26 | 470.8/km2 |
54 | St. Andrews | Small | 1,001 | 1,026 | −2.4% | 2.33 | 429.6/km2 |
The census geographic units of Canada are the census subdivisions defined and used by Canada's federal government statistics bureau Statistics Canada to conduct the country's quinquennial census. These areas exist solely for the purposes of statistical analysis and presentation; they have no government of their own. They exist on four levels: the top-level (first-level) divisions are Canada's provinces and territories; these are divided into second-level census divisions, which in turn are divided into third-level census subdivisions and fourth-level dissemination areas.
The Rural Municipality of Hanover is a rural municipality (RM) in southeastern Manitoba, Canada, located southeast of Winnipeg in Division No. 2.
In geography, statistics and archaeology, a settlement, locality or populated place is a community in which people live. The complexity of a settlement can range from a small number of dwellings grouped together to the largest of cities with surrounding urbanized areas. Settlements may include hamlets, villages, towns and cities. A settlement may have known historical properties such as the date or era in which it was first settled, or first settled by particular people.
La Broquerie is a rural municipality in the province of Manitoba in Western Canada, located in the southeastern part of the province, just south and east of the city of Steinbach.
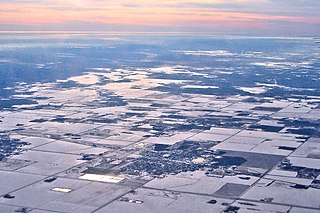
The Rural Municipality of Brokenhead is a rural municipality (RM) in the Canadian province of Manitoba.