Canada, the world's second-largest country in total area, is dedicated to having efficient, high-capacity multimodal transportation spanning often vast distances between natural resource extraction sites, agricultural and urban areas. Canada's transportation system includes more than 1,400,000 kilometres (870,000mi) of roads, 10 major international airports, 300 smaller airports, 72,093km (44,797mi) of functioning railway track, and more than 300 commercial ports and harbours that provide access to the Pacific, Atlantic and Arctic oceans as well as the Great Lakes and the St. Lawrence Seaway.[1] In 2005, the transportation sector made up 4.2% of Canada's GDP, compared to 3.7% for Canada's mining and oil and gas extraction industries.[2]
Transport Canada oversees and regulates most aspects of transportation within federal jurisdiction, including interprovincial transport. This primarily includes rail, air and maritime transportation. Transport Canada is under the direction of the federal government's Minister of Transport. The Transportation Safety Board of Canada is responsible for maintaining transportation safety in Canada by investigating accidents and making safety recommendations.
Gross domestic product, transport industries, 2005[2]
Industry
Share of transportation GDP (%)
Air transportation
9
Rail transportation
13
Water transportation
3
Truck transportation
35
Transit and ground passenger transportation
12
Pipeline transportation
11
Scenic and sightseeing transport / Transport support
17
Total:
100
History
The standard history covers the French regime, fur traders, the canals, and early roads, and gives extensive attention to the railways.[3]
Europeans adopted canoes as they pushed deeper into the continent's interior, and were thus able to travel via the waterways that fed from the St. Lawrence River and Hudson Bay.[4]
In the 19th century and early 20th century transportation relied on harnessing oxen to Red River ox carts or horse to wagon. Maritime transportation was via manual labour such as canoe or wind on sail. Water or land travel speeds was approximately 8 to 15km/h (5 to 9mph).[5]
Settlement was along river routes. Agricultural commodities were perishable, and trade centres were within 50km (31mi). Rural areas centred around villages, and they were approximately 10km (6mi) apart. The advent of steam railways and steamships connected resources and markets of vast distances in the late 19th century.[5] Railways also connected city centres, in such a way that the traveller went by sleeper, railway hotel, to the cities. Crossing the country by train took four or five days, as it still does by car. People generally lived within 5mi (8km) of the downtown core thus the train could be used for inter-city travel and the tram for commuting.
Different parts of the country are shut off from each other by Cabot Strait, the Strait of Belle Isle, by areas of rough, rocky forest terrain, such as the region lying between New Brunswick and Quebec, the areas north of Lakes Huron and Superior, dividing the industrial region of Ontario and Quebec from the agricultural areas of the prairies, and the barriers interposed by the mountains of British Columbia
The Federal Department of Transport (established November 2, 1936) supervised railways, canals, harbours, marine and shipping, civil aviation, radio and meteorology. The Transportation Act of 1938 and the amended Railway Act, placed control and regulation of carriers in the hands of the Board of Transport commissioners for Canada. The Royal Commission on Transportation was formed December 29, 1948, to examine transportation services to all areas of Canada to eliminate economic or geographic disadvantages. The commission also reviewed the Railway Act to provide uniform yet competitive freight-rates.[6]
There is a total of 1,042,300km (647,700mi) of roads in Canada, of which 415,600km (258,200mi) are paved, including 17,000km (11,000mi) of expressways (the third-longest collection in the world, behind the Interstate Highway System of the United States and China's National Trunk Highway System). As of 2008, 626,700km (389,400mi) were unpaved.[7] There are no regulations at a federal level that regulate Canada's road infrastructure, highway system, or traffic safety laws; it is left to the individual provinces and territories to regulate these elements. Regulations on a provincial level include Ontario's Highway Traffic Act,[8]Alberta's Traffic Safety Act,[9] and British Columbia's Motor Vehicle Act,[10] for example. The only regulation at a federal level that relates to motor vehicles is the Motor Vehicle Safety Act, which deals with the manufacturing and importing of motor vehicles and motor vehicle equipment within the country.[11]
In 2009, there were 20,706,616 road vehicles registered in Canada, of which 96% were vehicles under 4.5 tonnes (4.4 long tons; 5.0 short tons), 2.4% were vehicles between 4.5 and 15 tonnes (4.4 and 14.8 long tons; 5.0 and 16.5 short tons) and 1.6% were 15 tonnes (15 long tons; 17 short tons) or greater. These vehicles travelled a total of 333.29billion kilometres, of which 303.6billion was for vehicles under 4.5 tonnes, 8.3billion was for vehicles between 4.5 and 15 tonnes and 21.4billion was for vehicles over 15 tonnes. For the 4.5- to 15-tonne trucks, 88.9% of vehicle-kilometres were intra-province trips, 4.9% were inter-province, 2.8% were between Canada and the US and 3.4% made outside of Canada. For the trucks over 15 tonnes, 59.1% of vehicle-kilometres were intra-province trips, 20% inter-province trips, 13.8% Canada-US trips and 7.1% trips made outside of Canada.[12]
Canada's vehicles consumed a total of 31.4million cubic metres (198Mbbl) of gasoline and 9.91million cubic metres (62.3Mbbl) of diesel.[12] Trucking generated 35% of the total GDP from transport, compared to 25% for rail, water and air combined (the remainder being generated by the industry's transit, pipeline, scenic and support activities).[2] Hence roads are the dominant means of passenger and freight transport in Canada.
Roads and highways were managed by provincial and municipal authorities until construction of the Northwest Highway System (the Alaska Highway) and the Trans-Canada Highway project initiation. The Alaska Highway of 1942 was constructed during World War II for military purposes connecting Fort St. John, British Columbia, with Fairbanks, Alaska.[6] The transcontinental highway, a joint national and provincial expenditure, was begun in 1949 under the initiation of the Trans Canada Highway Act on December 10, 1949. The 7,821-kilometre (4,860mi) highway was completed in 1962 at a total expenditure of $1.4billion.[13]
Internationally, Canada has road links with both the lower 48 US states and Alaska. The Ministry of Transportation maintains the road network in Ontario and also employs Ministry of Transport Enforcement Officers for the purpose of administering the Canada Transportation Act and related regulations.[14][15] The Department of Transportation in New Brunswick performs a similar task in that province as well.
The safety of Canada's roads is moderately good by international standards, and is improving both in terms of accidents per head of population and per billion vehicle kilometers.[16]
Air transportation made up 9% of the transport sector's GDP generation in 2005. Canada's largest air carrier and its flag carrier is Air Canada, which had 34million customers in 2006 and, as of June 2025, operates 322 aircraft (including Air Canada Jazz).[17]CHC Helicopter, the largest commercial helicopter operator in the world, is second with 109 aircraft[17] and WestJet, a low-cost carrier formed in 1996, is third with 155 aircraft.[17] Canada's airline industry saw significant change following the signing of the US-Canada open skies agreement in 1995, when the marketplace became less regulated and more competitive.[18]
According to a 2016 report, Canada's air transportation was the most expensive for consumers globally;[19] however, this was prior to the emergence of ultra-low-cost carriers such as Flair Airlines[20] who operate 20 aircraft as of June 2025.
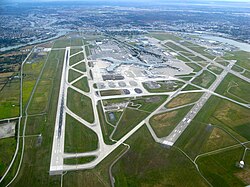
Of over 1,800 registered Canadian aerodromes, certified airports, heliports, and floatplane bases,[23] 26 are specially designated under Canada's National Airports System[24] (NAS): these include all airports that handle 200,000 or more passengers each year, as well as the principal airport serving each federal, provincial, and territorial capital. However, since the introduction of the policy only one, Iqaluit Airport, has been added and no airports have been removed despite dropping below 200,000 passengers.[25] The Government of Canada, with the exception of the three territorial capitals, retains ownership of these airports and leases them to local authorities. The next tier consists of 64 regional/local airports formerly owned by the federal government, most of which have now been transferred to other owners (most often to municipalities).[24]
In 2007, Canada had a total of 72,212km (44,870mi)[35] of freight and passenger railway, of which 31km (19mi) is electrified.[citation needed] While intercity passenger transportation by rail is now very limited, freight transport by rail remains common. Total revenues of rail services in 2006 was $10.4billion, of which only 2.8% was from passenger services. In a year are usually earned about $11billion, of which 3.2% is from passengers and the rest from freight. The Canadian National Railway and Canadian Pacific Kansas City are Canada's two major freight railway companies, each having operations throughout North America. In 2007, 357billion tonne-kilometres of freight were transported by rail, and 4.33million passengers travelled 1.44billion passenger-kilometres (an almost negligible amount compared to the 491billion passenger-kilometres made in light road vehicles). 34,281 people were employed by the rail industry in the same year.[36]
Nationwide passenger services are provided by the federal crown corporationVia Rail. VIA Rail has faced criticism for frequent delays, and low speeds compared to peer countries and historical train travel times, such as the records set by the TurboTrain during the 1970s.[37]
Canada has railway links with the lower 48 US States but no rail connection with Alaska, although a line has been proposed.[38] There are no other international rail connections.
In 2005, 139.2million tonnes (137.0million long tons; 153.4million short tons) of cargo was loaded and unloaded at Canadian ports.[39] The Port of Vancouver is the busiest port in Canada, moving 68million tonnes (67million long tons; 75million short tons) or 15% of Canada's total in domestic and international shipping in 2003.[40]
Transport Canada oversees most of the regulatory functions related to marine registration,[41] safety of large vessel,[42] and port pilotage duties.[43] Many of Canada's port facilities are in the process of being divested from federal responsibility to other agencies or municipalities.[44]
Inland waterways comprise 3,000km (1,900mi), including the St. Lawrence Seaway. Transport Canada enforces acts and regulations governing water transportation and safety.[45]
The National Harbours Board administered Halifax, Saint John, Chicoutimi, Trois-Rivières, Churchill, and Vancouver until 1983. At one time, over 300 harbours across Canada were supervised by the Department of Transport.[6] A program of divestiture was implemented around the turn of the millennium, and as of 2014, 493 of the 549 sites identified for divestiture in 1995 have been sold or otherwise transferred,[48] as indicated by a DoT list.[49] The government maintains an active divestiture programme,[50] and, after divestiture, Transport Canada oversees only 17 Canada Port Authorities for the 17 largest shipping ports.[51][52]
Canada's merchant marine comprised a total of 173 ships (1,000gross tonnage(GT) or over) 2,129,243GT or 716,340tonnes deadweight (DWT) at the end of 2007.[7]
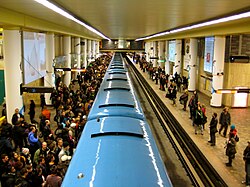
Canadian cities tend to have higher public transit use rates than comparable US cities their size but lower rates than their Mexican counterparts.Montreal Metro's McGill station during rush hour
Most Canadian cities have public transport, if only a bus system. Three Canadian cities have rapid transit systems, four have light rail systems, and three have commuter rail systems (see below). In 2016, 12.4% of Canadians used public transportation to get to work. This compares to 79.5% that got to work using a car (67.4% driving alone, 12.1% as part of a carpool), 5.5% that walked and 1.4% that rode a bike.[53]
Government organizations across Canada owned 17,852 buses of various types in 2016. Organizations in Ontario (38.8%) and Quebec (21.9%) accounted for just over three-fifths of the country's total bus fleet. Urban municipalities owned more than 85% of all buses.[54]
in 2016, diesel buses were the leading bus type in Canada (65.9%), followed by bio-diesel (18.1%) and hybrid (9.4%) buses. Electric, natural gas and other buses collectively accounted for the remaining 6.6%.[55]
The 2016 Canada's Core Public Infrastructure Survey from Statistics Canada found that all of Canada's 247 streetcars were owned by the City of Toronto. The vast majority (87.9%) of these streetcars were purchased from 1970 to 1999, while 12.1% were purchased in 2016. Reflecting the age of the streetcars, 88.0% were reported to be in very poor condition, while 12.0% were reported to be in good condition.[63]
Commuter train systems
Commuter trains serve the cities and surrounding areas of Montreal, Toronto and Vancouver:
1 2 3 4 Howe, C.D. (1956). "The Official Handbook of Present Conditions and Recent Progress". Canada Year Book – Information Services Division – Dominion Bureau of Statistics. Ottawa, Ontario: Kings Printer and Controller of Stationery: 713 to 791.
↑ Coneghan, Daria (2006). "Trans-Canada Highway". The Encyclopedia of Saskatchewan. Canadian Plains Research Center, University of Regina. Retrieved December 29, 2007.
↑ Canadian Transportation Agency. "Enforcement". Canadian Transportation Agency. Archived from the original on September 22, 2007. Retrieved October 1, 2007.
This page is based on this Wikipedia article Text is available under the CC BY-SA 4.0 license; additional terms may apply. Images, videos and audio are available under their respective licenses.