East Moline, Illinois | |
|---|---|
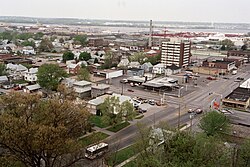 East Moline in 1991 | |
 Flag | |
 Location of East Moline in Rock Island County, Illinois. | |
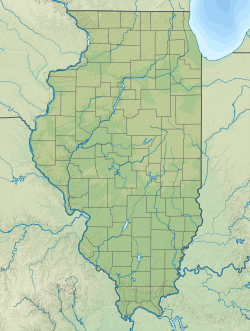 East Moline  East Moline | |
| Coordinates: 41°30′40″N90°23′10″W / 41.51111°N 90.38611°W [1] | |
| Country | United States |
| State | Illinois |
| County | Rock Island County |
| Incorporated | 1903 |
| Area | |
| 14.59 sq mi (37.80 km2) | |
| • Land | 14.59 sq mi (37.80 km2) |
| • Water | 0 sq mi (0.00 km2) |
| Elevation | 577 ft (176 m) |
| Population (2020) | |
| 21,374 | |
| • Density | 1,464.3/sq mi (565.38/km2) |
| • Metro | 381,342 (134th) |
| • CSA | 474,019 (US: 90th) |
| Time zone | UTC-6 (CST) |
| • Summer (DST) | UTC-5 (CDT) |
| ZIP code | 61244 [3] |
| Area codes | 309, 861 |
| FIPS code | 17-22073 |
| GNIS feature ID | 2394602 [1] |
| Interstates | I-74, I-80, I-88, and I-280 |
| Website | www |
East Moline is a city in Rock Island County, Illinois, United States. The population was 21,374 at the 2020 census. [4] East Moline was incorporated in April 1907. [5] It is one of the five Quad Cities at the confluence of the Rock and Mississippi rivers, along with neighboring Moline and Rock Island in Illinois and Davenport and Bettendorf in Iowa.
