
In economics, the Gini coefficient, also known as the Gini index or Gini ratio, is a measure of statistical dispersion intended to represent the income inequality, the wealth inequality, or the consumption inequality within a nation or a social group. It was developed by Italian statistician and sociologist Corrado Gini.

The economy of France is a highly developed social market economy with notable state participation in strategic sectors. It is the world's seventh-largest economy by nominal GDP and the ninth-largest economy by PPP, constituting around 4% of world GDP. Due to a volatile currency exchange rate, France's GDP as measured in dollars fluctuates sharply. France has a diversified economy, that is dominated by the service sector, whilst the industrial sector accounted for 19.5% of its GDP and the primary sector accounted for the remaining 1.7%. In 2020, France was the largest Foreign Direct Investment recipient in Europe, and Europe's second largest spender in research and development. It was ranked among the 10 most innovative countries in the world by the 2020 Bloomberg Innovation Index, as well as the 15th most competitive nation globally according to the 2019 Global Competitiveness Report. It was the fifth-largest trading nation in the world. France is also the most visited destination in the world, as well as the European Union's leading agricultural power.

Wealth is the abundance of valuable financial assets or physical possessions which can be converted into a form that can be used for transactions. This includes the core meaning as held in the originating Old English word weal, which is from an Indo-European word stem. The modern concept of wealth is of significance in all areas of economics, and clearly so for growth economics and development economics, yet the meaning of wealth is context-dependent. A person possessing a substantial net worth is known as wealthy. Net worth is defined as the current value of one's assets less liabilities.
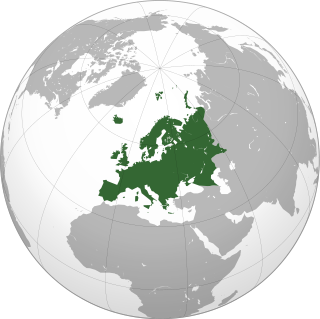
This page compares the sovereign states of Europe on economic, financial and social indicators.
A millionaire is an individual whose net worth or wealth is equal to or exceeds one million units of currency. Depending on the currency, a certain level of prestige is associated with being a millionaire. Many national currencies have, or have had at various times, a low unit value, in many cases due to past inflation. It is obviously much easier and less significant to be a millionaire in those currencies, thus a millionaire in Hong Kong or Taiwan, for example, may be merely averagely wealthy, or perhaps less wealthy than average. A millionaire in Zimbabwe in 2007 could have been extremely poor. Because of this, the term 'millionaire' generally refers to those whose assets total at least one million units of a high-value currency, such as the United States dollar, euro, or pound sterling.

In economics, income distribution covers how a country's total GDP is distributed amongst its population. Economic theory and economic policy have long seen income and its distribution as a central concern. Unequal distribution of income causes economic inequality which is a concern in almost all countries around the world.

The distribution of wealth is a comparison of the wealth of various members or groups in a society. It shows one aspect of economic inequality or economic heterogeneity.
The median income is the income amount that divides a population into two equally-sized groups, half having an income above that amount, and half having an income below that amount. It may differ from the mean income. Both of these are ways of understanding income distribution.
Household income is a measure of the combined incomes of all people sharing a particular household or place of residence. It includes every form of income, e.g., salaries and wages, retirement income, near cash government transfers like food stamps, and investment gains.
Poverty in Switzerland refers to people who are living in relative poverty in Switzerland. In 2018, 7.9% of the population or some 660,000 people in Switzerland were affected by income poverty. Switzerland has also a significant number of working poor, estimated at 145,000 in 2015.

The inequality of wealth has substantially increased in the United States in recent decades. Wealth commonly includes the values of any homes, automobiles, personal valuables, businesses, savings, and investments, as well as any associated debts.

Median household disposable income in the UK was £29,400 in the financial year ending (FYE) 2019, up 1.4% (£400) compared with growth over recent years; median income grew by an average of 0.7% per year between FYE 2017 and FYE 2019, compared with 2.8% between FYE 2013 and FYE 2017.
Income inequality in India refers to the unequal distribution of wealth and income among its citizens. According to the CIA World Factbook, the Gini coefficient of India, which is a measure of income distribution inequality, was 35.2 in 2011, ranking 95th out of 157. Wealth distribution is also uneven, with one report estimating that 54% of the country's wealth is controlled by millionaires, the second highest after Russia, as of November 2016. The richest 1% of Indians own 58% of wealth, while the richest 10% of Indians own 80% of the wealth. This trend has consistently increased, meaning the rich are getting richer much faster than the poor, widening the income gap. Inequality worsened since the establishment of income tax in 1922, overtaking the British Raj's record of the share of the top 1% in national income, which was 20.7% in 1939–40.According to Oxfam India's report of 2023, "Survival of the Richest: India Story," just 5 per cent of Indians own more than 60 per cent of the country’s wealth, while the bottom 50 per cent of the population possess only 3 per cent of the wealth. It also says that between 2012 and 2021, 40% of wealth generated in India has gone to just 1% of the total population and 3% of the wealth has gone to bottom 50%. The number of hungry Indians increased to 350 million in 2022 from 190 million in 2018, while the number of billionaires has increased from 102 in 2020 to 166 in 2022. The covid pandemic reduced the income of the poor, but the wealthy did well. The combined wealth of India's 100 richest is now above $600 billion, which is equivalent to India's Union Budget for 18 months. According to Union Government 's own submission to Supreme Court of India, widespread hunger has caused 65% of deaths of children under the age of 5 in 2022.Saurabh Mukherjee, the founder and CIO of Marcellus Investment Managers, along with his colleague Nandita Rajhansa, has coined the term "Octopus Class" to depict 2 lakh families or around 1 million people in India who control 80% of India's wealth. This class has consolidated financial, social and political power and has continuously pushed its 'tentacles' in every profitable activity they are interested in, aided by liberalisation and consequent growth of globalised economy since 1991.
