Economy of Estonia

Last updated

Economy of Estonia
Tallinna sudalinna panoraam (2021).jpg
Currency Euro (EUR, €)
Calendar year
Trade organisations
EU, WTO and OECD
Country group
Statistics
PopulationIncrease2.svg 1,340,068 (1 January 2021) [3]
GDP
  • $42 billion (nominal, 2023) [4]
  • $62 billion (PPP, 2023) [4]
GDP rank
GDP growth
  • −1.3% (2022) [4]
  • −1.2% (2023) [4]
  • 3.2% (2024) [4]
GDP per capita
  • $32,460 (nominal, 2023) [4]
  • $48,700 (PPP, 2023) [4]
GDP per capita rank
GDP by sector
9.7% (2023) [4]
Population below poverty line
  • Decrease Positive.svg 22.5% – income below €756/month (2022) [6]
  • Decrease Positive.svg 24.3% at risk of poverty or social exclusion (AROPE, 2019) [7]
Decrease Positive.svg 30.5 medium (2019, Eurostat) [8]
Labour force
  • Decrease2.svg 693,759 (2019) [11]
  • Increase2.svg 79.5% employment rate (2018) [12]
Labour force by occupation
Unemployment
  • Decrease Positive.svg 7.8% (July 2020) [13]
  • Increase Negative.svg 23.2% youth unemployment (15 to 24 year-olds; June 2020) [14]
Average gross salary
€2,065, monthly (December, 2023)
€1,598, monthly (December, 2023)
Main industries
engineering, electronics, wood and articles of wood, textiles, information technology, telecommunications
External
ExportsIncrease2.svg €14.4 billion (2018) [15]
Export goods
Electrical equipment, wood and articles of wood, mineral products, agriculture products, mechanical appliances
Main export partners
ImportsIncrease2.svg €16.2 billion (2018) [15]
Import goods
Electrical equipment, transport equipment, agricultural products, mineral products, mechanical appliances
Main import partners
FDI stock
  • Increase2.svg $27.05 billion (31 December 2017 est.) [5]
  • Increase2.svg Abroad: $10.96 billion (31 December 2017 est.) [5]
Increase2.svg $809 million (2017 est.) [5]
Increase Negative.svg $19.05 billion (31 December 2016 est.) [5]
Public finances
  • Steady2.svg 8.4% of GDP (2019) [16]
  • Increase2.svg €2.4 billion (2019) [16]
  • €90 million deficit (2019) [16]
  • −0.3% of GDP (2019) [16]
Revenues38.7% of GDP (2019) [16]
Expenses39.0% of GDP (2019) [16]
Economic aid
Decrease2.svg $345 million (31 December 2017 est.) [5]

All values, unless otherwise stated, are in US dollars.

The economy of Estonia is rated advanced by the World Bank, i.e. with high quality of life and advanced infrastructure relative to less industrialized nations. Estonia is a member of the European Union and eurozone. [20] The economy is heavily influenced by developments in the Finnish and Swedish economies. [21]

Contents

Historically, Estonia's economy was agricultural, moderinising significantly post-independence from Russia in 1918. There was a notable knowledge sector in Tartu and expanding industrial sector, exemplified by the Kreenholm Manufacturing Company. Western European markets were familiar with Estonian dairy, with the main trade partners being Germany and the UK; only 3% of commerce was with the neighbouring USSR. Estonia and Finland had a similar standard of living. [22] USSR's annexation of Estonia in 1940 and destruction during World War II crippled the economy. Post-war Sovietization continued, with the integration of Estonia's economy into the USSR's centrally-planned structure.

After Estonia restored its independence in 1991 and became a market economy, it emerged as a pioneer in the global economy. Estonia styled itself as a bridge between East and West, adopting significant economic reforms and technological innovations. In 1992, the country adopted the Estonian kroon as its currency, this stabilised the economy. In 1994, it became the first country in the world to adopt a flat tax, with a rate of 26% regardless of personal income. Estonia received more foreign investment, per person, in the late 1990s than any other country in Central and Eastern Europe. The country has been catching-up with the EU-15 - the richer European countries. Its GDP per capita grew from 35% of the EU-15 average in 1996 to 65% in 2007, similar to Central European countries. [23] Income per person was $49,000 in 2023 according to the IMF; this was between Poland and Portugal, but below Spain. [24] Because of its economic performance Estonia was termed one of the Baltic Tigers.

For Estonia, the 2007–2008 financial crisis was easier to weather, because its budget has consistently been kept balanced, and this meant public debt relative to GDP remained the lowest in Europe. The economy recovered in 2010. [25] In January 2011, Estonia adopted the euro, and became the first ex-Soviet republic to join the eurozone. [26] Estonia has demonstrated resilience, with a strong service sector, particularly in IT due to the Tiigrihüpe project, and advanced e-government services. Estonia's commitment to a circular economy, innovation and its success in maintaining a balanced budget, low public debt, and a competitive tax system have positioned it as a model of economic reform and growth in post-Soviet Europe.

History

Early history

Until the early 13th century, the territory that is now known as Estonia was independent. The economy was largely an agricultural one, but Estonia being a country with a long coastline, there were also many maritime activities. Autonomous development was brought to an end by the Northern Crusades undertaken by the King of Denmark, the German Livonian and the Teutonic military orders. The Estonian world was transformed by military conquest. The war against the invaders lasted from 1208 to 1227. The last Estonian county to fall was the island of Saaremaa in 1261. [27]

Thereafter, through many centuries until WWI, Estonian agriculture consisted of native peasants working large feudal-type estates held by ethnic German landlords. In the decades prior to independence, centralised Czarist rule had created a rather large industrial sector dominated by the Kreenholm Manufacturing Company, then the world's largest cotton mill.

Independence

After declaring independence in 1918, the Estonian War of Independence and the subsequent signing of the Treaty of Tartu in 1920, the new Estonian state inherited a ruined post-war economy and an inflated ruble currency. Despite considerable hardship, dislocation, and unemployment, Estonia spent the first decade of independence entirely transforming its economy. In 1918, The Czarist ruble was replaced by the Estonian mark, which was in circulation until 1927. By 1929, a stable currency, the kroon, had been established. It was issued by the Bank of Estonia, the country's central bank. Compensating the German landowners for their holdings, the government confiscated the estates and divided them into small farms, which subsequently formed the basis of Estonian prosperity. Trade focused on the local market and the West, particularly Germany and the United Kingdom. Only 3% of all commerce was with the USSR.

Soviet occupation

The USSR's forcible annexation of Estonia in 1940 and the ensuing Nazi and Soviet destruction during World War II crippled the Estonian economy. Post-war Soviet occupation and Sovietisation of life continued with the integration of Estonia's economy and industry into the USSR's centrally planned structure. More than 56% of Estonian farms were collectivised in the month of April 1949 alone after mass deportations to Siberia the previous month. Moscow expanded on those Estonian industries which had locally available raw materials, such as oil shale mining and phosphorites.

Restoration of independence, modernisation and liberalisation
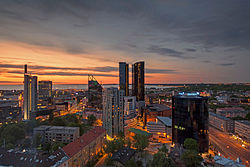
Maakri has become the Central business district of Tallinn in the 21st century Tln1.jpg
Maakri has become the Central business district of Tallinn in the 21st century
Real GDP per capita development of Estonia, Latvia and Lithuania GDP per capita Baltics.svg
Real GDP per capita development of Estonia, Latvia and Lithuania

After Estonia restored its independence in 1991 and became a market economy, it emerged as a pioneer in the global economy. Estonia styled itself as a bridge between East and West, adopting significant economic reforms and technological innovations.

In June 1992, Estonia replaced the ruble with its own freely convertible currency, the kroon. A currency board was created and the new currency was pegged to the German Mark at the rate of 8 Estonian kroons per Deutsche Mark. When Germany introduced the euro the peg was changed to 15.6 kroons per euro.

In 1994, it became the first country in the world to adopt a flat tax, with a rate of 26% regardless of personal income. [28] Between 2005-2008, this was reduced to 21% over several steps. [23]

In early 1992, both liquidity problems and structural weakness stemming from the communist era precipitated a banking crisis. As a result, effective bankruptcy legislation was enacted and privately owned; well-managed banks emerged as market leaders.[ citation needed ]. The fully electronic Tallinn Stock Exchange opened in early 1996, and was purchased by Finland's Helsinki Stock Exchange in 2001. Estonia joined the World Trade Organization in 1999.

From the early 2000s to the latter part of that decade, the economy experienced considerable growth. In 2000, Estonian GDP grew by 6.4%. After accession to the European Union in 2004, double-digit growth was soon observed. GDP grew by 8% in 2007 alone. Increases in labor costs, the imposition of tax on tobacco, alcohol, electricity, fuel, gas, and other external pressures (growing prices of oil and food on the global market) inflated prices in 2009.[ citation needed ]

2008 financial crisis, response and recovery

Real GDP growth in Estonia, 2002-2012. Real GDP growth in Estonia, 2002-2012.png
Real GDP growth in Estonia, 2002–2012.

The financial crisis of 2007–2008 had a deep effect on the economy, primarily as a result of an investment and consumption slump, that followed the burst of the real estate market bubble that had been building up. In December 2008, Estonia became a donor country to the IMF-led rescue package for Latvia. In response to the crisis, the Ansip government opted for fiscal consolidation and retrenchment by maintaining fiscal discipline and a balanced budget in combination with austerity packages: The government increased taxes, and reduced public spending by slashing expenditures and public salaries across the board. [25]

After a long period of very high growth of GDP, the GDP of Estonia decreased. In the first quarter 2008, GDP grew only 0.1%, and then decreased: negative growth was −1.4% in the 2nd quarter, a little over −3% (on a year-to-year basis) in the 3rd quarter, and −9.4% in the 4th quarter of that year. [29]

The government made a supplementary negative budget, which was passed by the Riigikogu. The revenue of the budget was decreased for 2008 by EEK 6.1 billion and the expenditure by EEK 3.2 billion. [30] A current account-deficit was extant, but began to shrink in late 2008. In 2009, the economy further contracted by 15% in the first quarter. [29] Low domestic and foreign demand depressed the economy's overall output. [31] The economy's 34% industrial production drop was the sharpest decrease in industrial production in the European Union. [32] Estonia was one of the five worst-performing economies in the world in terms of annual growth, [33] and had one of the hightest rates of unemployment in the EU, which rose from 4% in May 2008 to 16% in May 2009. [34]

In July 2009, the value-added tax was increased from 18% to 20%. [35] The recorded budget deficit for 2009 was just 1.7% of GDP. [25] The result was, that Estonia was one of only five EU countries in 2009 that met the Maastricht criteria for debt and deficit, and had the third-lowest deficit after Luxembourg and Sweden; Estonia did not ask for support from the IMF. Despite the third-largest drop in GDP, the country had the lowest budget deficit and lowest public debt among Central and Eastern European countries. In 2009, the Estonian economy began to rebound, and economic growth resumed in the second half of 2010. The country's unemployment rate dropped significantly to pre-recession levels. [36] To top it off, Estonia was granted permission in 2010 to join the eurozone in 2011. [25]

Joining the euro

Before joining the eurozone, the Estonian kroon had been pegged to the euro at a rate of 15.64664 EEK to one euro; before then, the kroon was pegged to the German mark at approximately 8 EEK to 1 DEM.

The design of Estonian euro coins was finalized in late 2004. [37] Estonia's journey towards the euro took longer than originally projected, owing to the inflation rate continually being above the required 3% before 2010, [38] which prevented the country from fulfilling the entry criteria. The country originally planned to adopt the euro on 1 January 2007 and officially changed its target date twice: first to 1 January 2008, and later to 1 January 2011. [26]

On 12 May 2010, the European Commission announced that Estonia had met all criteria to join the eurozone. [39] On 8 June 2010, EU finance ministers. [40] In July 2010, Estonia received the final approval from ECOFIN to adopt the euro onwards from 1 January 2011; on that date Estonia became the 17th eurozone member state and circulated alongside the kroon until 14 January 2011. [41] With that, Estonia became one of the first post-Soviet states to join the eurozone. [26]

In August 2011, Standard & Poor's raised Estonia's credit rating from A to AA-. Among various factors, S&P cited as contributing to its decision was confidence in Estonia's ability to "sustain strong economic growth." [42] Estonia's GDP growth rate in 2011 was above 8%, despite having negative population growth. [43] [44]

The Estonian economy was hit by the COVID-19 recession before bouncing back with an 8.6% rise in GDP in 2021, [45] this was followed by the economic effect of the Russian invasion of Ukraine in February 2022 resulting in a fall in GDP of 1.3% in 2022 and high inflation which hit 24% [46] before falling to single digits in 2023.

The economy today

"Since reestablishing independence, Estonia has styled itself as the gateway between East and West and pursued economic reform and integration with the West." [47] Estonia's market reforms put it among the economic leaders in the former COMECON area.[ citation needed ] A balanced budget, almost non-existent public debt, flat-rate income tax, free trade regime, adoption of the euro, competitive commercial banking sector, hospitable environment for foreign investment, innovative e-Services and mobile-based services are hallmarks of Estonia's free-market-based economy.[ citation needed ]

The privatisation of state-owned firms is virtually complete, with only the port and main power plants remaining in government hands.[ citation needed ] The constitution requires a balanced budget, [48] and the protection afforded by Estonia's intellectual property laws is similar to that of the EU. [49] [50] [51] Near-ideal conditions for the banking sector exist. Foreigners are not restricted from buying bank shares or acquiring majority holdings.[ citation needed ]

In 2013, the average monthly gross wage in Estonia was €980 (US$1,330). [52] This figure has grown consistently to €1,600 (US$1,900) as of 2021. [53]

Projections and circular economy

In 2011, according to projections made by CEPII [54] by 2050, Estonia could become the most productive country in the EU, after Luxembourg, and so join the top five most productive nations in the world. [55]

According to the Ministry of Environment, Estonia committed to developing a circular economy strategic document and action plan by 2021. [56] [57] In March 2020, the Estonian Circular Economy Industries Association, specified that Estonia should consider the new European Green Deal and principles of circular economy when making investments to recover the economy after Covid. [58]

Employment participation

Unemployment rate as a percentage of the labor force in Estonia according to Statistics Estonia. Estonia Unemployment Rates.png
Unemployment rate as a percentage of the labor force in Estonia according to Statistics Estonia.

Estonia has around 600,000 employees, yet the country has a shortage of skilled labor, and since skill shortages are experienced everywhere in Europe, the government has increased working visa quota for non-EEA citizens, although it has nevertheless been criticized for being inadequate for addressing the shortages.

The late-2000s recession in the world, the near-concurrent local property bust with changes in Estonian legislation to increase labour market flexibility (making it easier for companies to lay off workers) saw Estonia's unemployment rate shoot up to 18.8% throughout the duration of the crisis, then stabilise to 13.8% by summer 2011, as the economy recovered on the basis of strong exports. Internal consumption, and therefore imports, plummeted; and cuts were made in public finances. [59] Some of the reduction in unemployment has been attributed to some Estonians' emigrating for employment to Finland, the UK, Australia, and elsewhere. [60]

After the recession, the unemployment rate went lower, and throughout 2015 and 2016, the rate stayed near the levels that preceded the economic downturn, staying at just above 6%. [61] In 2020-2023 the unemployment rate moved around between 5.2% and 7.7%. [62]

Sectors

Tallinn has emerged as the country's financial center. According to Invest in Estonia, advantages of Estonian financial sector are unbureaucratic cooperation between companies and authorities, and relative abundance of educated people although young educated Estonians tend to emigrate to western Europe for greater income. The largest banks are Swedbank, SEB Pank, and Nordea. Several IPOs have been made recently on the Tallinn Stock Exchange, a member OMX system.

The Estonian service sector employs over 60% of workforce. Estonia has a strong information technology (IT) sector, partly due to the Tiigrihüpe project undertaken in mid-1990s, and has been mentioned as the most "wired" and advanced country in Europe in the terms of e-government. [63] [64]

Farming, which had been forcibly collectivized for decades until the transition era of 1990–1992, has become privatized and more efficient, and the total farming area has increased in the period following Estonia's restoration of independence. [65] The share of agriculture in the gross domestic product decreased from 15% to 3.3% during 1991–2000, while employment in agriculture decreased from 15% to 5.2%. [66]

The mining industry makes up 1% of the GDP. Mined commodities include oil shale, peat, and industrial minerals, such as clays, limestone, sand and gravel. [67] Soviets created badly polluting industry in the early 1950s, concentrated in the north-east of the country. Socialist economy and military areas left the country highly polluted, and mainly because of oil shale industry in Ida-Virumaa, sulfur dioxide emissions per person are almost as high as in the Czech Republic. The coastal seawater is polluted in certain locations, mainly the east. The government is looking for ways to reduce pollution further. [68] In 2000, the emissions were 80% smaller than in 1980, and the amount of unpurified wastewater discharged to water bodies was 95% smaller than in 1980. [69]

Estonian productivity is experiencing rapid growth, and consequently wages are also rising quickly, with a rise in private consumption of about 8% in 2005. According to Estonian Institute of Economic Research, the largest contributors to GDP growth in 2005 were processing industry, financial intermediation, retailing and wholesale trade, transport and communications. [70]

Agriculture

Estonia produced in 2018:

In addition to smaller productions of other agricultural products. [71]

In 2022, the sector with the highest number of companies registered in Estonia is Services with 144,514 companies followed by Finance, Insurance, and Real Estate and Retail Trade with 47,001 and 26,635 companies respectively. [73]

Infrastructure

Oil shale supplies around 70% of the country's primary energy. Oil shale extraction in VKG Ojamaa mine. VKG Ojamaa kaevandus.jpg
Oil shale supplies around 70% of the country's primary energy. Oil shale extraction in VKG Ojamaa mine.

Railway transport dominates the cargo sector, comprising 70% of all carried goods, domestic and international. Road transport is the one that prevails in the passenger sector, accounting for over 90% of all transported passengers. 5 major cargo ports offer easy navigational access, deep waters, and good ice conditions. There are 12 airports and 1 heliport in Estonia. Lennart Meri Tallinn Airport is the largest airport in Estonia, with 1,73 million passengers and 22,764 tons of cargo (annual cargo growth 119.7%) in 2007. International flight companies such as SAS, Finnair, Lufthansa, EasyJet, and Nordic Aviation Group provide direct flights to 27 destinations. [74]

Approximately 7.5% of the country's workforce is employed in transportation and the sector contributes over 10% of GDP. Estonia is getting much business from traffic between European Union and Russia, especially oil cargo through Estonian ports. Transit trade's share of GDP is disputed, but many agree that Russia's increased hostility is decreasing the share. [75] [76]

Instead of coal, electricity is generated by burning oil shale, with largest stations in Narva. Oil shale supplies around 70% of the country's primary energy. Other energy sources are natural gas imported from Russia, wood, motor fuels, and fuel oils. [77]

Wind power in Estonia amounts to 58.1  megawatts, whilst roughly 399 megawatts worth of projects are currently being developed. Estonian energy liberalization is lagging far behind the Nordic energy market. During the accession negotiations with the EU, Estonia agreed that at least 35% of the market are opened before 2009 and all of non-household market, which totals around 77% of consumption, before 2013. Estonia is concerned that Russia could use energy markets to bully it. [78] In 2009, the government considered granting permits to nuclear power companies, and there were plans for a shared nuclear facility with Latvia and Lithuania. [79] Those plans were shelved after the Fukushima Daiichi nuclear disaster in March 2011.

Estonia has high Internet penetration, and connections are available throughout most of the country.

Trade

CountryExportImport
Flag of Finland.svg  Finland 16%14%
Flag of Sweden.svg  Sweden 19%8%
Flag of Latvia.svg  Latvia 10%9%
Flag of Russia.svg  Russia 8%8%
Flag of Lithuania.svg  Lithuania 6%9%
Flag of Germany.svg  Germany 5%11%
Flag of the Netherlands.svg  Netherlands 4%8%

Estonia exports machinery and equipment (33% of all exports annually), wood and paper (15% of all exports annually), textiles (14% of all exports annually), food products (8% of all exports annually), furniture (7% of all exports annually), and metals and chemical products. Estonia also exports 1.562 million megawatt hours of electricity annually. Estonia imports machinery and equipment (33.5% of all imports annually), chemical products (11.6% of all imports annually), textiles (10.3'% of all imports annually), food products (9.4% of all imports annually), and transportation equipment (8.9% of all imports annually). Estonia imports 200 thousand megawatt hours of electricity annually. [80]

Natural resources

Resource Location Reserves
Oil shale north-east1,137,700,000 mln t
Sea mud (medical)south1,356,400,000 mln t
Construction sand across the country166,700,000 mln m3
Construction gravel north32,800,000 mln m3
Lake mud (medical)across the country1,133,300 mln t
Lake mud (fertilizer)east170,900 t
Ceramic clay across the country10,600,000 mln m3
Ceramsid clay (for gravel)across the country2,600,000 mln m3
Technological dolomite west16,600,000 mln m3
Technological limestone north13,800,000 mln m3
Decoration dolomite west2,900,000 mln m3
Construction dolomite west32,900,000 mln m3
Blue clay across the country2,044,000 mln t
Granite across the country1,245,100,000 mln m3
Peat across the country230,300,000 mln t
Construction limestone north110,300,000 mln m3
Limestone cement north9,400,000 mln m3
Clay cement north15,6000,000 mln m3
Graptolitic argillite [81] north64,000,000,000 mln t
Woodacross the country15,6000,000 mln m3
Technological sand north3,300,000 mln m3
Lake lime north and south808,000 t
Phosphorite northover 350,000,000 mln t (estimated)
Subsoil across the country21,1 km3

Data

The following table shows the main economic indicators in 1993–2018. [82]

YearGDP
(in Bil. US$ PPP)
GDP per capita
(in US$ PPP)
GDP

(in Bil. US$ nominal)

GDP growth
(real)
Inflation rate
(in Percent)
Unemployment
(in Percent)
Government debt
(in % of GDP)
1993Increase2.svg11.2Increase2.svg7,338Increase2.svg1.8Increase2.svgn/aIncrease Negative.svgIncrease Negative.svg6.5%n/a
1994Increase2.svg11.3Increase2.svgIncrease2.svg2.5Increase2.svgIncrease Negative.svgDecrease Positive.svgn/a
1995Increase2.svg11.7Increase2.svg8,022Increase2.svg3.9Increase2.svg2.2%Increase Negative.svg29.0%Increase Negative.svg9.6%9%
1996Increase2.svg12.5Increase2.svgIncrease2.svg4.8Increase2.svgIncrease Negative.svgDecrease Positive.svgDecrease Positive.svg
1997Increase2.svg14.4Increase2.svgIncrease2.svg5.2Increase2.svgIncrease Negative.svgDecrease Positive.svgDecrease Positive.svg
1998Increase2.svg15.2Increase2.svgIncrease2.svg5.6Increase2.svgIncrease Negative.svgDecrease Positive.svgDecrease Positive.svg
1999Increase2.svg15.3Increase2.svgIncrease2.svg5.7Increase2.svgIncrease Negative.svgIncrease Negative.svgIncrease Negative.svg
2000Increase2.svg17.3Increase2.svg12,113Increase2.svg5.7Increase2.svg10.6%Increase Negative.svg3.9%Increase Negative.svg14.6%Decrease Positive.svg5%
2001Increase2.svg18.8Increase2.svgIncrease2.svg6.3Increase2.svgIncrease Negative.svgIncrease Negative.svgIncrease Negative.svg
2002Increase2.svg20.3Increase2.svgIncrease2.svg7.4Increase2.svgIncrease2.svgIncrease Negative.svgIncrease Negative.svg
2003Increase2.svg22.3Increase2.svgIncrease2.svg9.9Increase2.svgIncrease2.svgDecrease Positive.svgIncrease Negative.svg
2004Increase2.svg24.5Increase2.svgIncrease2.svg12.2Increase2.svgIncrease Negative.svgDecrease Positive.svgIncrease Negative.svg
2005Increase2.svg27.7Increase2.svg19,765Increase2.svg14.1Increase2.svg9.4%Increase Negative.svg4.1%Decrease Positive.svg8.0%Steady2.svg5%
2006Increase2.svg31.3Increase2.svg22,600Increase2.svg17.1Increase2.svg10.3%Increase2.svg4.4%Decrease Positive.svg5.9%Increase Negative.svg4%
2007Increase2.svg34.6Increase2.svg25,144Increase2.svg22.5Increase2.svg7.7%Increase Negative.svg6.7%Decrease Positive.svg4.6%Decrease Positive.svg4%
200833.4Increase2.svg24,328Increase2.svg24.4Increase2.svg−5.4%Increase Negative.svg10.6%Decrease Positive.svg5.5%Increase Negative.svg4%
200928.7Increase2.svg20,94619.7Increase2.svg−14.7%Increase Negative.svg0.2%Increase Negative.svg13.5%Increase Negative.svg7%
2010Increase2.svg29.8Increase2.svg21,72119.6Increase2.svg2.3%Increase Negative.svg2.7%Increase Negative.svg16.7%Increase Negative.svg7%
2011Increase2.svg32.6Increase2.svg23,919Increase2.svg23.2Increase2.svg7.6%Increase Negative.svg5.1%Steady2.svg13.2%Increase Negative.svg6%
2012Increase2.svg34.4Increase2.svg25,49423.0Increase2.svg4.3%Increase Negative.svg4.2%Increase Negative.svg10.0%Decrease Positive.svg10%
2013Increase2.svg36.2Increase2.svg26,508Increase2.svg25.1Increase2.svg1.9%Increase2.svg3.2%Increase Negative.svg8.6%Increase Negative.svg10%
2014Increase2.svg38.1Increase2.svg27,856Increase2.svg26.6Increase2.svg2.9%Increase2.svg0.5%Decrease Positive.svg7.4%Decrease Positive.svg11%
2015Increase2.svg38.4Increase2.svg28,68522.9Increase2.svg1.7%Decrease Positive.svg0.1%Decrease Positive.svg6.2%Increase Negative.svg10%
2016Increase2.svg41.2Increase2.svg29,684Increase2.svg24.1Increase2.svg2.1%Decrease Positive.svg0.9%Decrease Positive.svg6.8%Increase Negative.svg9%
2017Increase2.svg44.7Increase2.svg31,750Increase2.svg26.9Increase2.svg4.9%Increase2.svg3.7%Decrease Positive.svg5.8%Decrease Positive.svg9%
2018Increase2.svg47.5Increase2.svgIncrease2.svg30.6Increase2.svgIncrease2.svgDecrease Positive.svgDecrease Positive.svg
2019Increase2.svg50.3Increase2.svg31.3

Gross domestic product by country [83]

GDP per capita, euros
County2020
Whole country20184
Harju county28927
..Tallinn33563
Hiiu county8072
Ida-Viru county11665
Jõgeva county9294
Järva county12609
Lääne county10313
Lääne-Viru county12966
Põlva county7757
Pärnu county11883
Rapla county9540
Saare county11712
Tartu county19280
..Tartu city22326
Valga county7981
Viljandi county12387
Võru county8496

See also

Related Research Articles

<span class="mw-page-title-main">Economy of Bulgaria</span>

The economy of Bulgaria functions on the principles of the free market, having a large private sector and a smaller public one. Bulgaria is an industrialised high-income country according to the World Bank, and is a member of the European Union (EU), the World Trade Organization (WTO), the Organization for Security and Co-operation in Europe (OSCE) and the Organization of the Black Sea Economic Cooperation (BSEC). The Bulgarian economy has experienced significant growth (538%), starting from $13.15 billion and reaching estimated gross domestic product (GDP) of $86 billion or $203 billion, GDP per capita of $31,148, average gross monthly salary of 2,009 leva, and average net monthly salary of $2,102 (2022). The national currency is the lev, pegged to the euro at a rate of 1.95583 leva for 1 euro. The lev is the strongest and most stable currency in Eastern Europe.

<span class="mw-page-title-main">Economy of Croatia</span>

The economy of Croatia is a developed social market economy. It is one of the largest economies in Southeast Europe by nominal gross domestic product (GDP). It is an open economy with accommodative foreign policy, highly dependent on international trade in Europe. Within Croatia, economic development varies among its counties, with strongest growth in Central Croatia and its financial centre, Zagreb. It has a very high level of human development, low levels of wealth inequality, and a high standard of living. Croatia's labor market has been perennially inefficient, with inconsistent business standards as well as ineffective corporate and income tax policy.

<span class="mw-page-title-main">Economy of the Czech Republic</span>

The economy of the Czech Republic is a developed export-oriented social market economy based in services, manufacturing, and innovation that maintains a high-income welfare state and the European social model. The Czech Republic participates in the European Single Market as a member of the European Union, and is therefore a part of the economy of the European Union. It uses its own currency, the Czech koruna, instead of the euro. It is a member of the Organisation for Economic Co-operation and Development (OECD). The Czech Republic ranks 16th in inequality-adjusted human development and 24th in World Bank Human Capital Index, ahead of countries such as the United States, the United Kingdom or France. It was described by The Guardian as "one of Europe's most flourishing economies".

<span class="mw-page-title-main">Economy of Greece</span>

The economy of Greece is the 54th largest in the world, with a nominal gross domestic product (GDP) of $250.276 billion per annum. In terms of purchasing power parity, Greece is the world's 55th largest economy, at $430.125 billion per annum. As of 2023, Greece is the sixteenth largest economy in the European Union and eleventh largest in the eurozone. According to the International Monetary Fund's figures for 2024, Greece's GDP per capita is $23,966 at nominal value and $41,188 at purchasing power parity.

<span class="mw-page-title-main">Economy of Latvia</span>

The economy of Latvia is an open economy in Europe and is part of the European Single Market. Latvia is a member of the World Trade Organization (WTO) since 1999, a member of the European Union since 2004, a member of the Eurozone since 2014 and a member of the OECD since 2016. Latvia is ranked the 14th in the world by the Ease of Doing Business Index prepared by the World Bank Group. According to the Human Development Report 2011, Latvia belongs to the group of very high human development countries. Due to its geographical location, transit services are highly developed, along with timber and wood processing, agriculture and food products, and manufacturing of machinery and electronic devices.

<span class="mw-page-title-main">Economy of Malta</span>

The economy of Malta is a highly industrialised service-based economy. It is classified as an advanced economy by the International Monetary Fund and is considered a high-income country by the World Bank and an innovation-driven economy by the World Economic Forum. It is a member of the European Union and of the eurozone, having formally adopted the euro on 1 January 2008.

<span class="mw-page-title-main">Economy of Poland</span>

The economy of Poland is an industrialised, mixed economy with a developed market that serves as the sixth-largest in the European Union by nominal GDP and fifth-largest by GDP (PPP). Poland boasts the extensive public services characteristic of most developed economies. Since 1988, Poland has pursued a policy of economic liberalisation but retained an advanced public welfare system. This includes universal free public healthcare and education, extensive provisions of free public childcare, and parental leave. The country is considered by many to be a successful post-communist state. It is classified as a high-income economy by the World Bank, ranking 20th worldwide in terms of GDP (PPP), 21st in terms of GDP (nominal), and 21st in the 2023 Economic Complexity Index.

<span class="mw-page-title-main">Economy of Romania</span>

The economy of Romania is a high-income mixed economy, with a high degree of complexity. It ranks 12th in the European Union by total nominal GDP and 7th largest when adjusted by purchasing power (PPP). The World Bank notes that Romania's efforts are focused on accelerating structural reforms and strengthening institutions in order to further converge with the European Union. The country's economic growth has been one of the highest in the EU since 2010, with 2022 seeing a better-than-expected 4.8% increase.

<span class="mw-page-title-main">Economy of Slovakia</span>

The economy of Slovakia is based upon Slovakia becoming an EU member state in 2004, and adopting the euro at the beginning of 2009. Its capital, Bratislava, is the largest financial centre in Slovakia. As of Q1 2018, the unemployment rate was 5.72%.

<span class="mw-page-title-main">Economy of Slovenia</span>

The economy of Slovenia is a developed economy, and the country enjoys a high level of prosperity and stability as well as above-average GDP per capita by purchasing power parity at 92% of the EU average in 2022. The nominal GDP in 2023 is 68.108 billion USD, nominal GDP per capita (GDP/pc) in 2023 is USD 32,350. The highest GDP/pc is in central Slovenia, where the capital city Ljubljana is located. It is part of the Western Slovenia statistical region, which has a higher GDP/pc than eastern Slovenia.

<span class="mw-page-title-main">Economy of Spain</span>

The economy of Spain is a highly developed social market economy. It’s the world's 15th largest by nominal GDP and the sixth-largest in Europe. Spain is a member of the European Union and the eurozone, as well as the Organization for Economic Co-operation and Development and the World Trade Organization. In 2021, Spain was the twentieth-largest exporter in the world and the sixteenth-largest importer. Spain is listed 27th in the United Nations Human Development Index and 37th in GDP per capita by the World Bank. Some of the main areas of economic activity are the automotive industry, medical technology, chemicals, shipbuilding, tourism and the textile industry. Among OECD members, Spain has a highly efficient and strong social security system, which comprises roughly 23.2% of GDP.

<span class="mw-page-title-main">Economy of Austria</span>

The economy of Austria is a highly developed social market economy, with the country being one of the fourteen richest in the world in terms of GDP per capita. Until the 1980s, many of Austria's largest industry firms were nationalised. In recent years, privatisation has reduced state holdings to a level comparable to other European economies.

<span class="mw-page-title-main">Eurozone</span> Area in which the euro is the official currency

The euro area, commonly called the eurozone (EZ), is a currency union of 20 member states of the European Union (EU) that have adopted the euro (€) as their primary currency and sole legal tender, and have thus fully implemented EMU policies.

<span class="mw-page-title-main">Financial and social rankings of sovereign states in Europe</span> Overview of financial and social rankings of the sovereign states in Europe

This page compares the sovereign states of Europe on economic, financial and social indicators.

<span class="mw-page-title-main">Economy of Europe</span>

The economy of Europe comprises about 748 million people in 50 countries. The formation of the European Union (EU) and in 1999 the introduction of a unified currency, the Euro, brought participating European countries closer through the convenience of a shared currency. The European Union is a unique global organisation, an entity forming one of the largest economies in the world. The European Union also “regulates” the global market by the single market. The difference in wealth across Europe can be seen roughly in the former Cold War divide, with some countries breaching the divide. Whilst most European states have a GDP per capita higher than the world's average and are very highly developed, some European economies, despite their position over the world's average in the Human Development Index, are relatively poor. Europe has total banking assets of more than $50 trillion and its Global assets under management has more than $20 trillion.

<span class="mw-page-title-main">Baltic Tiger</span> Estonia, Latvia and Lithuania during their periods of economic boom

Baltic Tiger is a term used to refer to any of the three Baltic states of Estonia, Latvia, and Lithuania during their periods of economic boom, which started after the year 2000 and continued until 2006–2007. The term is modeled on Four Asian Tigers, Tatra Tiger, and Celtic Tiger, which were used to describe the economic boom periods in East Asia, Hungary, Serbia, Slovakia, and Ireland, respectively.

<span class="mw-page-title-main">Economy of the European Union</span>

The economy of the European Union is the joint economy of the member states of the European Union (EU). It is the second largest economy in the world in nominal terms, after the United States, and the third largest at purchasing power parity (PPP), after China and the US. The European Union's GDP is estimated to be $19.35 trillion (nominal) in 2024 or $26.64 trillion (PPP), representing around one-sixth of the global economy. Germany has the biggest national GDP of all EU countries, followed by France and Italy.

<span class="mw-page-title-main">Economy of Lithuania</span>

The economy of Lithuania is the largest economy among the three Baltic states. Lithuania is a member of the European Union and belongs to the group of very high human development countries and is a member of the WTO and OECD.

<span class="mw-page-title-main">2008 Latvian financial crisis</span>

The 2008 Latvian financial crisis, which stemmed from the global financial crisis of 2008–2009, was a major economic and political crisis in Latvia. The crisis was generated when an easy credit market burst, resulting in an unemployment crisis, along with the bankruptcy of many companies. Since 2010, economic activity has recovered and Latvia's economic growth rate was the fastest among the EU member states in the first three quarters of 2012.

<span class="mw-page-title-main">Baltic states housing bubble</span> Economic bubble involving major cities of Baltic states in 2000s

The Baltic states' housing bubble was an economic bubble involving major cities in Estonia, Latvia and Lithuania. The three Baltic countries had enjoyed a relatively strong economic growth between 2000 and 2006, and the real estate sectors had performed well since 2000. In fact, in between 2005Q1 and 2007Q1, the official house price index for Estonia, Latvia and Lithuania recorded a sharp jump of 104.6%, 134.3% and 106.7%. By comparison, the official house price index for Euro Area increased by 11.8% for a similar time period.

References

  1. "World Economic Outlook Database, April 2019". IMF.org. International Monetary Fund . Retrieved 29 September 2019.
  2. "World Bank Country and Lending Groups". datahelpdesk.worldbank.org. World Bank . Retrieved 29 September 2019.
  3. "Population on 1 January". ec.europa.eu/eurostat. Eurostat . Retrieved 13 July 2020.
  4. 1 2 3 4 5 6 7 8 "Report for Selected Countries and Subjects: April 2023". imf.org. International Monetary Fund.
  5. 1 2 3 4 5 6 7 "The World Factbook". CIA.gov. Central Intelligence Agency . Retrieved 3 March 2019.
  6. "At-risk-of-poverty rate". Statistics Estonia. Retrieved 21 February 2024.
  7. "People at risk of poverty or social exclusion". ec.europa.eu/eurostat. Eurostat . Retrieved 15 August 2020.
  8. "Gini coefficient of equivalised disposable income – EU-SILC survey". ec.europa.eu. World Bank . Retrieved 15 August 2020.
  9. Nations, United. "Human Development Index (HDI)". hdr.undp.org. HDRO (Human Development Report Office) United Nations Development Programme . Retrieved 12 October 2022.
  10. Nations, United. "Inequality-adjusted HDI (IHDI)". hdr.undp.org. UNDP . Retrieved 12 October 2022.
  11. "Labor force, total – Estonia". data.worldbank.org. World Bank . Retrieved 15 November 2019.
  12. "Employment rate by sex, age group 20–64". ec.europa.eu/eurostat. Eurostat . Retrieved 16 June 2019.
  13. "Unemployment by sex and age – monthly average". appsso.eurostat.ec.europa.eu/eurostat. Eurostat . Retrieved 4 October 2020.
  14. "Unemployment rate by age group". data.oecd.org. OECD . Retrieved 7 September 2020.
  15. 1 2 3 4 "Last year, trade increased". Statistics Estonia. 18 April 2019. Archived from the original on 30 July 2020. Retrieved 18 April 2019.
  16. 1 2 3 4 5 6 "Euro area and EU27 government deficit both at 0.6% of GDP" (PDF). ec.europa.eu/eurostat. Eurostat. Retrieved 28 April 2020.
  17. "Archived copy" (PDF). Archived (PDF) from the original on 25 December 2017. Retrieved 25 December 2017.{{cite web}}: CS1 maint: archived copy as title (link)
  18. "Archived copy" (PDF). Archived (PDF) from the original on 20 April 2017. Retrieved 25 December 2017.{{cite web}}: CS1 maint: archived copy as title (link)
  19. "Scope downgrades Estonia to A+ and revises the Outlook to Stable". Scope Ratings. Retrieved 19 April 2024.
  20. "World Economic and Financial Surveys / World Economic Outlook". Database—WEO Groups and Aggregates Information. International Monetary Fund. April 2011. Retrieved 21 August 2012.
  21. "Kuidas läheb Soome majandusel? | SEB". Archived from the original on 30 July 2020. Retrieved 4 November 2017.
  22. Maddison, Angus (2006). The world economy. OECD Publishing. p. 185. ISBN   92-64-02261-9.
  23. 1 2 Laar, Mart (7 August 2007). "The Estonian Economic Miracle". The Heritage Foundation. Archived from the original on 3 March 2010. Retrieved 21 August 2012.
  24. "GDP per capita, PPP (current international $)". World Bank . Retrieved 6 January 2020.
  25. 1 2 3 4 Kattel, Rainer; Raudla, Ringa (August 2011), "Why Did Estonia Choose Fiscal Retrenchment after the 2008 Crisis?", Journal of Public Policy, retrieved 9 February 2019
  26. 1 2 3 "Alcohol and tobacco tax to rise in Estonia next year". Helsingin Sanomat . Finland. 25 May 2007. Retrieved 1 January 2009.
  27. "History of Estonia". Britannica. Retrieved 29 January 2021.
  28. Evans, Anthony John; Aligica, Paul Dragos (16 March 2024). "The Spread of the Flat Tax in Eastern Europe: A Comparative Study". Eastern European Economics. 46 (3): 49–67. doi:10.2753/EEE0012-8775460303. JSTOR   27740067.
  29. 1 2 Tubalkain-Trell, Marge (9 June 2009). "Estonian Economy Fell 15.1 pct in Q1". Baltic Business News. Archived from the original on 11 August 2014. Retrieved 21 August 2012.
  30. "Government approves supplementary budget for 2008". Ministry of Finance of the Republic of Estonia. 15 May 2008. Retrieved 21 August 2012.
  31. Mardiste, David (9 June 2009). "Estonian Economy Contracts Sharply in First Quarter". Reuters . Retrieved 21 August 2012.
  32. Tubalkain-Trell, Marge (12 June 2009). "Estonian Industrial Production Fell Most in EU". Baltic Business News. Archived from the original on 11 August 2014. Retrieved 21 August 2012.
  33. "Country Comparison – National product real growth rate". The World Factbook. CIA. 2009. Archived from the original on 7 July 2014. Retrieved 26 April 2010.
  34. Zumbrun, Joshua (8 July 2009). "In Pictures: The World's Hardest-Hit Economies". Forbes .
  35. Tubalkain-Trell, Marge (18 June 2009). "MPs approve plan to increase VAT rate to 20 pct". Baltic Business News. Retrieved 21 August 2012.
  36. "Töötuse määr" [Unemployment rate] (in Estonian). Statistics Estonia. 2019. Archived from the original on 9 February 2019. Retrieved 9 February 2019.
  37. "The Estonian euro coin". Tere Euro. Bank of Estonia. 11 July 2011. Archived from the original on 24 February 2021. Retrieved 9 February 2019.
  38. "Tarbijahinnaindeksi muutus" [Consumer-price index change] (in Estonian). Statistics Estonia. 2019. Archived from the original on 9 February 2019. Retrieved 9 February 2019.
  39. "Estonia ready for euro". European Commission. 12 May 2010. Retrieved 12 May 2010.
  40. Estonia to Join Euro 1 January 2011 Archived 11 June 2010 at the Wayback Machine
  41. Mardiste, David (1 January 2011). "Estonia joins crisis-hit euro club". Reuters . Retrieved 21 August 2012.
  42. Ummelas, Ott (9 August 2011). "Estonia's Rating Raised to AA- by S&P on Economic Growth, Strong Finances". Bloomberg . Retrieved 11 August 2011. Estonia's credit rating was raised by Standard & Poor's Ratings to the second-highest level in eastern Europe on the Baltic country's strong economic growth and solid public finances.
  43. "Unemployment in Europe (monthly)" (The chart shows data for the EU, Estonia, and Finland). Google Public Data Explorer . Eurostat . Retrieved 24 January 2014.
  44. "GDP Growth Rate". Google Public Data. World Bank . Retrieved 24 May 2013.
  45. "Economic growth will slow". 1 March 2022.
  46. "Eurostat: Inflation in Estonia 24.2 percent in September". 30 September 2022.
  47. "Estonia (03/04)". U.S. Department of State. Retrieved 21 July 2021.
  48. Andmevara, AS (24 February 1918). "The Constitution of the Republic of Estonia–Riigi Teataja". Avaleht–Riigi Teataja. Retrieved 29 February 2024.
  49. World Intellectual Property Organization (2022). Intellectual property statistical country profile: Estonia (PDF) (Report). European Climate, Infrastructure and Environment Executive Agency. Retrieved 29 February 2024.
  50. "Estonia". International Property Rights Index. Retrieved 29 February 2024.
  51. "Protecting Intellectual Property". International Trade Administration. 15 October 2020. Retrieved 29 February 2024.
  52. "Most requested statistics". Main indicators. Statistics Estonia. 30 September 2013. Archived from the original on 23 November 2012. Retrieved 4 October 2013.
  53. "Average monthly gross wages and salaries | Statistikaamet". www.stat.ee. Retrieved 9 September 2021.
  54. "CEPII Country Profiles: Estonia". CEPII. Retrieved 4 October 2020.
  55. "The Great Shift: Macroeconomic projections for the world economy at the 2050 horizon" (PDF). France: CEPII. February 2012. Retrieved 21 August 2012.
  56. "Creating a strategy and action plan for circular economy in Estonia". Estonia: ringmajandus.envir.ee. 5 July 2019. Retrieved 8 January 2022.
  57. "Ringmajanduse strateegia koostamise metoodika väljatöötamine" (PDF). Estonia: ringmajandus.envir.ee. 5 July 2019. Retrieved 8 January 2022.
  58. "ESTONIAN CIRCULAR ECONOMY INDUSTRIES ASSOCIATION: ESTONIA SHOULD CONSIDER THE GREEN DEAL AND PRINCIPLES OF CIRCULAR ECONOMY WHEN MAKING INVESTMENTS TO RECOVER THE ECONOMY". Estonia: EESTI PAKENDIRINGLUS. 2020. Retrieved 8 January 2022.
  59. "Estonian exceptionalism". The Economist . 14 July 2011. Retrieved 11 August 2011.
  60. Tammaru, Tiit (April 2012). "Social Impact of Emigration and Rural-Urban Migration in Central and Eastern Europe". ec.europa.eu. Retrieved 1 February 2019.
  61. "Most requested statistics". Statistics Estonia. Archived from the original on 23 November 2012. Retrieved 22 May 2011.
  62. "Estonia Unemployment Rate" . Retrieved 19 August 2023.
  63. "Hackers Take Down the Most Wired Country in Europe". Wired . 21 August 2007. Retrieved 21 August 2012.
  64. "Government of Estonia homepage". Government of Estonia.
  65. Laansalu, Ants (9 October 2009). "Crisis in agriculture in the 1990s". The rural economy in Estonia until 2001. Estonica. Archived from the original on 10 June 2007. Retrieved 11 August 2011.
  66. "The biggest share of the gross domestic product of Estonia is continuously created in Harju county" (Press release). Statistics Estonia. 26 September 2007. Archived from the original on 8 August 2014. Retrieved 11 August 2011.
  67. Kuo, Chin S. (2001). "The Mineral Industries of Estonia, Latvia, and Lithuania" (PDF). U.S. Geological Survey Minerals Yearbook. U.S. Geological Survey Mineral Resources Program. Retrieved 10 August 2011.
  68. Estonian Environment Information Centre (2001). "Pollution load". State of Environment in Estonia on Threshold of XXI Century. UNEP/GRID-Arendal – Central & Eastern Europe, Caucasus, and Central Asia. Archived from the original on 8 February 2012. Retrieved 10 August 2011.
    Main resource: State of Environment in Estonia on Threshold of XXI Century Archived 8 October 2016 at the Wayback Machine
  69. "Environment – current issues (section)". Estonia – The World Factbook. University of Missouri–St. Louis. Central Intelligence Agency. 17 May 2005. Archived from the original on 24 August 2013. Retrieved 10 August 2011.
  70. Estonian Institute of Economic Research (November 2006). "Top Estonian Enterprises 2006" (PDF). Enterprise Estonia. Archived from the original (PDF) on 9 June 2007.
  71. "Estonia production in 2018, by FAO".
  72. 1 2 Oja, Tõnis. "Suured kasvasid suuremaks" (in Estonian). Postimees. Retrieved 2 March 2019.
  73. "Industry Breakdown of Companies in Estonia". HitHorizons.
  74. TRANSPORTATION Archived 7 July 2007 at the Wayback Machine , Invest in Estonia
  75. Purju, Alari (29 February 2008). "Transit trade through Estonia: problems and developments" (PDF). Finland: University of Turku, Pan-European Institute. Archived from the original (PDF) on 11 February 2012. Retrieved 21 August 2012.
  76. Tubalkain-Trell, Marge (19 June 2008). "Estonian businessman: Estonian transit will struggle another 10 years". Baltic Business News. Archived from the original on 11 August 2014. Retrieved 21 August 2012.
  77. "Countries: Estonia". Wind energy in the Baltic Sea Region. Baltic Wind Energy Association. 2004. Archived from the original on 21 November 2008.
  78. Kasekamp, Andres; Mäe, Andres; Soosaar, Sulev; Uustalu, Jaan; Vares, Villu; Wegmarshaus, Gert-Rüdiger (September 2006). "Energy Security of Estonia in the Context of the Energy Policy of the European Union" (PDF). Estonian Foreign Policy Institute. Archived from the original (PDF) on 8 January 2012. Retrieved 10 August 2011.
  79. "Latvia, Estonia push for Baltic nuclear plant". Spacedaily.com. Agence France-Presse. 18 February 2009. Retrieved 10 August 2011.
  80. "Estonia". World Factbook. International Monetary Fund. CIA . Retrieved 21 August 2012.
  81. "Maavarad" [Minerals] (in Estonian). University of Tartu . Retrieved 3 March 2015.
  82. "Report for Selected Countries and Subjects". International Monetary Fund. January 2018. Retrieved 11 September 2018.
  83. "RAA0050: Gross domestic product by county (ESA 2010)". andmebaas.stat.ee. Retrieved 24 September 2022.