Economy of Malaysia

Last updated

Economy of Malaysia
The Twins SE Asia 2019 (49171985716).jpg
Kuala Lumpur, national capital of Malaysia, and its largest city
Currency Ringgit (MYR, RM)
Calendar year
Trade organisations
APEC, ASEAN, IOR-ARC, WTO, JETRO, RCEP, CPTPP, EAS, AFTA
Country group
Statistics
PopulationIncrease2.svg 33,938,221 (2022) [3]
GDP
  • Increase2.svg $465.542 billion (nominal; 2024 est.) [4]
  • Increase2.svg $1.379 trillion (PPP; 2024 est.) [4]
GDP rank
GDP growth
  • Increase2.svg 3.1% (2021) [5]
  • Increase2.svg 8.7% (2022) [5]
GDP per capita
  • Increase2.svg $13,913 (nominal; 2024 est.) [4]
  • Increase2.svg $39,773 (PPP; 2024 est.) [4]
GDP per capita rank
GDP by sector
1.5% (January 2024) [4]
Population below poverty line
Increase Negative.svg 41.2 medium (2018, World Bank) [8]
Labour force
  • Increase2.svg 16,760,000 (Jan 2023) [11]
  • 69.8% employment rate (Jan 2023) [12]
Labour force by occupation
UnemploymentDecrease Positive.svg 3.4% (Sep 2023) [4]
Main industries
Electronics, semiconductors, microchips, integrated circuits, rubber, oleochemicals, automotive, optical devices, pharmaceuticals, medical equipment, smelting, timber, wood pulp, Islamic finance, petroleum, liquified natural gas, petrochemicals, telecommunication product
External
Exports$297.60 billion (2022 est.) [14]
Export goods
Semiconductor & electronic products, palm oil, liquefied natural gas, petroleum, chemicals, machinery, vehicles, optical & scientific equipment, manufactures of metal, rubber, wood and wood products
Main export partners
Imports$234 billion (2022 est.) [16]
Import goods
Electrical & electronic products, machinery, chemicals, petroleum, plastics, vehicles, manufactures of metal, iron and steel products
Main import partners
FDI stock
Increase2.svg $194 billion (2023 est.) [17]
Decrease2.svg $11.639 billion (2023 est.) [4]
Increase Negative.svg $273.9 billion (31 March 2022 est.) [13]
Public finances
Increase Negative.svg 66.909% of GDP (2023 est.) [4]
Decrease Positive.svg −4.690% (of GDP) (2023 est.) [4]
Revenues50.30 billion (2021 est.) [13]
Expenses75.67 billion (2021 est.) [13]
Economic aid$31.6 million (2005 est.)
Decrease2.svg US$110.1 billion (29 September 2023) [21]
Main data source: CIA World Fact Book
All values, unless otherwise stated, are in US dollars.

The economy of Malaysia is the fifth largest in Southeast Asia and the 36th largest in the world in terms of GDP. [22] The 2018 labour productivity of Malaysia was measured at Int$55,360 per worker, the third highest in ASEAN. [23] The 2021 Global Competitiveness Report ranked Malaysian economy the 25th most competitive country economy in the world. [24]

Contents

Malaysians enjoy a relatively affluent lifestyle compared to many of its neighbours in Southeast Asia. This is due to a fast-growing export-oriented economy, a relatively low national income tax, highly affordable local food and transport fuel, as well as a fully subsidized single-payer public healthcare system. Malaysia has a newly industrialised market economy, which is relatively open and state-oriented. [25] [26] The Malaysian economy is highly robust and diversified with the export value of high-tech products in 2020 standing at US$92.1 billion, the second highest in ASEAN. [27] Malaysia exports the second largest volume and value of palm oil products globally, after Indonesia. [28]

History

As one of three countries that control the Strait of Malacca, international trade plays a very significant role in Malaysia's economy. [29] At one time, it was the largest producer of tin, rubber and palm oil in the world. [30] Manufacturing has a large influence in the country's economy, accounting for over 40% of the GDP. [31]

In the 1970s, Malaysia began to imitate the four Asian Tiger economies (Hong Kong, Singapore, South Korea, and Taiwan) and committed itself to a transition from being reliant on mining and agriculture to an economy that depends more on manufacturing. In the 1970s, the predominantly mining and agricultural based Malaysian economy began a transition towards a more multi-sector economy. Since the 1980s the industrial sector has led Malaysia's growth. High levels of investment played a significant role in this. With Japanese investment, heavy industries flourished and in a matter of years, Malaysian exports became the country's primary growth engine. Malaysia consistently achieved more than 7% GDP growth along with low inflation in the 1980s and the 1990s.

In 1991, former Prime Minister of Malaysia, Tun Dr Mahathir outlined his ideal, Vision 2020 in which Malaysia would become a self-sufficient industrialised nation by 2020. [32] Tan Sri Nor Mohamed, a government minister, said Malaysia could attain developed country status in 2018 if the country's growth remains constant or increases. [33]

Malaysia experienced an economic boom and underwent rapid development during the late 20th century and has GDP per capita (nominal) of US$11,062.043 in 2014, and is considered a newly industrialised country. [34] [35] [36] In 2009, the PPP GDP was US$383.6 billion, about half the 2014 amount, and the PPP per capita GDP was US$8,100, about one third the 2014 amount. [37]

In 2014, the Household Income Survey undertaken by the government indicated that there were 7 million households in Malaysia, with an average of 4.3 members in each household. The average household income of Malaysia increased by 18% to RM5,900 a month, compared to RM5,000 in 2012.

According to a HSBC report in 2012, Malaysia will become the world's 21st largest economy by 2050, with a GDP of $1.2 trillion (Year 2000 dollars) and a GDP per capita of $29,247 (Year 2000 dollars). The report also says "The electronic equipment, petroleum, and liquefied natural gas producer will see a substantial increase in income per capita. Malaysian life expectancy, relatively high level of schooling, and above average fertility rate will help in its rapid expansion." Viktor Shvets, the managing director in Credit Suisse, has said "Malaysia has all the right ingredients to become a developed nation." [38]

In the beginning of 2020, Malaysian economy was severely afflicted by COVID-19 pandemic that eventually expanded to the rest of the world, and causing the economic shutdown and downturn in the country, worse since 2008. In early December 2020 during the pandemic, Fitch Ratings downgraded the country's rating from A− to BBB+. Some, such as Hoo Ke Ping at the Kingsley Strategic Institute, suggested that this was because of a lack of communication between the new government and the ratings agency. Others, such as Carmelo Ferlito, from the Centre for Market Education, said it might require something more substantial as the recent budget lacked a strategy for the recovery as well as addressing the political tensions, and also, Shan Saeed at Juwai IQI suggested that the agency had lots its relevance as the analysis was "Behind the curve".[ citation needed ] However, COVID-19 recession in the country was ended by 1 April 2022 as COVID-19 Omicron infection rate continued to fall and ahead of the endemic phase.

Economic policies

Monetary policy

Malaysian ringgit was an internationalised currency, which was freely traded around the world. Just before the crisis, the Ringgit was traded RM2.50 at the dollar. Due to speculative activities, the Ringgit fell to as much as RM4.10 to the dollar in matter of weeks. Prime Minister Mahathir Mohamad decided to impose capital controls to prevent the outflow of the Ringgit in the open market. The Ringgit became non-internationalised and a traveller had to declare to the central bank if taking out more than RM10,000 out of the country and the Ringgit itself was pegged at RM3.80 to the US dollar.

The fixed exchange rate was abandoned in favour of the floating exchange rate in July 2005, hours after China announced the same move. [39] At this point, the Ringgit was still not internationalised. The Ringgit continued to strengthen to 3.18 to the dollar by March 2008 and appreciated as low as 2.94 to the dollar in May 2011. Meanwhile, many aspects of capital control have been slowly relaxed by Bank Negara Malaysia. However, the government continues to not internationalise the Ringgit. The government stated that the Ringgit will be internationalised once it is ready. [40]

Bank Negara Malaysia for the time being, uses interest rate targeting. The Overnight Policy Rate (OPR) is their policy instrument, and is used to guide the short term interbank rates which will hopefully influence inflation and economic growth.

Affirmative action

Tun Abdul Razak, who was then the Prime Minister, implemented the affirmative action policy named as New Economic Policy (NEP) soon after 13 May Incident in 1969. [41] Prior to the incident, the poverty rates among Malays were extremely high (at 65%) as was discontent between races, particularly towards the Chinese, who controlled 74% of the economy at the time. [42] [43] Through NEP, the Bumiputeras majority were given priority and special privileges in housing developments, scholarship admission and also for ownership of publicly listed companies.

The Malaysian New Economic Policy was created in 1971 with the aim of bringing Malays a 30% share of the economy of Malaysia and eradicating poverty amongst Malays, primarily through encouraging enterprise ownership by Bumiputeras. After 40 years of the program, bumiputra equity ownership rose to 23% worth RM167.7 billion in 2010 against 2.4% in 1970.

The NEP was accused of creating an oligarchy, and creating a 'subsidy mentality'. [44] Political parties such as Parti Keadilan Rakyat and Democratic Action Party proposed a new policy which will be equal for every Malaysian, regardless of race. [45] When the Democratic Action Party was elected in the state of Penang in 2008, it announced that it would do away with the NEP, claiming that it "... breeds nepotism, corruption and systemic inefficiency". [46]

Wolfgang Kasper, a professor of economics at University of New South Wales, and once an adviser to Malaysia's Finance Ministry, criticized the NEP, saying that "NEP handouts (are) making Malays lazy, corrupt & swell-headed. Worst of all, it keeps them poor." He also criticized the Federal Government giving cash-handouts and financial aid instead of providing equal access to education to help the marginalized poor to lift their income status.

On 21 April 2009, the prime minister Najib Tun Razak announced the liberalization of 27 services sub-sector by abolishing the 30% bumiputera requirement. The move was seen as a government effort to increase investment in the service sector of the economy. According to the premier, many more sectors of the economy would be liberalized. [47]

On 30 June 2009, the prime minister announced further liberation moves including the dismantling of the Bumiputera equity quotas and repealing the guidelines of the Foreign Investment Committee, which was responsible to monitor foreign shareholding in Malaysian companies. However, any Malaysian companies that wished to list in Malaysia would still need to offer 50 percent of public shareholding spread to Bumiputera investors. [48]

Subsidies and price controls

The Malaysian government subsidises and controls prices on a lot of essential items to keep the prices low. Prices of items such as palm oil, cooking oil, petrol, flour, bread, rice and other essentials have been kept under market prices to keep cost of living low. [49] As of 2009, 22 per cent of government expenditures were subsidies, with petrol subsidies alone taking up 12 per cent. [50]

Since 2010, the government has been gradually reforming Malaysia's subsidy system, via a series of reductions in subsidies for fuel and sugar to improve government finances and to improve economic efficiency. As a result, in December 2014, the government officially ended all fuel subsidies and implemented a 'managed float' system, [51] taking advantage of low oil prices at the time, potentially saving the government almost RM20 billion ringgit (US$5.97 billion) annually. [52]

Sovereign wealth funds

The government owns and operates several sovereign wealth funds that invest in local companies and also foreign companies. One such fund is Khazanah Nasional Berhad which was established in 1993, and as of 31 December 2013 has US$41 billion worth of assets. [53] [54] The fund invests in major companies in Malaysia such as CIMB in the banking sector, UEM Group in the construction sector, Telekom Malaysia and Axiata in the communications industry, Malaysia Airports and Malaysia Airlines in the aerospace industry, as well as Tenaga Nasional in the energy sector [55]

Another fund that is owned by the Malaysian government is the Employees Provident Fund which is a retirement fund that as of 31 March 2014, has an asset size of RM597 billion. (US$184 billion), [56] making it the fourth largest pension fund in Asia and seventh largest in the world. [57] Like Khazanah Nasional, the EPF invests and sometimes owns several major companies in Malaysia such as RHB Bank. [58] EPF investment is diversified over a number of sectors but almost 40% of their investment are in the services sector. [59]

Permodalan Nasional Berhad is another major fund manager controlled by the Malaysian Government. It offers capital guaranteed mutual funds such as Amanah Saham Bumiputera and Amanah Saham Wawasan 2020 which are open only to Malaysian and in some cases, Bumiputeras. [60]

Government influence

Although the federal government promotes private enterprise and ownership in the economy, the economic direction of the country is heavily influenced by the government through five years development plans since independence. The economy is also influenced by the government through agencies such as the Economic Planning Unit and government-linked wealth funds such as Khazanah Nasional Berhad, Employees Provident Fund and Permodalan Nasional Berhad.

The government's development plans, called the Malaysian Plan, currently the Tenth Malaysia Plan, started in 1950 during the British colonial rule. [61] The plans were largely centred around accelerating the growth of the economy by selectively investing in selective sectors of the economy and building infrastructure to support said sectors. [61] For example, in the current national plan, three sectors – agriculture, manufacturing and services, will receive special attention to promote the transition to high value-added activities in the respective areas. [62]

Government-linked investment vehicles such as Khazanah Nasional Berhad, Employees Provident Fund and Permodalan Nasional Berhad invest in and sometimes own major companies in major sectors of the Malaysian economy.

Data

The following table shows the main economic indicators in 1980–2021 (with IMF staff estimates in 2022–2027). Inflation below 5% is in green. [63]

YearGDP

(in Bil. US$PPP)

GDP per capita

(in US$ PPP)

GDP

(in Bil. US$nominal)

GDP per capita

(in US$ nominal)

GDP growth

(real)

Inflation rate

(in Percent)

Unemployment

(in Percent)

Government debt

(in % of GDP)

198046.33,337.826.81,927.0Increase2.svg7.4%Increase Negative.svg6.7%n/an/a
1981Increase2.svg54.3Increase2.svg3,813.0Increase2.svg27.3Decrease2.svg1,920.1Increase2.svg6.9%Increase Negative.svg9.7%n/an/a
1982Increase2.svg61.0Increase2.svg4,182.4Increase2.svg29.3Increase2.svg2,006.5Increase2.svg5.9%Increase Negative.svg5.8%n/an/a
1983Increase2.svg67.4Increase2.svg4,505.6Increase2.svg32.7Increase2.svg2,189.6Increase2.svg6.3%Increase2.svg3.7%n/an/a
1984Increase2.svg75.2Increase2.svg4,908.0Increase2.svg37.1Increase2.svg2,419.5Increase2.svg7.8%Increase2.svg3.9%n/an/a
1985Increase2.svg76.9Decrease2.svg4,862.0Decrease2.svg34.1Decrease2.svg2,154.5Decrease2.svg-0.9%Increase2.svg2.6%6.9%n/a
1986Increase2.svg79.4Increase2.svg4,883.2Decrease2.svg30.3Decrease2.svg1,864.0Increase2.svg1.2%Increase2.svg0.4%Increase Negative.svg8.3%n/a
1987Increase2.svg85.7Increase2.svg5,139.6Increase2.svg34.5Increase2.svg2,070.0Increase2.svg5.4%Increase2.svg0.7%Decrease Positive.svg8.2%n/a
1988Increase2.svg97.6Increase2.svg5,708.0Increase2.svg37.8Increase2.svg2,213.9Increase2.svg9.9%Increase2.svg0.3%Decrease Positive.svg8.1%n/a
1989Increase2.svg110.6Increase2.svg6,316.4Increase2.svg41.7Increase2.svg2,380.5Increase2.svg9.1%Increase2.svg2.6%Decrease Positive.svg6.7%n/a
1990Increase2.svg125.1Increase2.svg6,846.2Increase2.svg47.2Increase2.svg2,585.8Increase2.svg9.0%Increase2.svg3.0%Decrease Positive.svg5.1%74.1%
1991Increase2.svg141.6Increase2.svg7,636.5Increase2.svg53.5Increase2.svg2,885.1Increase2.svg9.5%Increase2.svg4.3%Decrease Positive.svg4.3%Decrease Positive.svg67.3%
1992Increase2.svg157.7Increase2.svg8,272.5Increase2.svg64.5Increase2.svg3,380.2Increase2.svg8.9%Increase2.svg4.8%Decrease Positive.svg3.7%Decrease Positive.svg59.1%
1993Increase2.svg177.5Increase2.svg9,053.0Increase2.svg72.9Increase2.svg3,717.4Increase2.svg9.9%Increase2.svg3.5%Decrease Positive.svg3.0%Decrease Positive.svg51.1%
1994Increase2.svg197.9Increase2.svg9,827.3Increase2.svg81.1Increase2.svg4,028.4Increase2.svg9.2%Increase2.svg3.7%Decrease Positive.svg2.9%Decrease Positive.svg43.7%
1995Increase2.svg222.0Increase2.svg10,731.8Increase2.svg96.6Increase2.svg4,672.1Increase2.svg9.8%Increase2.svg3.5%Increase Negative.svg3.1%Decrease Positive.svg38.2%
1996Increase2.svg248.6Increase2.svg11,715.0Increase2.svg109.9Increase2.svg5,176.3Increase2.svg10.0%Increase2.svg3.5%Decrease Positive.svg2.5%Decrease Positive.svg32.8%
1997Increase2.svg271.4Increase2.svg12,469.0Decrease2.svg108.8Decrease2.svg4,997.0Increase2.svg7.3%Increase2.svg2.7%Decrease Positive.svg2.4%Decrease Positive.svg29.6%
1998Decrease2.svg254.3Decrease2.svg11,386.4Decrease2.svg78.6Decrease2.svg3,520.9Decrease2.svg-7.4%Increase Negative.svg5.3%Increase Negative.svg3.2%Increase Negative.svg33.6%
1999Increase2.svg273.7Increase2.svg11,946.7Increase2.svg86.2Increase2.svg3,762.8Increase2.svg6.1%Increase2.svg2.7%Increase Negative.svg3.4%Increase Negative.svg34.4%
2000Increase2.svg304.2Increase2.svg12,945.8Increase2.svg102.1Increase2.svg4,347.7Increase2.svg8.7%Increase2.svg1.6%Decrease Positive.svg3.1%Decrease Positive.svg32.5%
2001Increase2.svg312.6Increase2.svg12,959.3Decrease2.svg101.1Decrease2.svg4,189.1Increase2.svg0.5%Increase2.svg1.4%Increase Negative.svg3.7%Increase Negative.svg38.1%
2002Increase2.svg334.6Increase2.svg13,532.2Increase2.svg109.8Increase2.svg4,441.8Increase2.svg5.4%Increase2.svg1.8%Decrease Positive.svg3.5%Increase Negative.svg39.5%
2003Increase2.svg361.0Increase2.svg14,256.3Increase2.svg120.0Increase2.svg4,740.3Increase2.svg5.8%Increase2.svg1.1%Increase Negative.svg3.6%Increase Negative.svg41.4%
2004Increase2.svg395.8Increase2.svg15,278.8Increase2.svg135.9Increase2.svg5,244.9Increase2.svg6.8%Increase2.svg1.4%Decrease Positive.svg3.6%Increase Negative.svg42.0%
2005Increase2.svg428.5Increase2.svg16,184.8Increase2.svg150.4Increase2.svg5,678.7Increase2.svg5.0%Increase2.svg3.0%Steady2.svg3.6%Decrease Positive.svg40.8%
2006Increase2.svg466.4Increase2.svg17,383.1Increase2.svg170.5Increase2.svg6,355.0Increase2.svg5.6%Increase2.svg3.6%Decrease Positive.svg3.3%Decrease Positive.svg39.7%
2007Increase2.svg509.2Increase2.svg18,789.4Increase2.svg202.9Increase2.svg7,485.9Increase2.svg6.3%Increase2.svg2.0%Decrease Positive.svg3.2%Decrease Positive.svg39.3%
2008Increase2.svg544.0Increase2.svg19,711.4Increase2.svg242.1Increase2.svg8,771.0Increase2.svg4.8%Increase Negative.svg5.4%Increase Negative.svg3.3%Increase Negative.svg39.4%
2009Decrease2.svg539.2Decrease2.svg19,202.1Decrease2.svg212.0Decrease2.svg7,550.3Decrease2.svg-1.5%Increase2.svg0.6%Increase Negative.svg3.7%Increase Negative.svg50.4%
2010Increase2.svg586.8Increase2.svg20,525.5Increase2.svg258.8Increase2.svg9,054.1Increase2.svg7.5%Increase2.svg1.7%Decrease Positive.svg3.3%Increase Negative.svg51.2%
2011Increase2.svg630.7Increase2.svg21,701.7Increase2.svg302.6Increase2.svg10,413.7Increase2.svg5.3%Increase2.svg3.2%Decrease Positive.svg3.1%Increase Negative.svg51.9%
2012Increase2.svg677.6Increase2.svg22,963.3Increase2.svg319.2Increase2.svg10,815.1Increase2.svg5.5%Increase2.svg1.7%Decrease Positive.svg3.0%Increase Negative.svg53.8%
2013Increase2.svg701.7Increase2.svg23,224.6Increase2.svg328.1Increase2.svg10,858.4Increase2.svg4.7%Increase2.svg2.1%Increase Negative.svg3.1%Increase Negative.svg55.7%
2014Increase2.svg745.4Increase2.svg24,273.0Increase2.svg343.1Increase2.svg11,172.4Increase2.svg6.0%Increase2.svg3.1%Decrease Positive.svg2.9%Decrease Positive.svg55.4%
2015Increase2.svg750.8Decrease2.svg24,074.1Decrease2.svg301.4Decrease2.svg9,663.3Increase2.svg5.0%Increase2.svg2.1%Increase Negative.svg3.2%Increase Negative.svg57.0%
2016Increase2.svg783.9Increase2.svg24,779.9Increase2.svg301.9Decrease2.svg9,544.2Increase2.svg4.5%Increase2.svg2.1%Increase Negative.svg3.5%Decrease Positive.svg55.8%
2017Increase2.svg829.3Increase2.svg25,897.2Increase2.svg319.2Increase2.svg9,969.5Increase2.svg5.8%Increase2.svg3.8%Decrease Positive.svg3.4%Decrease Positive.svg54.4%
2018Increase2.svg890.2Increase2.svg27,491.3Increase2.svg359.0Increase2.svg11,086.1Increase2.svg4.8%Increase2.svg1.0%Decrease Positive.svg3.3%Increase Negative.svg55.6%
2019Increase2.svg946.1Increase2.svg29,091.6Increase2.svg365.3Increase2.svg11,231.5Increase2.svg4.4%Increase2.svg0.7%Steady2.svg3.3%Increase Negative.svg57.1%
2020Decrease2.svg904.6Decrease2.svg27,760.7Decrease2.svg337.6Decrease2.svg10,361.3Decrease2.svg-5.5%Increase2.svg-1.1%Increase Negative.svg4.5%Increase Negative.svg67.7%
2021Increase2.svg971.3Increase2.svg29,702.4Increase2.svg373.0Increase2.svg11,407.7Increase2.svg3.1%Increase2.svg2.5%Increase Negative.svg4.7%Increase Negative.svg69.0%
2022Increase2.svg1,096.5Increase2.svg33,112.7Increase2.svg434.1Increase2.svg13,107.9Increase2.svg5.4%Increase2.svg3.2%Decrease Positive.svg4.5%Increase Negative.svg69.6%
2023Increase2.svg1,185.3Increase2.svg35,353.6Increase2.svg467.5Increase2.svg13,942.6Increase2.svg4.4%Increase2.svg2.8%Decrease Positive.svg4.3%Increase Negative.svg70.0%
2024Increase2.svg1,269.7Increase2.svg37,416.1Increase2.svg503.1Increase2.svg14,826.0Increase2.svg4.9%Increase2.svg2.4%Decrease Positive.svg4.2%Steady2.svg70.0%
2025Increase2.svg1,350.5Increase2.svg39,335.8Increase2.svg539.6Increase2.svg15,717.8Increase2.svg4.4%Increase2.svg2.4%Steady2.svg4.2%Increase Negative.svg70.2%
2026Increase2.svg1,437.2Increase2.svg41,395.7Increase2.svg577.2Increase2.svg16,623.9Increase2.svg4.4%Increase2.svg2.4%Steady2.svg4.2%Steady2.svg70.2%
2027Increase2.svg1,522.7Increase2.svg43,387.1Increase2.svg615.0Increase2.svg17,523.6Increase2.svg3.9%Increase2.svg2.5%Steady2.svg4.2%Increase Negative.svg70.6%

Currency

The only legal tender in Malaysia is the Malaysian ringgit. As of 19 February 2024, the ringgit is traded at MYR 4.78 at the US dollar. [64]

The ringgit has not been internationalised[ clarification needed ] since September 1998, due to the 1997 Asian financial crisis in which the Prime Minister Mahathir Mohamad imposed capital controls on the currency, due to speculative short-selling of the ringgit. [65] As a part of series of capital controls, the currency was pegged between September 1998 and 21 July 2005 at MYR 3.80 to the dollar after dropping from MYR 2.50 per USD to, at one point, MYR 4.80 per USD. [66]

In recent years, Bank Negara Malaysia has begun to relax certain rules on capital controls, although the currency itself is still not traded internationally. According to the Bank Governor, the ringgit will be internationalised when it is ready. [67]

In September 2010, in an interview with CNBC, Dato' Seri Najib Tun Razak, who was the then Prime Minister of Malaysia and also held the position of Finance Minister, said that the government was open to open up the ringgit to offshore trading if the move would help the economy. He added that before such a move could be made, it would ensure that rules and regulation were in place to avoid abuse of the currency. [68]

Natural resources

Palm oil estate in Malaysia. Oilpalm malaysia.jpg
Palm oil estate in Malaysia.

Malaysia is well-endowed with natural resources in areas such as agriculture, forestry and minerals. It is an exporter of natural and agricultural resources, the most valuable exported resource being petroleum. [69] In the agricultural sector, Malaysia is one of the top exporters of natural rubber and palm oil, which together with timber and timber products, cocoa, pepper, pineapple and tobacco dominate the growth of the sector. [70] As of 2011, the percentage arable land in Malaysia is 5.44%. Croplands consists of 17.49% while other land uses consists of 77.07%. [71] As of 2009, irrigated land covers 3,800 km2. Total renewable water resources make up 580 cubic km as of 2011.

Tin and petroleum are the two main mineral resources that are of major significance in the Malaysian economy. Malaysia was once the world's largest producer of tin until the collapse of the tin market in the early 1980s. [72] In the 19th and 20th century, tin played a predominant role in the Malaysian economy, with Malaysia accounting for over 31% of global output. It was only in 1972 that petroleum and natural gas took over from tin as the mainstay of the mineral extraction sector. Other minerals of some importance or significance include copper, bauxite, iron-ore and coal together with industrial minerals like clay, kaolin, silica, limestone, barite, phosphates and dimension stones such as granite as well as marble blocks and slabs. Small quantities of gold are produced.

In 2019, the country was the 11th largest world producer of manganese; [73] the 11th largest world producer of tin, [74] the 12th largest world producer of bauxite, [75] and the 19th largest world producer of lime. [76]

Energy resources

Malaysia holds proven oil reserves of 4 billion barrels as of January 2014, the fourth-highest reserves in Asia-Pacific after China, India, and Vietnam. Nearly all of Malaysia's oil comes from offshore fields. The continental shelf is divided into three producing basins: the basin offshore Eastern Peninsular Malaysia in the west and the Sarawak and Sabah basins in the east. Most of the country's oil reserves are located in the Peninsular basin and tend to be light and sweet crude. Malaysia's benchmark crude oil, Tapis Blend, is a light and sweet crude oil, with an API gravity of 42.7° and a sulphur content of 0.04% by weight.

Malaysia also holds 83 trillion cubic feet (Tcf) of proven natural gas reserves as of January 2014, and was the third-largest natural gas reserve holder in the Asia-Pacific region after China and Indonesia. More than half of the country's natural gas reserves are located in its eastern areas, predominantly offshore Sarawak. Most of Malaysia's gas reserves are associated with oil basins, although Sarawak and Sabah have an increasing amount of non-associated gas reserves that have offset some of the declines from mature oil and gas basins offshore Peninsular Malaysia. [77]

Business environment

In 2015, Malaysia's economy was one of the most competitive in the world, ranking 14th in the world and 5th for countries with a population of over 20 million, higher than countries like Australia, United Kingdom, South Korea and Japan. [78]

In 2015, Malaysia was the 6th most attractive country for foreign investors, ranked in the Baseline Profitability Index (BPI) published by Foreign Policy Magazine. [79]

The government is moving towards a more business friendly environment by setting up a special task force to facilitate business called PEMUDAH, which means "simplifier" in Malay. [80] Highlights includes easing restrictions and requirement to hire expatriates, shorten time to do land transfers and increasing the limit of sugar storage (a controlled item in Malaysia) for companies. [81]

Malaysia was ranked 33rd in the Global Innovation Index in 2020, up from 35th in 2019. [82] [83] [84] [85]

Taxation

In 2016, the Inland Revenue Board of Malaysia lowered the effective tax rate to 24% for businesses with capital exceeding 2.5 million ringgit. For the smaller companies, the rate is 19%. [86]

The Malaysian government also imposes government taxes such as the Sales and Services tax and real estate taxes. The current rate of SST is at 6% while disposal of property is subject to a schedule of period holding the property. [87]

External trade

In 2021, Malaysia's total external trade totaled RM2,227 billion (approximately US$530 billion), made up of RM1,239 billion (approximately US$295 billion) of exports and RM987 billion (approximately US$235 billion) of imports, making Malaysia the world's 21st largest exporter and the world's 25th largest importer.

Malaysia's largest trading partner is China. Malaysia has been China's top trading partner within ASEAN for five years in a row since 2008. The two-way trade volume between China and Malaysia in 2013 reached $106 billion, making Malaysia China's third-largest trade partner in Asia, just behind Japan and South Korea and eighth largest overall. [88] On 31 May 2014, during Najib Razak's visit to China where he was welcomed by China's Premier Li Keqiang, China and Malaysia pledged to increase bilateral trade to US$160 billion by 2017. They also agreed to upgrade economic and financial co-operation, especially in the production of halal food, water processing and railway construction. [89]

Malaysia's second largest trading partner is Singapore and Malaysia is Singapore's biggest trading partner, with bilateral trade totalling roughly US$91 billion in 2012, accounting for over a fifth of total trade within ASEAN. [90] [91]

Malaysia's third largest trading partner is Japan, amounting RM137.45 billion (US$42 billion) of trade in 2014, an increase of 1.4% compared with to 2013. Out of this, exports totalled RM82.71 billion (US$25.6 billion), a growth of 4.4% cent while imports contracted 2.9% to RM54.75 billion (US$16.74 billion). Malaysian Ambassador to Japan Datuk Ahmad Izlan Idris said the main exports from Malaysia to Japan were liquefied natural gas (LNG), electrical and electronics as well as chemical-based products. He said Malaysia's main imports from Japan were electrical and electronics, machines and equipment as well as spare parts and accessories for vehicles and cars. [92]

Malaysia is an important trading partner for the United States. In 1999, two-way bilateral trade between the US and Malaysia totalled US$30.5 billion, with US exports to Malaysia totalling US$9.1 billion and US imports from Malaysia increasing to US$21.4 billion. Malaysia was the United States' 10th-largest trading partner and its 12th-largest export market. During the first half of 2000, US exports totalled US$5 billion, while US imports from Malaysia reached US$11.6 billion.

Agriculture sector

Rubber plantation in Malaysia Rubbertrees malaysia.jpg
Rubber plantation in Malaysia

Agriculture is now a minor sector of the Malaysian economy, accounting for 7.1% of Malaysia's GDP in 2014 and employing 11.1% of Malaysia's labour force, contrasting with the 1960s when agriculture accounted for 37% of Malaysia's GDP and employed 66.2% of the labour force. The crops grown by the agricultural sector has also significantly shifted from food crops like paddy and coconut to industrial crops like palm oil and rubber, which in 2005 contributed to 83.7% of total agricultural land use, compared to 68.5% in 1960. [93]

Palm Oil Industry

Despite its minor contribution to Malaysia's GDP, Malaysia has a significant foothold in the world's agricultural sector, being the world's second largest producer of palm oil in 2012 [94] producing 18.79 million tonnes of crude palm oil on roughly 5,000,000 hectares (19,000 sq mi) of land. [95] [96] Though Indonesia produces more palm oil, Malaysia is the world's largest exporter of palm oil having exported 18 million tonnes of palm oil products in 2011. [97]

In March 2019, the European Commission concluded that palm oil cultivation results in excessive deforestation and its use in transport fuel should be phased out by 2030. In response, Mahathir Mohamad alleged that the European Union is at risk of starting a trade war with Malaysia regarding its "grossly unfair" policies geared towards decreasing the use of palm oil, which Mahathir stated was "unfair" and an example of "rich people...[trying] to impoverish poor people". [98]

Industry sector

Science policies in Malaysia are regulated by the Ministry of Science, Technology, and Innovation. The country is one of the world's largest exporters of semiconductor devices, electrical devices, and IT and communication products. [69]

Malaysia's industrial sector accounts for 36.8%, over a third of the country's GDP in 2014, and employs 36% of the labour force in 2012. The industrial sector mostly contributed by the electronics industry, automotive industry and construction industry.

Electrical and electronics

The electrical & electronics (E&E) industry is the leading sector in Malaysia's manufacturing sector, contributing significantly to the country's exports (32.8 per cent) and employment (27.2 per cent) in 2013. Malaysia benefits from the global demand in the usage of mobile devices (smartphones, tablets), storage devices (cloud computing, data centres), optoelectronics (photonics, fibre optics, LEDs) and embedded technology (integrated circuits, PCBs, LEDs). [99]

Electronic components

Products/activities which fall under this sub-sector include semiconductor devices, passive components, printed circuits and other components such as media, substrates and connectors.

Within the electronic components sub-sector, the semiconductor devices is the leading contributor of exports for the E&E industry. Exports of semiconductor devices were RM111.19 billion or 47% of the total E&E products exported in 2013.

Malaysia is a major hub for electrical component manufacturing, with factories of international companies like Intel, AMD, Freescale Semiconductor, ASE, Infineon, STMicroelectronics, Texas Instruments, Fairchild Semiconductor, Renesas, X-Fab and major Malaysian-owned companies such as Green Packet, Silterra, Globetronics, Unisem and Inari which have contributed to the steady growth of the semiconductor industry in Malaysia. To date, there are more than 50 companies, largely MNCs producing semiconductors devices in Malaysia. [99]

Photovoltaics

Malaysia is a major hub for solar equipment manufacturing, with factories of companies like First Solar, Panasonic, TS Solartech, Jinko Solar, JA Solar, SunPower, Hanwha Q Cells, and SunEdison in locations like Kulim, Penang, Malacca, Cyberjaya and Ipoh. [100] [101]

First Solar's factory in Kulim FirstSolarKulim.jpg
First Solar's factory in Kulim

In 2013, Malaysia's total production capacity for solar wafers, solar cells and solar panels totalled 4,042 MW. [102] By 2014, Malaysia was the world's third largest manufacturer of photovoltaics equipment, behind China and the European Union. [100]

Many international companies have the majority of production capacity located in Malaysia, such as the American company First Solar which has over 2,000 MW of production capacity located in Kulim and only 280 MW located in Ohio, [103] and formerly German-based Hanwha Q Cells which produces 1,100 MW worth of solar cells in Cyberjaya while producing only 200 MW worth of solar cells in Germany. SunPower's largest manufacturing facility with a capacity of 1,400 MW is also located in Malacca. [100] [104]

Automotive

The Proton Preve, a car made by Malaysian car company Proton. 2013 Proton Preve Premium (Test Drive Car) in Glenmarie, Malaysia.jpg
The Proton Prevé, a car made by Malaysian car company Proton.

The automotive industry in Malaysia consists of 27 vehicle producers and over 640 component manufacturers. [105] The Malaysian automotive industry is the third largest in Southeast Asia, and the 23rd largest in the world, with an annual production output of over 500,000 vehicles. [106] The automotive industry contributes 4% or RM 40 billion to Malaysia's GDP, and employs a workforce of over 700,000 throughout a nationwide ecosystem. [105]

The Malaysian automotive industry is Southeast Asia's sole pioneer of indigenous car companies, namely Proton and Perodua. In 2002, Proton helped Malaysia become the 11th country in the world with the capability to fully design, engineer and manufacture cars from the ground up. [107] The Malaysian automotive industry also hosts several domestic-foreign joint venture companies, which assemble a large variety of vehicles from imported complete knock down (CKD) kits.

Malaysia's first tech unicorn startup, automotive e-commerce platform Carsome, raised $290 million in a Series E funding round to expand its product, technology and infrastructure in Malaysia, Indonesia and Thailand. This latest funding round values the used-car online marketplace at $1.7 billion. [108]

Construction

Penang Bridge Penang Bridge in extension.jpg
Penang Bridge

Malaysia has a large construction industry of over RM102.2 billion (US$32 billion). The highest percentage share was contributed by construction of non-residential buildings which recorded 34.6 per cent. This was followed by civil engineering sub-sector (30.6%), residential buildings (29.7%), and special trades (5.1%). [109]

Selangor recorded the highest value of construction work done at 24.5% among the states, followed by Johor at 16.5%, Kuala Lumpur at 15.8%, Sarawak at 8.6% and Penang at 6.4%. The contribution of these five states accounted for 71.8% of the total value of construction work in Malaysia.

The expansion of the construction industry has been catalysed by major capital expenditure projects, and a key factor has been the government's Economic Transformation Programme (ETP) and public-private partnership (PPP) mega-projects like Tun Razak Exchange, KVMRT and Iskandar Malaysia. [109]

Defence

A Kedah-class warship, with another unit being built in the background Perak F173.jpg
A Kedah-class warship, with another unit being built in the background

Malaysia has a relatively new defence industry that was created after the government created the Malaysia Defence Industry Council to encourage local companies to participate in the country's defence sector in 1999.

The land sector of the defence industry is dominated by DefTech, a subsidiary of Malaysia's largest automotive manufacturer, DRB-HICOM. The company focuses on manufacturing armoured vehicles and specialised logistics vehicles. The company has supplied ACV-15 infantry fighting vehicles to the Malaysian Army in the past and is currently supplying the DefTech AV8 amphibious multirole armoured vehicle to the Malaysian Army.

The sea sector of the defence industry is dominated by Boustead Heavy Industries, who builds warships for the Royal Malaysian Navy (RMN) through transfer of technology with foreign companies. The company has built 4 Kedah-class offshore patrol vessels for the RMN in the past and is currently undertaking a project to build 6 more Second Generation Patrol Vessels for the RMN.

Services sector

Finance and banking

Headquarters of Maybank, Malaysia's largest bank Maybank Tower Kuala Lumpur.jpg
Headquarters of Maybank, Malaysia's largest bank

Kuala Lumpur has a large financial sector, and is ranked the 22nd in the world in the Global Financial Centres Index. [110] There are currently 27 commercial banks (8 domestic and 19 foreign), 16 Islamic banks (10 domestic and 6 foreign), 15 investment banks (all domestic) and 2 other financial institutions (both domestic) operating in Malaysia.

Commercial banks are the largest and most significant providers of funds in the banking system. The biggest banks in Malaysia's finance sector are Maybank, CIMB, Public Bank Berhad, RHB Bank and AmBank.

Malaysia is currently also the world's largest centre of Islamic Finance. Malaysia has 16 fully-fledged Islamic banks including five foreign ones, with total Islamic bank assets of US$168.4 billion, which accounts for 25% of the Malaysia's total banking assets. [111] This in turn accounts for over 10% of the world's total Islamic banking assets. In comparison, Malaysia's main rival UAE, has US$95 billion of assets. [112]

Malaysia is the global leader in terms of the sukuk (Islamic bond) market, issuing RM62 billion (US$17.74 billion) [113] worth of sukuk in 2014 - over 66.7% [114] of the global total of US$26.6 billion [111] [115] Malaysia also accounts for around two-thirds of the global outstanding sukuk market, controlling $178 billion of $290 billion, the global total. [116]

The Malaysian government is planning to transform the country's capital Kuala Lumpur into a major financial centre in a bid to raise its profile and spark greater international trade and investment through the construction of the Tun Razak Exchange (TRX). The government believes the project will allow Malaysia to compete with regional financial superpowers such as Singapore and Hong Kong, by leveraging on the country's established strength in the rapidly growing Islamic financial marketplace. [111]

Based in Kuala Lumpur, Bursa Malaysia serves as the country's sole national stock exchange. Trading of shares started in 1960 and it is today one of the largest bourses in Southeast Asia. [117] [118]

Tourism

South Beach at Perhentian Besar SouthBeach Curve.JPG
South Beach at Perhentian Besar

Tourism is a huge sector of the Malaysian economy, with over 57.1 million domestic tourists generating RM37.4 billion (US$11 billion) in tourist receipts in 2014, [119] and attracting 27,437,315 international tourist arrivals, [120] a growth of 6.7% compared to 2013. Total international tourist receipts increased by 3.9% to RM60.6 billion (US$19 billion) in 2014. [121]

United Nations World Tourism Organisation (UNWTO) listed Malaysia as the 10th most visited country in 2012. [122]

Malaysia is rich with diverse natural attractions which become an asset to the country's tourism industry. This was recognised by the World Travel & Tourism Council (WTTC), who declared Malaysia as "a destination full of unrealized potential" with the main strength as the availability of a vast range of diverse attractions to suit all tastes relatively affordable prices and; largely unspoilt destination. [123]

Malaysia's top tourist destinations are the Mulu Caves, Perhentian Islands, Langkawi, Petronas Towers and Mount Kinabalu. [124]

Medical tourism

Tuaran Hospital in Sabah Tuaran Sabah Malaysia Tuaran-Hospital-06.jpg
Tuaran Hospital in Sabah

Medical tourism is a significant sector of Malaysia's economy, with an estimated 1 million travelling to Malaysia specifically for medical treatments alone in 2014, contributing around US$200 million (about RM697 mil) in revenue to the economy. [125]

Malaysia is reputed as one of the most preferred medical tourism destinations with modern private healthcare facilities and highly efficient medical professionals. [126] In 2014, Malaysia was ranked the world's best destination for medical tourism by the Nomad Capitalist. [127] Malaysia was also included in the top 10 medical tourism destinations list by CNBC. [128]

In 2014, Prince Court Medical Centre, a Malaysian hospital, was ranked the world's best hospital for medical tourists by MTQUA. [129]

The Malaysian government targets to hit RM 9.6 billion (US$3.2 billion) in revenue from 1.9 million foreign patients by 2020. [126]

Oil and gas

Petronas petrol station in Thailand E8664-Pattaya-Sukhumvit-Road.jpg
Petronas petrol station in Thailand

Malaysia has a vibrant oil and gas industry. The national oil company, Petronas is ranked the 69th biggest company in the world in the Fortune 500 list in 2014, with a revenue of over US100.7 billion and total assets of over US$169 billion. Petronas provides around 30% of the Malaysian government's revenue, although the government has been actively cutting down on its reliance of petroleum, with a target of 20%. [130]

Petronas is also the custodian of oil and gas reserves for Malaysia. Hence, all oil and gas activities are regulated by Petronas. Malaysia encourages foreign oil company participation through production sharing contracts, in which significant amount of oil will be given away to the foreign oil company until it reaches a production milestone. Currently, many major oil companies such as ExxonMobil, Royal Dutch Shell, Nippon Oil, and Murphy Oil are involved in such contracts. [131] As a result, 40% of oil fields in Malaysia are developed. [132]

There are over 3,500 oil and gas (O&G) businesses in Malaysia comprising international oil companies, independents, services and manufacturing companies that support the needs of the O&G value chain both domestically and regionally. Many major global machinery & equipment (M&E) manufacturers have set up bases in Malaysia to complement home-grown M&E companies, while other Malaysian oil and gas companies are focused on key strategic segments such as marine, drilling, engineering, fabrication, offshore installation and operations and maintenance (O&M).

Infrastructure

The infrastructure of Malaysia is one of the most developed in Asia. [133] [134] Its telecommunications network is second only to Singapore's in Southeast Asia, with 4.7 million fixed-line subscribers and more than 30 million cellular subscribers.(2011) [135] [136] The country has seven international ports, the major one being the Port Klang. There are 200 industrial parks along with specialised parks such as Technology Park Malaysia and Kulim Hi-Tech Park. [99] Fresh water is available to over 95 per cent of the population. During the colonial period, development was mainly concentrated in economically powerful cities and in areas forming security concerns. Although rural areas have been the focus of great development, they still lag behind areas such as those in the west coast of Peninsular Malaysia. [137] The telecommunication network, although strong in urban areas, is less available to the rural population. [135]

Energy

Bakun Dam under construction in 2009 BakunDam.jpg
Bakun Dam under construction in 2009

Malaysia's energy infrastructure sector is largely dominated by Tenaga Nasional, the largest electric utility company in Southeast Asia, with over RM99.03 billion of assets. Customers are connected to electricity through the National Grid, with more than 420 transmission substations in the Peninsular linked together by approximately 11,000 km [138] of transmission lines operating at 132, 275 and 500 kilovolts.

In 2013, Malaysia's total power generation capacity was over 29,728 megawatts. Total electricity generation was 140,985.01 GWh and total electricity consumption was 116,087.51 GWh. [139]

Energy production in Malaysia is largely based on oil and natural gas, owing to Malaysia's oil reserves and natural gas reserves, which is the fourth largest in Asia-Pacific after China, India and Vietnam. [140]

Malaysia has also significant renewable energy resources and has high potential for the development of large-scale solar power and it has one of the most advanced legal frameworks in the ASEAN region for promoting renewables. [141] The country set a 20% target of renewable energy in its energy mix by 2025 and to achieve this the government will need to improve its renewable energy governance, investment policy and market entry for foreign investors as well to develop a framework for easier grid connection and use. [141] As of 2021, Malaysia is one of the major producers of solar panels for the international market, but paradoxically it has yet to fully capitalize on this for domestic electricity generation. [142]

Transport network

Road network

The North-South Expressway, the longest highway in Malaysia NorthSouth-Expressway.jpg
The North–South Expressway, the longest highway in Malaysia

Malaysia's road network is one of the most comprehensive in Asia and covers a total of 144,403 kilometres (89,728 mi).

The main national road network is the Malaysian Federal Roads System, which span over 49,935 km (31,028 mi). Most of the federal roads in Malaysia are 2-lane roads. In town areas, federal roads may become 4-lane roads to increase traffic capacity. Nearly all federal roads are paved with tarmac except parts of the Skudai–Pontian Highway which is paved with concrete, while parts of the Federal Highway linking Klang to Kuala Lumpur, is paved with asphalt.

Malaysia has over 1,798 kilometres (1,117 mi) of highways and the longest highway, the North–South Expressway, extends over 800 kilometres (497 mi) on the West Coast of Peninsular Malaysia, connecting major urban centres like Kuala Lumpur and Johor Bahru. In 2015, the government announced a RM27 billion (US$8.23 billion) Pan-Borneo Highway project to upgrade all trunk roads to dual carriage expressways, bringing the standard of East Malaysian highways to the same level of quality of Peninsular highways. [143] [144]

Rail network

There are currently 1,833 kilometres (1,139 mi) of railways in Malaysia, 767 km (477 mi) are double tracked and electrified.

Rail transport in Malaysia comprises heavy rail (KTM), light rapid transit and monorail (Rapid Rail), and a funicular railway line (Penang Hill Railway). Heavy rail is mostly used for intercity passenger and freight transport as well as some urban public transport, while LRTs are used for intra-city urban public transport. There two commuter rail services linking Kuala Lumpur with the Kuala Lumpur International Airport. The sole monorail line in the country is also used for public transport in Kuala Lumpur, while the only funicular railway line is in Penang. A rapid transit project, the KVMRT, is currently under construction to improve Kuala Lumpur's public transport system.

The railway network covers most of the 11 states in Peninsular Malaysia. In East Malaysia, only the state of Sabah has railways. The network is also connected to the Thai railway 1,000 mm (3 ft 3+38 in) network in the north. If the Burma Railway is rebuilt, services to Myanmar, India, and China could be initiated.

Air network

Kuala Lumpur International Airport KLIA MTB&Tower.jpg
Kuala Lumpur International Airport

Malaysia has 118 airports, of which 38 are paved. The national airline is Malaysia Airlines, providing international and domestic air services. Major international routes and domestic routes crossing between West Malaysia and East Malaysia are served by Malaysia Airlines, AirAsia and Malindo Air while smaller domestic routes are supplemented by smaller airlines like MASwings, Firefly and Berjaya Air. Major cargo airlines include MASkargo and Transmile Air Services.

Kuala Lumpur International Airport is the main and busiest airport of Malaysia. In 2014, it was the world's 13th busiest airport by international passenger traffic, recording over 25.4 million international passenger traffic. It was also the world's 20th busiest airport by passenger traffic, recording over 48.9 million passengers.

Other major airports include Kota Kinabalu International Airport, which is also Malaysia's second busiest airport and busiest airport in East Malaysia with over 6.9 million passengers in 2013, and Penang International Airport, with over 5.4 million passengers in 2013.

Sea network

Port Klang Northport Malaysia Wharve.JPG
Port Klang

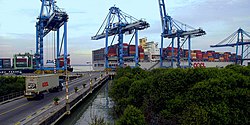
Malaysia is strategically located on the Strait of Malacca, one of the most important shipping lanes in the world.

Malaysia has two ports that are listed in the top 20 busiest ports in the world, Port Klang and Port of Tanjung Pelepas, which are respectively the 2nd and 3rd busiest ports in Southeast Asia after the Port of Singapore.

Port Klang is Malaysia's busiest port, and the 13th busiest port in the world in 2013, handling over 10.3 million TEUs. Port of Tanjung Pelepas is Malaysia's second busiest port, and the 19th busiest port in the world in 2013, handling over 7.6 million TEUs.

Free trade efforts

International trade agreements

EconomyAgreementAbbreviationConcludedSignedEffectiveLegal

Text

Flag of Japan.svg  Japan Malaysia–Japan Economic Partnership AgreementMJEPA13 December 200513 December 200513 July 2006
Flag of Pakistan.svg  Pakistan Malaysia–Pakistan Closer Economic Partnership AgreementMPCEPA8 November 20078 November 20071 January 2008
Flag of New Zealand.svg  New Zealand Malaysia–New Zealand Free Trade AgreementtMNZFTA30 May 200926 October 20091 August 2010
Flag of India.svg  India Malaysia–India Comprehensive Economic Cooperation AgreementMICECA18 February 20111 July 2011
Flag of Chile.svg  Chile Malaysia–Chile Free Trade AgreementMCFTAMay 201013 November 201025 February 2012
Flag of Australia (converted).svg  Australia Malaysia–Australia Free Trade AgreementMAFTA30 March 20121 January 2013
Flag of Turkey.svg  Turkey Malaysia–Turkey Free Trade AgreementMTFTA15 January 201417 April 20141 August 2015
Flag of the People's Republic of China.svg  China ASEAN–China Free Trade Agreement ACFTANovember 20021 January 2010
Flag of Japan.svg  Japan ASEAN–Japan Comprehensive Economic Partnership AgreementAJCEP14 April 20081 February 2009
Flag of South Korea.svg  South Korea ASEAN–Korea Free Trade AgreementAKFTA1 January 2010
Flag of India.svg  India ASEAN–India Free Trade AgreementAIFTA13 August 20091 January 2010
Flag of Australia (converted).svg  Australia
Flag of New Zealand.svg  New Zealand
ASEAN–Australia-New Zealand Free Trade Area AgreementAANZFTA27 February 20091 January 2010
Flag of Hong Kong.svg  Hong Kong ASEAN–Hong Kong, China Free Trade AgreementAHKFTA12 November 201713 October 2019
Infobox ASEAN flag.svg  ASEAN
Flag of the People's Republic of China.svg  China
Flag of Japan.svg  Japan
Flag of South Korea.svg  South Korea
Flag of Australia (converted).svg  Australia
Flag of New Zealand.svg  New Zealand
Regional Comprehensive Economic Partnership RCEP15 November 202018 March 2022

Trade agreements under negotiation

Investments

Malaysia's total accumulated investments in 2014 was RM235.9 billion, with 72.6 per cent (RM171.3 billion) being contributed by domestic sources and 27.4 per cent (RM64.6 billion) coming from foreign sources. [146]

According to A.T. Kearney, a global management consulting firm, Malaysia was ranked 15th in the 2014 Foreign Direct Investment Confidence Index, 9th in 2012, 16th in 2007 and 21st in 2010. The index assesses the impact of political, economic and regulatory changes on the FDI intentions and preferences of the leaders of top companies around the world. [147] [148]

Rank
2007
Rank
2010
Rank
2012
Rank
2014
CountryFDI Confidence
Index
3241Flag of the United States.svg  United States 2.16
1112Flag of the People's Republic of China.svg  China 1.95
9203Flag of Canada (Pantone).svg  Canada 1.93
41084Flag of the United Kingdom.svg  United Kingdom 1.91
6435Flag of Brazil.svg  Brazil 1.91
10556Flag of Germany.svg  Germany 1.84
5327Flag of India.svg  India 1.81
11768Flag of Australia (converted).svg  Australia 1.76
72479Flag of Singapore.svg  Singapore 1.75
8131710Flag of France.svg  France 1.74
20111511Flag of the United Arab Emirates.svg  United Arab Emirates 1.74
19812Flag of Mexico.svg  Mexico 1.72
181113Flag of South Africa.svg  South Africa 1.70
2214Flag of Switzerland (Pantone).svg   Switzerland 1.68
16211015Flag of Malaysia.svg  Malaysia 1.65
16Flag of Sweden.svg  Sweden 1.64
17Flag of Chile.svg  Chile 1.64
-2418Flag of Spain.svg  Spain 1.63
2119Flag of Japan.svg  Japan 1.62
20Flag of Italy.svg  Italy 1.61
121621Flag of Belgium (civil).svg  Belgium 1.61
662322Flag of the Netherlands.svg  Netherlands 1.61
1823Flag of Denmark.svg  Denmark 1.61
131924Flag of Turkey.svg  Turkey 1.60
18231325Flag of Indonesia.svg  Indonesia 1.60

Largest public Malaysian companies

Fortune Global 500

Malaysia has 1 company that rank in the Fortune Global 500 ranking for 2022. [149]

World RankCompanyIndustrySales ($M)Profits ($M)Assets ($M)Employees
216 Petronas Oil and gas 59,87310,091152,49846,884

Forbes Global 2000

Malaysia has 8 companies that rank in the Forbes Global 2000 ranking for 2022. [150]

World rankCompanyIndustrySales
(billion $)
Profits
(billion $)
Assets
(billion $)
Market value
(billion $)
485 Maybank Banking9.22.0213.224.7
837 Tenaga Nasional Utilities12.70.88343.811.8
751 Public Bank Berhad Banking4.51.4111.121.2
895 CIMB Group HoldingsBanking5.71.0149.312.2
1525 RHB Capital Banking2.60.63169.55.7
1641 Hong Leong Financial GroupBusiness services & supplies1.90.56766.75.1
1448 Top Glove Health care equipment & services3.61.63.110.8
1236 Petronas Chemicals Chemicals5.61.811.519.1

See also

Notes

    Related Research Articles

    <span class="mw-page-title-main">Economy of Canada</span>

    The economy of Canada is a highly developed mixed economy, with the world's tenth-largest economy as of 2023, and a nominal GDP of approximately US$2.117 trillion. Canada is one of the world's largest trading nations, with a highly globalized economy. In 2021, Canadian trade in goods and services reached $2.016 trillion. Canada's exports totalled over $637 billion, while its imported goods were worth over $631 billion, of which approximately $391 billion originated from the United States. In 2018, Canada had a trade deficit in goods of $22 billion and a trade deficit in services of $25 billion. The Toronto Stock Exchange is the tenth-largest stock exchange in the world by market capitalization, listing over 1,500 companies with a combined market capitalization of over US$3 trillion.

    <span class="mw-page-title-main">Economy of Chile</span>

    The economy of Chile is a market economy and high-income economy as ranked by the World Bank. The country is considered one of South America's most prosperous nations, leading the region in competitiveness, income per capita, globalization, economic freedom, and low perception of corruption. Although Chile has high economic inequality, as measured by the Gini index, it is close to the regional mean.

    <span class="mw-page-title-main">Economy of Ecuador</span>

    The economy of Ecuador is the eighth largest in Latin America and the 69th largest in the world by total GDP. Ecuador's economy is based on the export of oil, bananas, shrimp, gold, other primary agricultural products and money transfers from Ecuadorian emigrants employed abroad. In 2017, remittances constituted 2.7% of Ecuador's GDP. The total trade amounted to 42% of the Ecuador's GDP in 2017.

    <span class="mw-page-title-main">Economy of Ethiopia</span>

    The economy of Ethiopia is a mixed and transition economy with a large public sector. The government of Ethiopia is in the process of privatizing many of the state-owned businesses and moving toward a market economy. The banking, telecommunication and transportation sectors of the economy are dominated by government-owned companies.

    <span class="mw-page-title-main">Economy of Indonesia</span>

    The economy of Indonesia is a mixed economy with dirigiste characteristics, and it is one of the emerging market economies in the world and the largest in Southeast Asia. As an upper-middle income country and member of the G20, Indonesia is classified as a newly industrialized country. Estimated at over 21 quadrillion rupiah in 2023, it is the 16th largest economy in the world by nominal GDP and the 7th largest in terms of GDP (PPP). Indonesia's internet economy reached US$77 billion in 2022, and is expected to cross the US$130 billion mark by 2025. Indonesia depends on the domestic market and government budget spending and its ownership of state-owned enterprises. The administration of prices of a range of basic goods also plays a significant role in Indonesia's market economy. However, since the 1990s, the majority of the economy has been controlled by individual Indonesians and foreign companies.

    <span class="mw-page-title-main">Economy of Kazakhstan</span>

    The economy of Kazakhstan is the largest in Central Asia in both absolute and per capita terms. In 2021, Kazakhstan attracted more than US$370 billion of foreign investments since becoming an independent republic after the collapse of the former Soviet Union.

    <span class="mw-page-title-main">Economy of Morocco</span>

    The economy of Morocco is considered a relatively liberal economy, governed by the law of supply and demand. Since 1993, in line with many Western world changes, Morocco has followed a policy of privatisation of certain economic sectors which used to be in the hands of the government. Morocco has become a major player in African economic affairs, and is the 5th largest African economy by GDP (PPP). The World Economic Forum placed Morocco as the most competitive economy in North Africa, in its African Competitiveness Report 2014–2015.

    <span class="mw-page-title-main">Economy of Syria</span>

    Syria's economic situation has been turbulent and their economy has deteriorated considerably since the beginning of the Syrian civil war, which erupted in March 2011.

    <span class="mw-page-title-main">Economy of Thailand</span>

    The economy of Thailand is dependent on exports, which accounted in 2021 for about 58 per cent of the country's gross domestic product (GDP). Thailand itself is a newly industrialized country, with a GDP of 17.367 trillion baht (US$495 billion) in 2022, the 9th largest economy in Asia. As of 2018, Thailand has an average inflation of 1.06% and an account surplus of 7.5% of the country's GDP. Its currency, the Thai Baht, ranked as the tenth most frequently used world payment currency in 2017.

    <span class="mw-page-title-main">Economy of Trinidad and Tobago</span>

    The economy of Trinidad and Tobago is the third wealthiest in the Caribbean and the fifth-richest by GDP (PPP) per capita in the Americas. Trinidad and Tobago is recognised as a high-income economy by the World Bank. Unlike most of the English-speaking Caribbean, the country's economy is primarily industrial, with an emphasis on petroleum and petrochemicals. The country's wealth is attributed to its large reserves and exploitation of oil and natural gas.

    <span class="mw-page-title-main">Economy of Ukraine</span>

    The economy of Ukraine is an emerging, lower-middle income, mixed economy located in Eastern Europe. It grew rapidly from 2000 until 2008 when the Great Recession began worldwide and reached Ukraine. The economy recovered in 2010 and continued improving until 2013. From 2014 to 2015, the Ukrainian economy suffered a severe downturn, with GDP in 2015 being slightly above half of its value in 2013. In 2016, the economy again started to grow. By 2018, the Ukrainian economy was growing rapidly, and reached almost 80% of its size in 2008.

    <span class="mw-page-title-main">Economy of Vietnam</span>

    The economy of Vietnam is a developing mixed socialist-oriented market economy incorporating industrial policies and strategic five-year plans, which is the 35th-largest in the world as measured by nominal gross domestic product (GDP) and 26th-largest in the world as measured by purchasing power parity (PPP) in 2022. It is a lower-middle income country with a low cost of living. Vietnam is a member of the Asia-Pacific Economic Cooperation, the Association of Southeast Asian Nations and the World Trade Organization.

    <span class="mw-page-title-main">Economy of Tunisia</span>

    The economy of Tunisia is in the process of being liberalized after decades of heavy state direction and participation in the country's economy. Prudent economic and fiscal planning has resulted in moderate but sustained growth for over a decade. Tunisia's economic growth historically has depended on oil, phosphates, agri-food products, car parts manufacturing, and tourism. In the World Economic Forum Global Competitiveness Report for 2015–2016, Tunisia ranks in 92nd place.

    <span class="mw-page-title-main">Economy of Mozambique</span>

    The economy of Mozambique is $14.396 billion by gross domestic product as of 2018, and has developed since the end of the Mozambican Civil War (1977–1992). In 1987, the government embarked on a series of macroeconomic reforms, which were designed to stabilize the economy. These steps, combined with donor assistance and with political stability since the multi-party elections in 1994, have led to dramatic improvements in the country's growth rate. Inflation was brought to single digits during the late 1990s, although it returned to double digits in 2000–02. Fiscal reforms, including the introduction of a value-added tax and reform of the customs service, have improved the government's revenue collection abilities.

    <span class="mw-page-title-main">Economy of Iran</span>

    Iran is a mixed economy with a large public sector. Some 60% of Iran's economy is centrally planned.. Iran's economy is characterized by its hydrocarbon, agricultural, and service sectors, in addition to manufacturing and financial services, with over 40 industries are directly involved in the Tehran Stock Exchange. The stock exchange has been one of the best performing exchanges in the world over the past decade. With 10% of the world's proven oil reserves and 15% of its gas reserves, Iran is considered an "energy superpower".

    <span class="mw-page-title-main">Economy of Bolivia</span>

    The economy of Bolivia is the 95th-largest in the world in nominal terms and the 87th-largest in purchasing power parity. Bolivia is classified by the World Bank to be a lower middle income country. With a Human Development Index of 0.703, it is ranked 114th. Driven largely by its natural resources, Bolivia has become a region leader in measures of economic growth, fiscal stability and foreign reserves, although it remains a historically poor country. The Bolivian economy has had a historic single-commodity focus. From silver to tin to coca, Bolivia has enjoyed only occasional periods of economic diversification. Political instability and difficult topography have constrained efforts to modernize the agricultural sector. Similarly, relatively low population growth coupled with low life expectancy has kept the labor supply in flux and prevented industries from flourishing. Rampant inflation and corruption previously created development challenges, but in the early twenty-first century the fundamentals of its economy showed unexpected improvement, leading Moody's Investors Service to upgrade Bolivia's economic rating in 2010 from B2 to B1. The mining industry, especially the extraction of natural gas and zinc, currently dominates Bolivia's export economy.

    <span class="mw-page-title-main">1997 Asian financial crisis</span> Financial crisis of many Asian countries during the second half of 1997

    The 1997 Asian financial crisis was a period of financial crisis that gripped much of East and Southeast Asia during the late 1990s. The crisis began in Thailand in July 1997 before spreading to several other countries with a ripple effect, raising fears of a worldwide economic meltdown due to financial contagion. However, the recovery in 1998–1999 was rapid, and worries of a meltdown quickly subsided.

    <span class="mw-page-title-main">Economy of Asia</span>

    The economy of Asia comprises about 4.7 billion people living in 50 different nations. Asia is the fastest growing economic region, as well as the largest continental economy by both GDP Nominal and PPP in the world. Moreover, Asia is the site of some of the world's longest modern economic booms.

    <span class="mw-page-title-main">Economy of Algeria</span>

    Algeria's economy continued to recover in the first half of 2022, led by a return of oil production to pre-pandemic levels and a continued recovery of the service sector along with a more vigorous agricultural activity. The recovery should continue into 2023, supported by the nonhydrocarbon sector and public expenditure growth, according to the latest edition of the World Bank's Algeria Economic Update.

    <span class="mw-page-title-main">Economic history of Malaysia</span>

    Since its formation in 1963, Malaysia's economic performance has been one of Asia's best. Real gross domestic product (GDP) grew by an average of 6.5% per year from 1957 to 2005. Performance peaked in the early 1980s through the mid-1990s, as the economy experienced sustained rapid growth averaging almost 8% annually. Malaysia's economy was greatly impacted by the 1997 Asian financial crisis, but recovered.

    References

    1. "World Economic Outlook Database, April 2019". IMF.org. International Monetary Fund . Retrieved 29 September 2019.
    2. "World Bank Country and Lending Groups". datahelpdesk.worldbank.org. World Bank. Archived from the original on 21 August 2016. Retrieved 29 September 2019.
    3. "Population, total - Malaysia" . Retrieved 21 November 2023.
    4. 1 2 3 4 5 6 7 8 9 "World Economic Outlook Database, October 2023". IMF.org. International Monetary Fund . Retrieved 21 November 2023.
    5. 1 2 "WORLD ECONOMIC OUTLOOK 2022 OCT Countering the Cost-of-Living Crisis". www.imf.org. International Monetary Fund. p. 43. Retrieved 11 October 2022.
    6. "CIA World Factbook" . Retrieved 23 March 2022.
    7. "Poverty headcount ratio at $5.50 a day (2011 PPP) (% of population) - Malaysia". data.worldbank.org. World Bank . Retrieved 3 October 2019.
    8. "GINI index (World Bank estimate)". data.worldbank.org. World Bank . Retrieved 16 May 2023.
    9. "Human Development Index (HDI)". hdr.undp.org. HDRO (Human Development Report Office) United Nations Development Programme . Retrieved 5 November 2022.
    10. "Inequality-adjusted Human Development Index (IHDI)". hdr.undp.org. HDRO (Human Development Report Office) United Nations Development Programme. Archived from the original on 12 December 2020. Retrieved 5 November 2022.
    11. "Labor force, total - Malaysia". data.worldbank.org. World Bank . Retrieved 4 November 2019.
    12. "Employment to population ratio, 15+, total (%) (national estimate) - Malaysia". data.worldbank.org. World Bank . Retrieved 3 October 2019.
    13. 1 2 3 4 "The World Factbook". CIA.gov. Central Intelligence Agency . Retrieved 18 March 2019.
    14. "Trade Performance 2021". Malaysia External Trade Development Corporation. Archived from the original on 15 May 2022. Retrieved 2 June 2021.
    15. 1 2 "OEC - Malaysia trade" . Retrieved 27 December 2022.
    16. "OEC - Malaysia (MYS) Exports, Imports, and Trade Partners". atlas.media.mit.edu. Archived from the original on 24 March 2019. Retrieved 24 March 2019.
    17. "Malaysia's FDI". news.cn. Xinhua. Retrieved 16 February 2024.
    18. "S&P revises Malaysia's outlook to stable from negative, expects 2022 GDP growth to hit 6.1%" . Retrieved 16 May 2023.
    19. "Moody's Affirms Malaysia's Sovereign Credit Rating At 'A3'; Outlook Stable". 14 April 2023. Retrieved 16 May 2023.
    20. "Malaysia" . Retrieved 16 May 2023.
    21. "BNM: Malaysia's international reserves at US$110.1b at Sept 29, 2023". 6 October 2023. Retrieved 6 October 2023.
    22. "Report for Selected Countries and Subjects". IMF. Retrieved 18 May 2022.
    23. "Regional Study on Labour Productivity in ASEAN" (PDF). The ASEAN Secretariat & Asian Productivity Organization. Retrieved 9 January 2022.
    24. "The Global Competitiveness Report 2021". IMD World Competitiveness Center. Retrieved 9 June 2022.
    25. Boulton, WilliaM; Pecht, Michael; Tucker, William; Wennberg, Sam (May 1997). "Electronics Manufacturing in the Pacific Rim, World Technology Evaluation Center, Chapter 4: Malaysia". Wtec.org. Retrieved 1 November 2010.
    26. "Malaysia, A Statist Economy". Infernalramblings.com. Archived from the original on 7 October 2010. Retrieved 1 November 2010.
    27. "High-technology exports (current US$) - Singapore, Malaysia, Thailand, Indonesia | Data". data.worldbank.org.
    28. "OEC - Palm Oil (HS92: 1511) Product Trade, Exporters and Importers". Archived from the original on 30 August 2017. Retrieved 19 August 2017.
    29. The Prime Minister's Office. The Security of the Straits of Malacca and its implications to the Southeast Asia regional security. Retrieved 26 November 2007. Archived 5 April 2008 at the Wayback Machine
    30. American University. Tin Mining in Malaysia. Retrieved 14 November 2007. Archived 7 August 2014 at the Wayback Machine
    31. Bank Negara. BNM National Summary Data Page Archived 6 February 2010 at the Wayback Machine . Retrieved 8 November 2007
    32. Mahathir Bin Mohamad (17 November 2008). "The Way Forward". Prime Minister's Office. Archived from the original on 3 December 2008. Retrieved 12 April 2013.
    33. Malaysia may be developed nation by 2018, says minister Archived 11 April 2013 at archive.today
    34. "The World Factbook" . Retrieved 3 March 2015.
    35. Paweł Bożyk (2006). "Newly Industrialized Countries". Globalization and the Transformation of Foreign Economic Policy. Ashgate Publishing, Ltd. p. 164. ISBN   0-7546-4638-6.
    36. N. Gregory Mankiw (2007). Principles of Economics (4th ed.). Cengage Learning. ISBN   978-0-324-22472-6.
    37. "COUNTRY COMPARISON :: GDP (PURCHASING POWER PARITY)". CIA. Archived from the original on 4 June 2011. Retrieved 26 October 2010.
    38. Wong Wei-Shen (7 May 2012). "Malaysia got what it takes to be developed nation". The Star. Archived from the original on 8 May 2012. Retrieved 25 June 2013.
    39. "22-07-2005: Ringgit depeg not likely to have immediate impact on sovereign, banks, corporates". The Edge. Archived from the original on 18 March 2015. Retrieved 10 March 2008.
    40. Liau Y-Sing (19 March 2007). "Malaysia says offshore ringgit trade not needed". Reuters.
    41. "EPU:New Economic Policy". Economic Planning Unit, Prime Ministers Department Malaysia. Archived from the original on 28 August 2008. Retrieved 28 July 2008.
    42. "Jabatan Penerangan Rakyat: Dasar Ekonomy Baru" (in Malay). Ministry of Information Malaysia. Archived from the original on 23 June 2008. Retrieved 28 July 2008.
    43. Jomo K.S. (1 September 2004). "The New Economic Policy and Interethnic Relations in Malaysia". United Nations Research Institute for Social Development. Archived from the original on 22 October 2008. Retrieved 28 July 2008.
    44. Thomas Fuller (5 January 2001). "Criticism of 30-Year-Old Affirmative-Action Policy Grows in Malaysia". Archived from the original on 14 March 2008. Retrieved 7 March 2008.
    45. Anwar Ibrahim. "A Malaysian Economic Agenda" (PDF). Parti Keadilan Rakyat. Archived from the original (PDF) on 8 September 2008. Retrieved 28 July 2008.
    46. Niluksi Koswanage (11 March 2008). "Malaysia opposition takes aim at affirmative action". Reuters.
    47. "Bumi proviso removed to rope in more investments, says Najib". The Star. 22 April 2009. Archived from the original on 24 April 2009. Retrieved 23 April 2009.
    48. "Foreign ownership in stockbroking firms raised to 70pc". New Straits Times. Bernama. 30 June 2009.[ dead link ]
    49. "Malaysia 2007 fuel subsidies at RM40b: PM". Archived from the original on 12 January 2009.
    50. Economic numbers bode well for M'sia. Business Times. 22 September 2009
    51. "Prices for RON95 and diesel to be determined by float system - Nation | The Star Online". thestar.com.my. Retrieved 24 August 2017.
    52. "Establishment Post". Archived from the original on 6 April 2015. Retrieved 4 April 2015.
    53. "The Star" . Retrieved 4 April 2015.
    54. "Sovereign Wealth Fund Acquisitions and Other Foreign Government Investments in the United States: Assessing the Economic and National Security Implications" (PDF). Archived from the original (PDF) on 8 April 2008. Retrieved 16 March 2008.
    55. "Khazanah Nasional" (PDF). Archived from the original (PDF) on 9 April 2015. Retrieved 4 April 2015.
    56. "EPF asset size swells to RM597bil, boosted by strong stock market performance" . Retrieved 24 September 2014.
    57. "TowersWatson" . Retrieved 4 April 2015.
    58. "EPF to double overseas investments". Business Times. Archived from the original on 12 March 2008.
    59. "EPF's Investment Income Increases To RM3.6 Billion in Q2". Kumpulan Wang Simpanan Pekerja. Archived from the original on 8 May 2012.
    60. "Eligibility to Invest". Amanah Saham Nasional Berhad. Archived from the original on 15 April 2008. Retrieved 9 June 2008.
    61. 1 2 Asan Ali Golam (2004). "Growth, Structural Change, and Regional Inequality in Malaysia". Ashgate. p. 67. ISBN   9780754643326.
    62. "Investment in Malaysia". Innovasjon Norge. Archived from the original on 2 January 2011.
    63. "Report for Selected Countries and Subjects".
    64. "XE: Convert USD/MYR. United States Dollar to Malaysia Ringgit". xe.com. Retrieved 16 January 2020.
    65. Ethan Kaplan; Dani Rodrik. "Did the Malaysia Capital Controls Work?" (PDF). Archived from the original (PDF) on 13 October 2009.
    66. "Malaysia's Economic Growth Moderating But Improvement in Second Half Expected" (PDF). Asian Strategy & Leadership Institute. Archived from the original (PDF) on 8 April 2008. Retrieved 20 March 2008.
    67. "Malaysia may liberalize ringgit if forex market 'vibrant'". Reuters. Archived from the original on 20 September 2007. Retrieved 21 March 2008.
    68. Rupe Damodaron (13 September 2010). "All eyes on ringgit after PM's remarks". Business Times Malaysia. Archived from the original on 16 September 2010.
    69. 1 2 "Malaysia". State.gov. 14 July 2010. Retrieved 14 September 2010.
    70. "ANZ Business". Archived from the original on 9 April 2015. Retrieved 4 April 2015.
    71. "Environment at a Glance 2004: Malaysia" (PDF). World Bank. Retrieved 31 July 2008.
    72. "TED Case Studies". Archived from the original on 7 April 2015. Retrieved 4 April 2015.
    73. USGS Manganese Production Statistics
    74. USGS Tin Production Statistics
    75. USGS Bauxite Production Statistics
    76. USGS Lime Production Statistics
    77. "EIA" . Retrieved 4 April 2015.
    78. "IMD competitiveness index". Archived from the original on 30 May 2015. Retrieved 28 May 2015.
    79. "Big jump in Malaysia's ranking for foreign investments - the Rakyat Post - the Rakyat Post". Archived from the original on 13 July 2015. Retrieved 13 July 2015.
    80. Permudah Background Archived 23 October 2008 at the Wayback Machine
    81. Permudah Highlights Archived 1 December 2008 at the Wayback Machine
    82. "Release of the Global Innovation Index 2020: Who Will Finance Innovation?". www.wipo.int. Retrieved 2 September 2021.
    83. "Global Innovation Index 2019". www.wipo.int. Retrieved 2 September 2021.
    84. "RTD - Item". ec.europa.eu. Retrieved 2 September 2021.
    85. "Global Innovation Index". INSEAD Knowledge. 28 October 2013. Archived from the original on 2 September 2021. Retrieved 2 September 2021.
    86. "Inland Revenue Board of Malaysia 2016 Taxation Rates" (PDF). Inland Revenue Board of Malaysia.[ permanent dead link ]
    87. "MySST". Archived from the original on 13 April 2019. Retrieved 13 April 2019.
    88. "Malaysia becomes China's 3rd largest trade partner in Asia - Business - Chinadaily.com.cn". www.chinadaily.com.cn.
    89. "China, Malaysia target 60b trade volume[1]- Chinadaily.com.cn". www.chinadaily.com.cn.
    90. "Speeches by Prime Minister Lee Hsien Loong and Malaysian Prime Minister Najib Tun Razak at the official dinner at the Istana on 22 May 2009". Archived from the original on 19 October 2014. Retrieved 26 October 2014.
    91. "Statistics Singapore - Trade with Major Trading Partners". Archived from the original on 21 October 2014. Retrieved 13 October 2014.
    92. "MalaysianInsider". Archived from the original on 10 April 2015. Retrieved 4 April 2015.
    93. "AgroJournal" (PDF). Retrieved 5 April 2015.
    94. Pakiam, Ranjeetha (3 January 2013). "Palm Oil Advances as Malaysia's Export Tax May Boost Shipments". Bloomberg. Retrieved 29 January 2013.
    95. "MPOB expects CPO production to increase to 19 million tonnes this year". The Star Online. 15 January 2013. Retrieved 29 January 2013.
    96. "MALAYSIA: Stagnating Palm Oil Yields Impede Growth". usda.gov. USDA Foreign Agricultural Service. 11 December 2012. Archived from the original on 18 February 2013. Retrieved 29 January 2013.
    97. May, Choo Yuen (September 2012). "Malaysia: economic transformation advances oil palm industry". aocs.org. American Oil Chemists' Society. Retrieved 29 January 2013.
    98. "Exclusive: EU risks 'trade war' with Malaysia over palm oil - Mahathir". Reuters. 29 March 2019. Retrieved 2 May 2019.
    99. 1 2 3 "MIDA". Archived from the original on 10 April 2015. Retrieved 5 April 2015.
    100. 1 2 3 Bradsher, Keith (12 December 2014). "NYTimes". The New York Times. Retrieved 25 July 2015.
    101. "Jinkosolar". Archived from the original on 25 July 2015. Retrieved 25 July 2015.
    102. "eximbank" (PDF). Archived from the original (PDF) on 4 September 2015. Retrieved 26 July 2015.
    103. "Ohio" . Retrieved 26 July 2015.
    104. "PV Tech". Archived from the original on 25 July 2015. Retrieved 25 July 2015.
    105. 1 2 "The Automotive Industry". mai.org.my. 20 May 2017. Archived from the original on 19 May 2017. Retrieved 20 May 2017.
    106. "Malaysia automotive association". Archived from the original on 29 March 2015. Retrieved 5 April 2015.
    107. "Astonishing facts". proton.com. 5 August 2007. Archived from the original on 5 August 2007. Retrieved 20 May 2017.
    108. Vaswani, Simran. "Malaysian Unicorn Carsome Raises $290 Million To Fund Southeast Asia Expansion Plans". Forbes. Retrieved 27 April 2022.
    109. 1 2 "Statistics". Archived from the original on 11 April 2015. Retrieved 5 April 2015.
    110. "GFCI" (PDF). Archived from the original (PDF) on 4 September 2015. Retrieved 5 April 2015.
    111. 1 2 3 "Theconversation". 11 November 2013. Retrieved 5 April 2015.
    112. "Theconversation". 18 September 2014. Retrieved 5 April 2015.
    113. "Institutional Investor". Archived from the original on 17 April 2015. Retrieved 11 April 2015.
    114. "The Star" . Retrieved 11 April 2015.
    115. "HomilyChart". Archived from the original on 16 October 2015. Retrieved 12 April 2015.
    116. "Moody's". 5 June 2014. Retrieved 11 April 2015.
    117. "Overview". www.bursamalaysia.com. Retrieved 30 March 2022.
    118. "Bursa Malaysia history". Archived from the original on 19 April 2007.
    119. "MalaysianInsider". Archived from the original on 23 March 2015. Retrieved 5 April 2015.
    120. "MALAYSIA TOURIST ARRIVALS BY COUNTRY OF NATIONALITY DECEMBER 2014" (PDF). Archived from the original (PDF) on 24 July 2015. Retrieved 9 January 2016.
    121. http://dtxtq4w60xqpw.cloudfront.net/sites/all/files/pdf/malaysia_country_report_2014.pdf%5B%5D
    122. "Malaysia is 10th most visited country - Nation | the Star Online". Archived from the original on 23 August 2013. Retrieved 5 April 2015.
    123. Suratman, Robiah. "Tourism Industry In Malaysia The Experience and Challenge".[ self-published source? ]
    124. "Tourupia" . Retrieved 5 April 2015.
    125. "The Star" . Retrieved 5 April 2015.
    126. 1 2 Wong, Kee Mun; Velasamy, Peramarajan; Tengku Arshad, Tengku Nuraina (2014). "Medical Tourism Destination SWOT Analysis: A Case Study of Malaysia, Thailand, Singapore and India". SHS Web of Conferences. 12: 01037. doi: 10.1051/shsconf/20141201037 .
    127. "NomadCapitalist". 5 January 2014. Retrieved 7 April 2015.
    128. "CNBC". CNBC . 14 March 2014. Retrieved 7 April 2015.
    129. "MTQUA". Archived from the original on 14 April 2015. Retrieved 7 April 2015.
    130. Ng, Jason (28 November 2014). "WSJ". Wall Street Journal. Retrieved 5 April 2015.
    131. Petronas. "Petronas Corporate Milestones 1974–2002". Archived from the original on 16 July 2011. Retrieved 28 June 2008.
    132. Malaysia Trade Mission to US (2005). "Oil and Gas opportunity in Malaysia". Archived from the original on 10 August 2007. Retrieved 27 June 2008.
    133. "Malaysia's economy to grow by 4-5% this year, central bank says – GE63". 2 April 2023. Retrieved 2 April 2023.
    134. "Why Malaysia". Malaysia Industrial Development Authority. Archived from the original on 23 July 2011. Retrieved 20 August 2011.
    135. 1 2 "Malaysian Telecommunications Overview". American University. Archived from the original on 4 May 2011. Retrieved 25 May 2011.
    136. "Telephones – mobile cellular". The World Factbook. Archived from the original on 16 November 2011. Retrieved 25 May 2011.
    137. "Infrastructure and Rural Development in Malaysia" (PDF). Centre on Integrated Rural Development for Asia and the Pacific. Archived from the original (PDF) on 14 May 2011. Retrieved 25 May 2011.
    138. "Tenaga Nasional Berhad 500kV Transmission System, Phase 1". Ranhill Berhad. Archived from the original on 27 February 2009. Retrieved 23 May 2009.
    139. "Energy Commission". Archived from the original on 9 May 2015. Retrieved 11 April 2015.
    140. Selamat, Salsuwanda; Abidin, Che Zulzikrami Azner. "Renewable Energy and Kyoto Protocol: Adoption in Malaysia". Universiti Malaysia Perlis. Archived from the original on 4 September 2013. Retrieved 15 October 2013.
    141. 1 2 Vakulchuk, Roman; Kresnawan, Muhammad Rizki; Merdekawati, Monika; Overland, Indra; Sagbakken, Haakon Fossum; Suryadi, Beni; Yurnaidi, Zulfikar (2020). "Malaysia: How to Scale Up Investment in Renewable Energy". ASEAN Centre for Energy. doi:10.13140/RG.2.2.32870.45124.
    142. Overland, Indra; Sagbakken, Haakon Fossum; Chan, Hoy-Yen; Merdekawati, Monika; Suryadi, Beni; Utama, Nuki Agya; Vakulchuk, Roman (December 2021). "The ASEAN climate and energy paradox". Energy and Climate Change. 2: 100019. doi: 10.1016/j.egycc.2020.100019 . hdl: 11250/2734506 .
    143. Mody, Ashoka (1997). Infrastructure strategies in East Asia: the untold story. The World Bank. p. 35. ISBN   0-8213-4027-1.
    144. Pim, Lim How (17 October 2014). "Fadillah says Pan Borneo Highway to be built under Ukas initiative". Borneo Post. Retrieved 19 October 2014.
    145. [European Free Trade Association - Malaysia], EFTA.int. Retrveied 29 January 2019.
    146. "MIDA". Archived from the original on 31 March 2015. Retrieved 4 April 2015.
    147. "2012 Top 25 Foreign Direct Investment (FDI) Confidence Index Countries". 1-million-dollar-blog. 8 December 2011. Retrieved 3 March 2015.
    148. "The 2023 Kearney Foreign Direct Investment Confidence Index: Cautious optimism". www.kearney.com. Retrieved 27 March 2024.
    149. "Fortune Global 500 List 2022: See Who Made It". Fortune. Retrieved 28 December 2022.
    150. "The Global 2000 2021". Forbes. Retrieved 22 March 2022.

    Further reading