$142.9billion (2015) (social security, 25.9%; income and capital gains, 23.6%; value-added sales tax, 20.1%; trade and duties, 15.1%; financial tax, 6.3%; excise and other, 9.0%)[20]
All values, unless otherwise stated, are in US dollars.
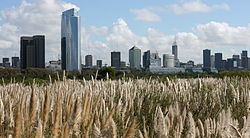
The economy of Argentina is South America's second-largest, behind Brazil. The United Nations' Human Development Index ranks Argentina "very high," reflecting a literate population, export-oriented agriculture, and diversified industry. Rich natural resources underpin the economy, although performance has been volatile – growth spurts alternate with recessions—especially since the late 20th century—driving income inequality and poverty. Early in that century, Argentina's per capita GDP ranked among the global top ten, matching Canada and Australia while exceeding France and Italy. The Argentine peso lost ~50% of its value in 2018 (falling from ~18–20 to >38 pesos per U.S. dollar), prompting an IMF stand-by program. It fell another 25% in 2019, 90% in 2020, 68% in 2021,[23] and 50% in 2022,[24] 54% in 2023, 30% in 2024, before rising in 2025.[25] The FTSE Global Equity Index (2018) listed Argentina as an emerging market and G20 member. Prolonged capital controls led MSCI to reclassify it as a standalone market in 2021.[26]
GNI per capita since 1961, adjusted for inequality.GDP per capita, 1880 to 2022.
Argentina's economy has swung from one of the world's richest in the early 20th century to repeated cycles of boom, bust, and hyperinflation, driven by commodity dependence, political instability, and policy shifts. Below is a summarized timeline based on historical data, with updates to 2025 reflecting recent reforms under Milei.
Pre-20th Century Foundations (Before 1880s)
Before the 1880s, Argentina's economy relied on salted meat, wool, leather, and hides for exports and income, with limited industrialization.
Golden age (1880–1940s)
Argentina was one of the wealthiest countries in the world[30]:
Argentina began the 20th century as one of the wealthiest places on the planet. In 1913, it was richer than France or Germany, almost twice as prosperous as Spain, and its per capita GDP was almost as high as that of Canada.
—Edward L. Glaeser, Rafael Di Tella, Lucas Llach, Introduction to Argentine exceptionalism
From 1880–1905 British and French investments fueled livestock and grain exports, sparking rapid expansion and mass European immigration. GDP grew 7.5 times (8% annual average); per capita GDP rose from 35% to 80% of the U.S. level. A 2009 study noted GDP gains post-1870 but stagnant heights (proxy for welfare) until 1910, indicating uneven benefits.[citation needed]
During 1905–1941 growth slowed; although per capita GDP reached ~50% of U.S. levels by 1941, matching Western Europe's but with inequality.
Great Depression (1929–1932)
GDP fell 25%; recovery via import substitution in the late 1930s and WWII export booms created a $1.6B surplus (though £500M was frozen in the Bank of England under the 1933 Roca–Runciman Treaty). Manufacturing overtook agriculture by 1943, employing >1M by 1947; imported goods dropped from 40% to 10% of consumption by 1950.
Perón era (1945–1970s)
Juan Perón nationalized the Central Bank, railways, and industries. Inflation averaged 26% annually (1944–1974); GDP per capita peaked in the early 1950s, but stagnated due to commodity slumps and nationalizations.[31][32][33]
Debt crisis and hyperinflation (1976–1990s)
From 1976–1983, the National Reorganization Process attempted neoliberal policies under José Alfredo Martínez de Hoz ballooned debt; inflation hit 344% in 1983, the currency devalued 10x, while growth stalled.[34]
Stagflation ensued from 1975–1990) driven by increasing debt, evasion, and flight; hyperinflation peaked from 1989–1990.
In 1991 under Domingo Cavallo, the government attempted reforms, pegging the peso to the dollar. With the money supply curbed, inflation fell to single digits. Liberalization/privatization boosted GDP 33% in four years. Erratic growth came after 1995. In 2001 a crisis shrank GDP by 20%, unemployment reached 25%, the peso declined by 70%.
Commodity boom and Kirchner recovery (2002–2015)
From 2003–2011, expansionary policies and increased exports created >5M jobs. GDP nearly doubled (7.1% avg. annual, 9% 2003–2007). Real wages rose 72% (2003–2013). Postal, water, pensions, Aerolíneas Argentinas, YPF, railways were renationalized. A crisis stopped growth in 2009, although it rebounded to 9% (2010–2011).
During 2012–2015 capital controls, austerity, inflation, and trade slumps cut growth to 1.3% (2012–2014), edging up to 2.4% (2015).
Debt restructuring (2000s–2010s)
From 2005 to 2010 Argentina restructured $100B in loans. In 2001 it defaulted. Some bondholders rejected the restructuring, preventing it from going final. Debt service reached ~$14B.[34]
In 2018 the IMF completed a bailout – $30B as inflation hit 25%; interest rates reached 40% (world's highest). Inflation hit 54% in 2019 and 211% in 2023.
Milei: shock therapy (2023–2025)
In 2023 inflation crossed 100% and then 200%. Milei (elected with a 55.7% majority) devalued the peso 50–54% to ~800/USD. He cut subsidies/public works ($20B savings), achieved Argentina's first federal budget surplus since 2012.[35][36][37][38][39]
In 2024, Milei cut 15,000 state jobs, sparking protests.[40] Layoffs grew to ~24,000+ by mid-year. Poverty peaked at 57% in January, falling to 38.9–39% in Q3.[41] Inflation crashed to 2.4% in November, falling by almost half at 117.8%, down 93.6 pts from 2023's 211.4%. GDP fell ~3.8–4%.[42][43]
Milei's programs were popular: he reached a 40-50% approval rating (up from predecessor's 18%).
Growth summary
Period
Driver
GDP Growth (Annual Average%)
Per Capita vs. U.S. (%)
1880–1905
Exports/Immigration
8
35 → 80
1905–1941
Industrialization
3–4
~50
1945–1970s
Nationalization
40–45
1976–1990
Debt/Inflation
30–35
1991–2001
Peg/Liberalization
4 (then crash)
35
2003–2011
Commodities
7
40
2012–2023
Crises/Inflation
1
25–30
2024–2025
Austerity Reforms
-4
Data
Argentina Inflation
Year over Year inflation
M2 money supply increases Year over Year
Month over Month inflation
The following table shows the main economic indicators in 1980–2023, with IMF staff estimates for 2024–2028. NOTE: IMF estimates do not reflect the real figures of 2024 and the years after it, as it is outdated. Inflation below 5% is in green.[44]
Vineyard in Mendoza Province. Argentina ranks as the fifth largest wine producer worldwide.
Argentina ranks among major global agricultural producers. It leads in beef exports, citrus, grapes, honey, maize, sorghum, soybeans, squash, sunflower seeds, wheat, and yerba mate.[46] The sector contributed 9% of GDP in 2010. It generated one fifth of exports, excluding processed food and feed, which amounted to another third. Farmers harvested 103 million tons that year. Oilseeds, mainly soy and sunflower, exceeded 54 million tons. Cereals, mainly maize, wheat, and sorghum, surpassed 46 million tons.[47] In recent years, maize output has increased significantly; between 2000 and 2023, production rose by a factor of 3.74, while the planting area expanded by 3.18 times. During this period, the average yield per unit increased by approximately 26%. The country led world production of yerba mate. It ranked among the top five for soy, maize, sunflower seed, lemon, and pear. It placed in the top ten for barley, grape, artichoke, tobacco, and cotton. It stood among the top 15 for wheat, sugarcane, sorghum, and grapefruit.[48]
Soy field in Argentina's fertile Pampas. The versatile legume makes up about half the nation's crop production.
Sunflower seed production made Argentina one of the largest globally, with 2.2 million tons in 2010.[49] That year, output included 2.3 million tons of potato, almost 2 million tons of lemon, 1.3 million tons of rice, 1 million tons of orange, 921 thousand tons of peanut, 813 thousand tons of cotton, 707 thousand tons of onion, 656 thousand tons of tomato, 565 thousand tons of pear, 510 thousand tons of apple, 491 thousand tons of oats, 473 thousand tons of beans, 431 thousand tons of tangerine, 302 thousand tons of yerba mate, 283 thousand tons of carrot, 226 thousand tons of peach, 194 thousand tons of cassava, 174 thousand tons of olives, 174 thousand tons of banana, 148 thousand tons of garlic, 114 thousand tons of grapefruit, and 110 thousand tons of artichoke, plus smaller crops.[50]
Livestock
In 2019, producers raised 3 million tons of beef, fourth globally behind the US, Brazil, and China. They generated the fourth most honey, tenth most wool, 13th most chicken meat, 23rd most pork, 18th most cow's milk, and 14th most chicken egg.[50] Soy and byproducts, mainly animal feed and vegetable oils, formed one fourth of export raw materials. Cereals added 10%. Cattle raising supports domestic needs. Beef, leather, and dairy reached 5% of exports.[51] Sheep raising and wool thrive in Patagonia, though output halved since 1990. Biodiesel exports exceeded US$2 billion in 2011.[51]
Crops by region
Apples and pears grow in the Río Negro valley. Rice, oranges, and citrus dominate the northwest and Mesopotamia. Grapes and strawberries flourish in Cuyo. Berries appear in the far south. Cotton and tobacco lead in the Gran Chaco. Sugarcane and chile peppers prevail in the northwest. Olives and garlic come from the west. Farmers cultivate yerba mate tea in Misiones, tomatoes in Salta, and peaches in Mendoza for local markets. Organic farming covers nearly 3 million hectares, second only to Australia.[52] Fine wine production advanced in quality. Total viticulture potential remains untapped. Mendoza leads wine regions, followed by San Juan.[53]
Policy
Farmers imposed a grain embargo in March 2008 to protest export tax hikes.[54] Strikes and lockouts ended after the Senate defeated the increase on 16 July.[55]
The Vaca Muertatight oil (shale oil) field holds 2.58×10m (16.2×10^bbl) of oil and 8.7×10^m (308×10^cuft) of natural gas. It is estimated to be the third largest.
In 2019, Argentina was the 4th largest world producer of lithium,[61] the 9th largest world producer of silver,[62] the 17th largest world producer of gold[63] and the 7th largest world producer of boron.[64]
The World Bank lists the top industrial countries each year, based on the value of production. According to the 2019 list, Argentina had the 31st most valuable industry (57.7 billion dollars), behind Mexico, Brazil and Venezuela, but ahead of Colombia, Peru and Chile.[65]
In 2019, Argentina was the 31st largest producer of steel, the 28th producer of vehicles, the 22nd brewer of beer, the 4th producer of soybean oil and the 3rd producer of sunflower oil, among other industrial products.[66][67][68][50]
Argentina produced 791,000 motor vehicles in 2013, and exported 433,000 (mainly to Brazil, which in turn exported a somewhat larger number to Argentina); Argentina's domestic auto market reached a record 964,000 in 2013.[70] This marked a peak in vehicle production, by 2021 production had fallen to 434,753 vehicles.[71] Vehicles remained Argentina's top export to Brazil, accounting for $3.1bil in exports in 2021.[72]
Most manufacturing is organized in the 314 industrial parks operating nationwide as of 2012, a fourfold increase over the past decade.[73] Nearly half of Argentine industries are based in the Greater Buenos Aires area, although Córdoba, Rosario, and Ushuaia are also significant industrial centers; the latter city became the nation's leading electronics center during the 1980s.[74] The production of computers, laptops, and servers grew by 160% in 2011, to nearly 3.4 million units, and covered two-thirds of local demand.[75] Argentina became an important manufacturer of cell phones, providing about 80% of all devices sold in the country.[76]Farm machinery, another important rubric historically dominated by imports, was similarly replaced by domestic production, which covered 60% of demand by 2013.[77] Production of cell phones, computers, and similar products is an assembly industry, importing the majority of the components, and uses designs originating from other countries. High labour costs for Argentina assembly work tend to limit penetration to only Latin America, protected by regional trade treaties.[78]
Construction permits nationwide covered over 15 million m2 (160million ft2) in 2013. The construction sector accounted for over 5% of GDP, and two-thirds of construction is for residential buildings.[79]
Argentine electric outputed over 133billion kWh in 2013,[56] in large part through natural gas and hydroelectric resources. Nuclear energy is of high importance.[80] The country is one of the largest producers and exporters, alongside Canada and Russia of cobalt-60, a radioactiveisotope widely used in cancer therapy.
Services
The service sector is the largest contributor to GDP, accounting for over 60%.[citation needed] Argentina enjoys a diversified service sector, which includes well-developed social, corporate, financial, insurance, real estate, transport, communication services, and tourism.
The telecommunications sector grew at a fast pace, and the economy benefited from communications services. 77% of the population had access to mobile phones in 2011,[81] 95% of whom used smartphones as of 2015;[82] Internet access reached over 32 million users, or 75% of the population;[83] and broadband services.[84] Landline telephone services reached over 9.5million households.[85] Telecom revenues reached more than $17.8billion in 2013,[86] and while only one in three retail stores in Argentina accepted online purchases in 2013, e-commerce reached US$4.5billion in sales.[87]
Trade in services remained in deficit, however, with US$15billion in service exports in 2013 against US$19billion in imports.[18]Business Process Outsourcing became the leading service export, and reached US$3billion.[88] Advertising revenues from contracts abroad were estimated at over US$1.2billion.[89]
Tourism is an increasingly important sector, providing 4% of direct economic output (over US$17billion) in 2012; around 70% of tourism sector activity by value is domestic.[90]
Argentine banking deposits exceeded US$120billion in December 2012.[91] The financial sector developed via public sector banks, but became dominated by the private sector. Private sector banks accounted for most of the 80 active institutions (over 4,000 branches) and held nearly 60% of deposits and loans, and as many foreign-owned banks as local ones operated in the country.[92] The long-largest bank in Argentina by far, is the public Banco de la Nación Argentina. Not to be confused with the Central Bank, this institution accounts for 30% of deposits and a fifth of its loan portfolio.[92]
During the 1990s, Argentina's financial system consolidated and strengthened. Deposits grew from less than US$15billion in 1991 to over US$80billion in 2000, while outstanding credit (70% of it to the private sector) tripled to nearly US$100billion.[93]
According to World Economic Forum's 2017 Travel & Tourism Competitiveness Report, tourism generated over US$22billion, or 3.9% of GDP, and the industry employed more than 671,000 people, or approximately 3.7% of the workforce in 2016.[94] Around 5.7million foreign visitors arrived in 2017, reflecting a doubling in visitors since 2002 despite a relative appreciation of the peso.[citation needed]
Argentines have long been active travelers within Argentina[95] and international tourism saw healthy growth (nearly doubling since 2001).[90] Stagnant for over two decades, domestic travel increased strongly.[96][97]
INDEC recorded 5.2 million foreign tourist arrivals and 6.7million departures in 2013; of these, 32% arrived from Brazil, 19% from Europe, 10% from the United States and Canada, 10% from Chile, 24% from the rest of the Western Hemisphere, and 5% from the rest of the world. Around 48% of visitors arrived by commercial flight, 40% by motor travel (mainly from Brazil), and 12% by sea.[98]Cruise liner arrivals were the fastest growing type of foreign tourism to Argentina; a of 160 liners carrying 510,000 passengers arrived at the Port of Buenos Aires in 2013, an eightfold increase in a just a decade.[99]
Argentine electricity generation reached 133.3 billionkWh in 2013.[56] It was the third largest power market in Latin America. It mainly relies on centralised generation by natural gas (51%), hydroelectricity (28%), and oil (12%).[100]Resource estimates of unconventionalshale gas and tight oil in the Vaca Muerta oil field and elsewhere were estimated to be the world's third-largest.[58] In 2017, Argentina was the 18th largest producer (and the largest producer in Latin America) of natural gas.[101] In 2020, the country was the 28th largest oil producer at 70,000m3 (440,300bbl) per day.[102]
At the end of 2021 Argentina was 21st in terms of installed hydroelectric power (11.3 GW), the 26th at wind energy (3.2 GW) and the 43rd in solar energy (1.0 GW).[103]
The first of three nuclear reactors was inaugurated in 1974. As of 2015 nuclear power generated 5% of the country's energy output.[100]
The electricity sector was unbundled in generation, transmission and distribution by early 1990s reforms. Generation is competitive and mostly liberalized; 75% of capacity is privately owned. In contrast, transmission and distribution is regulated with much less competitive.
Transport in Argentina is mainly based on a complex network of routes, crossed by relatively inexpensive long-distance buses and by cargo trucks. The country also has a number of national and international airports. The importance of the long-distance train is minor today, though in the past it was widely used and is now regaining momentum after the re-nationalisation of the country's commuter and freight networks.[104][105]Fluvial transport is mostly used for cargo.
In 2022, Argentina was the 44th largest exporter (by merchandise exports) totaling US$88 billion, or 0.4%.[106]
Argentine exports are diversified. Agricultural raw materials are over 20% of the exports and agricultural goods account for over 50% of exports including processed foods. Soy products (soybeans, vegetable oil) accounted for almost one fourth. Cereals, mostly maize and wheat, which were Argentina's leading export during much of the twentieth century, make up less than one tenth now.[107]
Industrial goods comprise over one-third of Argentine exports. Motor vehicles and auto parts are the leading industrial export, at over 12% of merchandise exports. Chemicals, steel, aluminum, machinery, and plastics account for most of the remaining industrial exports. Trade in manufactures has historically been in deficit for Argentina, however, and despite the nation's overall trade surplus, its manufacturing trade deficit exceeded US$30 billion in 2011.[108] Accordingly, the system of non-automatic import licensing was extended in 2011,[109] and regulations were enacted for the auto sector establishing a model by which a company's future imports would be determined by their exports.[110]
A net energy importer until 1987, Argentina's fuel exports began increasing in the early 1990s and account for about one-eighth of the total; refined fuels make up about half of that. As of 2009 exports of crude petroleum and natural gas were around US$3billion a year.[107] Rapidly growing domestic energy demand and a gradual decline in oil production, resulted in a US$3 billion energy trade deficit in 2011 (the first in 17 years)[111] and a US$6 billion energy deficit in 2013.[112]
Argentine imports have historically been dominated by industrial and technological supplies, machinery, and parts, which have averaged US$50billion since 2011 (two-thirds of imports). Consumer goods including motor vehicles make up most of the rest.[107]Trade in services was in deficit. In 2013 this deficit widened to over US$4billion with a record US$19billion in service imports.[18] The nation's chronic current account deficit was reversed during the 2002 crisis, and an average current account surplus of US$7billion was logged between 2002 and 2009; this surplus later narrowed considerably, and was slightly negative in 2011.[113]
As of 2010 foreign direct investment (FDI) in Argentina was divided nearly evenly between manufacturing (36%), natural resources (34%), and services (30%). The chemical and plastics sector (10%) and the automotive sector (6%) led foreign investment in local manufacturing; oil and gas (22%) and mining (5%), in natural resources; telecommunications (6%), finance (5%), and retail trade (4%), in services.[118] Spain was the leading source of foreign direct investment in Argentina, accounting for US$22billion (28%) in 2009; the U.S. was second, with $13billion (17%);[118] China grew to become the third-largest by 2011.[119] Investments from the Netherlands, Brazil, Chile, and Canada were significant; in 2012, foreign nationals held a of around US$112billion in direct investment.[18]
Bilateral agreements played an important role in promoting U.S. private investment. Argentina inked an Overseas Private Investment Corporation (OPIC) agreement and an active program with the U.S. Export-Import Bank. Under the 1994 U.S.–Argentina Bilateral Investment Treaty, U.S. investors enjoyed national treatment in all sectors except shipbuilding, fishing, nuclear-power generation, and uranium production. The treaty allowed for international arbitration of investment disputes.
FDI averaged US$5.7billion from 1992 to 1998 and reached in US$24billion in 1999 (reflecting the purchase of 98% of YPF stock by Repsol), fell to US$1.6billion in 2003.[120] FDI then accelerated, reaching US$8billion in 2008.[121] The financial crisis cut this figure to US$4billion in 2009; but inflows recovered to US$8.7billion in 2011[122]
FDI volume remained below the regional average as a percent of GDP; Kirchner Administration policies and difficulty in enforcing contractual obligations were blamed.[123] Foreign investment in Argentina shifted after 2000, from privatizations and mergers and acquisitions, to over half in the form of medium and high-tech investment (compared to 36% in Brazil and 3% in Chile).[124]
Issues
The government has been accused of manipulating economic statistics.[125]
Reliability of official CPI estimates
Official CPI inflation figures released monthly by INDEC were a subject of political controversy from 2007 through 2015.[126][127][128] Official inflation data were disregarded by leading union leaders, when negotiating pay rises.[129] Some private-sector estimates put inflation for 2010 at around 25%, much higher than the official 10.9% rate.[129] Inflation estimates from Argentina's provinces were higher than government figures.[129] The government backed up the validity of its data, but called in the IMF to help design a new nationwide index.[129]
The official CPI assessed 520 products, however the list was not made public.[130] Economic analysts were prosecuted for publishing estimates that disagreed with official statistics.[131] The government levied a fine of up to 500,000 pesos for providing what it called "fraudulent inflation figures".[129] Beginning in 2015, the government again called for competitive bids from the private sector to provide a weekly independent inflation index.[132]
Inflation
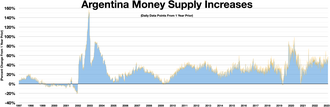
Argentina money supply increases year over year. Daily data points.
High inflation was a weakness of the Argentine economy for decades, frequently above 25%,[134] although it dramatically declined under Milei, reaching 1.5% in June 2025.[135]
The inflation rate in Argentina rose to 52.3 percent in February 2022.[136] In August the interest rate was hiked to 69.5% as inflation further deteriorated, hitting a 20-year high at 70%.[137] Inflation passed 100% in February 2023 for the first time since 1991.[138][139] On October 12, 2023, Argentina's central bank again increased the benchmark interest rate, from 118% to 133%, as inflation hit 138%.[140]
Argentine workers held funerals to mourn the "death of (their) wages".[141]
After Milei's victory in October 2023, efforts were made to curb the inflation rate. In January 2022, the monthly inflation rate kept increasing from 2.4% to a peak of 25% just before his inauguration. Soon after, Milei devalued the peso by 50% to cut the wide gap between the official exchange rate and the market exchange rate.[37] In a year he brought inflation down to a monthly 2.4%.[142] Milei then arranged a 2% monthly devaluation.[143][37]
In 2024, the peso appreciated by 44.2% against the dollar, outperforming all other currencies. These actions aimed to stabilize an economy teetering on the brink of hyperinflation. The peso's strengthening doubled average wages in dollar terms to $990.[144]
Income distribution
In relation to other Latin American countries, Argentina has a moderate to low level of income inequality. Its Gini coefficient was about 0.407 (2022).[145] The gap was worst in the capital suburbs, where the economically successful live in gated communities, while the poor live in slums known as villas miserias.[146]
In the mid-1970s, the most affluent 10% of Argentina's population had an income 12 times that of the poorest 10%. That figure grew to 18 times by the mid-1990s, and by 2002, 43,[146] before declining to 16 in 2010.[147]
Argentina had an inequality-adjusted human development index of 0.729, compared to 0.578 and 0.709 for neighboring Brazil and Chile, respectively.[148] The 2010 Census found that poverty still affected 1 in 8 inhabitants, however;[149] and while the official, household survey poverty rate (based on U$S 100 per person per month, net) was 4.7% in 2013,[150] although the National Research Council estimated poverty in 2010 at 22.6%,[151] with private consulting firms estimating that in 2011 around 21% fell below the income poverty line.[152] The World Bank estimated that, in 2013, 3.6% subsisted on less than US$3.10 per person per day.[153]
Informal Employment
As with many other Latin American countries, Argentina suffers from high levels of informal employment. As of January 2025, it is estimated that 42% of workers in Argentina were affected by informal unemployment. [citation needed] The consequences of this are variable and widespread. An obvious issue is the government's inability to collect taxes on informal firms and workers. But the government is not the only group who is disadvantaged by informal work. Informal workers, on average, earn nearly 60% less than formal workers and are half as likely to benefit from social protection benefits. [citation needed]
This page is based on this Wikipedia article Text is available under the CC BY-SA 4.0 license; additional terms may apply. Images, videos and audio are available under their respective licenses.


