Gotthard line in 1882Development of real GDP per capita, 1851 to 2018
Switzerland as a federal state was established in 1848. Before that time, the city-cantons of Zürich, Geneva, and Basel in particular began to develop economically based on industry and trade, while the rural regions of Switzerland remained poor and underdeveloped. While a workshop system had been in existence throughout the early modern period, the production of machines began in 1801 in St. Gallen, with the third generation of machines imported from Great Britain. But in Switzerland, hydraulic power was often used instead of steam engines because of the country's mountainous topography and lack of significant deposits of coal. By 1814, hand weaving had been mostly replaced by the power loom. Both tourism and banking began to develop as economic factors at about the same time. While Switzerland was primarily rural, the cities experienced an industrial revolution in the late 19th century, focused especially on textiles. In Basel, for example, textiles, including silk, were the leading industry. In 1888, women made up 44% of wage earners. Nearly half the women worked in the textile mills, with household servants the second largest job category. The proportion of women in the workforce was higher between 1890 and 1910 than it was in the late 1960s and 1970s.[29]
Railways played a major part in industrialization; the first railway opened in 1847, between Zürich and Baden. Despite the competition between private players, Switzerland was covered with more than 1000km of track by 1860. Nevertheless, the network was barely coordinated because of the decentralised system.[30]
20th century
The industrial sector began to grow in the 19th century with a laissez-faire industrial/trade policy, Switzerland's emergence as one of the most prosperous nations in Europe, sometimes termed the "Swiss miracle", was a development of the mid 19th to early 20th centuries, among other things tied to the role of Switzerland during the World Wars.[31]
Switzerland's total energy consumption, which was dropping from the mid-1910s to the early 1920s, started to increase again in the early 1920s. It stagnated during the 1930s before falling again during the early 1940s; but rapid growth started once again in the mid-1940s.[32]
In the 1940s, particularly during World War II, the economy profited from the increased export and delivery of weapons to Germany, France, the United Kingdom, and other European countries. However, Switzerland's energy consumption decreased rapidly. The co-operation of the banks with the Nazis (although they also co-operated extensively with the British and French) and their commercial relations with the Axis powers during the war were later sharply criticised, resulting in a short period of international isolation of Switzerland. Switzerland's production facilities were largely undamaged by the war, and afterwards both imports and exports grew rapidly.[33]
In the 1950s, annual GDP growth averaged 5% and Switzerland's energy consumption nearly doubled. Coal lost its rank as Switzerland's primary energy source, as other imported fossil fuels, such as crude and refined oil and natural and refined gas, increased.[34]
In the 1960s, annual GDP growth averaged 4% and Switzerland's total energy consumption nearly doubled again. By the end of the decade oil provided over three-quarters of Switzerland's energy.[34]
In the 1970s the GDP growth rate gradually declined from a peak of 6.5% in 1970; GDP then contracted by 7.5% in 1975 and 1976. Switzerland became increasingly dependent on oil imported from its main suppliers, the OPEC cartel. The 1973 international oil crisis caused Switzerland's energy consumption to decrease in the years from 1973 to 1978.[34] In 1974 there were three nationwide car-free Sundays when private transport was prohibited as a result of the oil supply shock. From 1977 onwards GDP grew again, although Switzerland was also affected by the 1979 energy crisis which resulted in a short-term decrease in Switzerland's energy consumption. In 1970 industry still employed about 46% of the labor force, but during the economic recession of the 1970s the services sector grew to dominate the national economy. By 1970 17.2% of the population and about one quarter of the work force were foreign nationals, though job losses during the economic recession decreased this number.[33]
In the 1980s, Switzerland's economy contracted by 1.3% in 1982 but grew substantially for the rest of the decade, with annual GDP growth between about 3% and 4%, apart from 1986 and 1987 when growth decreased to 1.9% and 1.6% respectively.[35]
Switzerland's economy was marred by slow growth in the 1990s, having the weakest economic growth in Western Europe. The economy was affected by a three-year recession from 1991 to 1993, when the economy contracted by 2%. The contraction also became apparent in Switzerland's energy consumption and export growth rates. Switzerland's economy averaged no appreciable increase (only 0.6% annually) in GDP.
After enjoying unemployment rates lower than 1% before 1990, the three-year recession also caused the unemployment rate to rise to its all-time peak of 5.3% in 1997. In 2008, Switzerland was in second place among European countries with populations above one million in terms of nominal and purchasing power parity GDP per capita, behind Norway (see list). Several times in the 1990s, real wages decreased since nominal wages could not keep up with inflation. However, beginning in 1997, a global resurgence in currency movement provided the necessary stimulus to the Swiss economy. It slowly gained momentum, and peaked in the year 2000 with 3.7% growth in real terms.[36]
21st century
In the early 2000s recession, being so closely linked to the economies of Western Europe and the United States, Switzerland could not escape the slowdown in these countries. After the worldwide stock market crashes in the wake of the 9/11 terrorist attacks, there were more announcements of false enterprise statistics[clarification needed] and exaggerated managers' wages. The rate of GDP growth dropped to 1.2% in 2001; 0.4% in 2002; and minus 0.2% in 2003. This economic slowdown had a noticeable impact on the labour market.
Many companies announced mass dismissals and thus the unemployment rate rose from its low of 1.6% in September 2000 to a peak of 4.3% in January 2004,[37] although well below the European Union (EU) rate of 9.2% at the end of 2004.[38]
On 10 November 2002 the economics magazine Cash suggested five measures for political and economic institutions to implement to revive the Swiss economy:
1. Private consumption should be promoted with decent wage increases. In addition to that, families with children should get discounts on their health insurance.
2. Switzerland's national bank should revive investments by lowering interest rates. Besides that, monetary institutions should increasingly credit consumers[clarification needed] and offer cheaper land to be built on.
3. Switzerland's national bank was asked to devalue the Swiss Franc, especially compared to the Euro.
4. The government should implement the anti-cyclical measure of increasing budget deficits. Government spending should increase in the infrastructure and education sectors. Lowering taxes would make sense in order to promote private household consumption.
5. Flexible work schedules should be instituted, thus avoiding low demand dismissals.
These measures were applied with successful results while the government strove for the Magical Hexagon of full employment, social equality, economic growth, environmental quality, positive trade balance and price stability. The rebound which started in mid-2003 saw growth rate growth rate averaging 3% (2004 and 2005 saw a GDP growth of 2.5% and 2.6% respectively; for 2006 and 2007, the rate was 3.6%). In 2008, GDP growth was modest in the first half of the year while declining in the last two quarters. Because of the base effect, real growth came to 1.9%. While it contracted 1.9% in 2009, the economy started to pick up in Q3 and by the second quarter of 2010, it had surpassed its previous peak. Growth for 2010 was 2.6%[41]
The stock market collapse of 2007-2009 deeply affected investment income earned abroad. This translated to a substantial fall in the surplus of the current account balance. In 2006, Switzerland recorded a 15.1% per GDP surplus. It went down to 9.1% in 2007 and further dropped to 1.8% in 2008. It recovered in 2009 and 2010 with a surplus of 11.9% and 14.6% respectively.[42] Unemployment peaked in December 2009 at 4.4%. In August 2018 the unemployment rate was 2.4%.[37]
The chart below shows the trend of the gross domestic product of Switzerland at market prices:[43]
While most of the Swiss economic practices have been brought largely into conformity with the European Union's policies, some trade protectionism remains, particularly for the small agricultural sector.[48]
In 2022, the sector with the highest number of companies registered in Switzerland is Services with 230,494 companies followed by Finance, Insurance, and Real Estate and Retail Trade with 107,547 and 45,935 companies respectively.[49]
Switzerland is a leading exporter of high-end watches and clocks. Swiss companies produce most of the world's high-end watches: in 2011 exports reached nearly 19.3 billion CHF, up 19.2% over the previous year. Watch manufacturing is mostly located around the Jura mountains, in the cantons of Geneva, Vaud, Neuchâtel, Bern, and Jura. Notable watchmaking firms include Rolex, Patek Philippe, Swatch, and Richemont.
The watches go to Asia (55%), Europe (29%), Americas (14%), Africa and Oceania (both 1%).[50]
In 2011, Switzerland led the world by exporting over US$20 billion value of all types of watches, followed by Hong Kong, at under US$10 billion. China exported the highest number of watches by far in 2011.[50]
In July 2024, the Swatch Group lost 70% of its profit.[51]
Switzerland has an extensive industrial sector, with globally competitive companies in various industrial sectors. Most noticeably, food processing like Nestlé, machines and robot manufacturers such as ABB, Bobst SA and Stadler Rail, chemicals for industrial and construction use like Sika AG, or military equipment such as Ruag.
Switzerland also has one of the most competitive pharmaceutical industries in the world. Major Swiss pharmaceutical companies include Novartis and Roche.
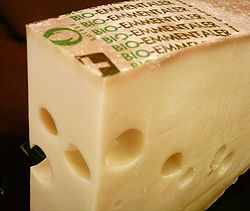
Swiss free-range cattleEmmentaler cheese. While some Swiss types are AOP restricted, generic Emmentaler is produced around the world.
Switzerland is highly protective of its agricultural industry. High tariffs and extensive domestic subsidisations encourage domestic production, which currently produces about 60% of the food consumed in the country. Cheeses and dairy are emblematic products of Swiss agriculture. Wine is another.
According to the Organisation for Economic Co-operation and Development (OECD), Switzerland is subsidising more than 70% of its agriculture compared to 35% in the EU. The 2007 Agricultural Program increased subsidies by CHF 63 million to CHF 14.092 billion.
Protectionism acts to promote domestic production, but not to reduce prices or the cost of production, and there is no guarantee the increased domestic production is actually consumed internally; it may simply be exported, to the profit of the producers. 90 to 100% of potatoes, vegetables, pork, veal, cattle and most milk products are produced in the country. Beyond that, Swiss agriculture meets 65% of the domestic food demand.[52] In 2016 the Swiss government spent about 5.5% of its total budget (over CHF 3.5 billion) on supporting food production.[53]
The first reform in agricultural policies was in 1993. Among other changes, since 1998 Switzerland has linked the attribution of farm subsidies with the strict observance of good environmental practice. Before farmers can apply for subsidies, they must obtain certificates of environmental management systems (EMS) proving that they: "make a balanced use of fertilizers; use at least 7% of their farmland as ecological compensation areas; regularly rotate crops; adopt appropriate measures to protect animals and soil; make limited and targeted use of pesticides."[54] 1,500 farms are driven out of business each year. But the number of organic farms increased by 3.3 percent between 2003 and 2004, and organic sales increased by 7 percent to $979 million.[55] Moreover, Swiss consumers consider less important the drawback of higher prices for organic food compared to conventional locally produced food.[52]
Trade
The CIA World Factbook estimates Switzerland's 2011 exports at $308.3 billion and the 2010 exports at $258.5 billion. Imports are estimated to be $299.6 billion in 2011 and $246.2 billion in 2010. According to the World Factbook numbers, Switzerland is the 20th largest exporter and the 18th largest importer.[48]
The United Nations Commodity Trade Statistics Database has lower numbers for Switzerland's exports and imports. The UN calculates exports at $223.5 billion in 2011 and $185.8 billion in 2010. The value of all imports in 2011 was $197.0 billion and in 2010 it was $166.9 billion.[56]
Switzerland's largest trading partner is Germany. In 2017, 17% of Switzerland's exports and 20% of its imports came from Germany. The United States was the second largest destination of exports (10% of total exports) and the second largest source of imports (7.8%). China was the third largest destination of exports (9.2%) but only provided 4.8% of imports.[57]
The next largest destinations of exports include India (7.3%), France (5.4%), Hong Kong (5.4%), the United Kingdom (4.5%) and Italy (4.4%). Other major sources of imports include: Italy (7.6%), the United Kingdom (7.1%), France (6.0%), China (mentioned above), the United Arab Emirates (3.7%) and Hong Kong (3.4%).[57]
As a developed country with a skilled labor force, the majority of Swiss exports are precision or 'high tech' finished products. Switzerland's largest specific SITC categories of exports include medicaments (13%), heterocyclic compounds (2.2%), watches (6.4%), orthopaedic appliances (2.1%), and precious jewellery (2.5%). While watches and jewellery remained an important part of the economy, in 2017 about 24% of Swiss exports were gold bullion or coins. Agricultural products that Switzerland is famous for such as cheese (0.23%), wine (0.028%), and chocolate (0.35%) all make up only a small portion of Swiss exports.[57] Switzerland is also a significant exporter of arms and ammunition, and the third largest for small calibers[58] which accounted for 0.33% of the total exports in 2012.[59]
Switzerland's main imports include gold (21%), medicaments (7.4%), cars (4.0%), precious jewellery (3.7%), and other unclassified transactions (18%). While Switzerland has a long tradition of manufacturing cars,[60] there are currently no large-scale assembly line automobile manufacturers in the country.
Top 25 imports and exports for Switzerland for 2017[57]
Top 25 Imports into Switzerland for 2017
Ranking
SITC4
Product names (SITC)
Value (billion USD)
%
1
9710
Gold
52.96
21.0%
2
9310
Unclassified Transactions
46.33
18.0%
3
5417
Medicaments
18.69
7.4%
4
7810
Cars
9.98
4.0%
5
8973
Precious Jewellery
9.19
3.7%
6
6672
Diamonds
3.13
1.2%
7
8960
Artwork
3.05
1.2%
8
5156
Heterocyclic Compounds
2.59
1.0%
9
8851
Watches
2.47
1.0%
10
7643
TV and Radio Transmitters
2.38
1.0%
11
8510
Footwear
2.12
0.8%
12
7721
Circuit Breakers and Panels
2.02
0.8%
13
8996
Orthopedic Devices
1.91
0.8%
14
8720
Medical Instruments
1.72
0.7%
15
7284
Machinery for Specialized Industries
1.71
0.7%
16
8219
Miscellaneous Furniture
1.67
0.7%
17
8939
Miscellaneous Articles of Plastic
1.61
0.6%
18
3510
Electric Current
1.58
0.6%
19
3330
Crude Petroleum
1.56
0.6%
20
5989
Chemical Products
1.51
0.6%
21
5530
Perfumery and Cosmetics
1.23
0.5%
22
6842
Processed Aluminium
1.23
0.5%
23
7821
Trucks and Vans
1.19
0.5%
24
7932
Ships and Boats
1.15
0.5%
25
7924
Large Aircraft
1.10
0.4%
Top 25 exports from Switzerland for 2017
Ranking
SITC4
Product names (SITC)
Value (billion USD)
%
1
9710
Gold
69.04
24.0%
2
9310
Unclassified Transactions
54.97
19.0%
3
5417
Medicaments
36.64
13.0%
4
8851
Watches
18.63
6.4%
5
8973
Precious Jewellery
7.27
2.5%
6
5156
Heterocyclic Compounds
6.29
2.2%
7
8996
Orthopedic Devices
5.99
2.1%
8
7284
Machinery for Specialized Industries
4.24
1.5%
9
7721
Circuit Breakers and Panels
3.45
1.2%
10
8720
Medical Instruments
2.74
1.0%
11
711
Coffee
2.34
0.8%
12
8960
Artwork
2.02
0.7%
13
7492
Valves
1.82
0.6%
14
6672
Diamonds
1.78
0.6%
15
5514
Scented Mixtures
1.68
0.6%
16
5530
Perfumery and Cosmetics
1.67
0.6%
17
1110
Miscellaneous Beverages
1.58
0.6%
18
6842
Processed Aluminium
1.49
0.5%
19
7149
Parts of Gas Turbines and Reaction Engines
1.37
0.5%
20
7849
Vehicles Parts and Accessories
1.32
0.5%
21
5147
Amide Function Compounds
1.30
0.5%
22
7452
Miscellaneous Non-Electrical Machines
1.28
0.4%
23
8939
Miscellaneous Articles of Plastic
1.27
0.4%
24
5989
Chemical Products
1.23
0.4%
25
5413
Antibiotics
1.14
0.4%
Top 25 trading partners for Switzerland for 2017[57]
Top 25 trading partners importing into Switzerland for 2017
Ranking
Country
Value (billion USD)
%
1
Germany
54.61
20.0%
2
USA
21.30
7.8%
3
Italy
20.70
7.6%
4
United Kingdom
19.26
7.1%
5
France
16.45
6.0%
6
China
13.22
4.8%
7
United Arab Emirates
9.98
3.7%
8
Hong Kong
9.34
3.4%
9
Ireland
7.73
2.8%
10
Austria
7.70
2.8%
11
Belgium-Luxembourg
5.76
2.1%
12
Japan
5.69
2.1%
13
Spain
5.37
2.0%
14
Netherlands
5.24
1.9%
15
Thailand
4.32
1.6%
16
Uzbekistan
3.68
1.3%
17
Zambia
3.64
1.3%
18
Czech Republic
2.54
0.9%
19
Peru
2.47
0.9%
20
Poland
2.39
0.9%
21
Russia
2.32
0.9%
22
South Africa
2.32
0.9%
23
Singapore
2.01
0.7%
24
Canada
1.98
0.7%
25
Ghana
1.84
0.7%
Top 25 trading partners exporting from Switzerland for 2017
Switzerland has highly developed tourism infrastructure, especially in the mountainous regions and cities, making it a good market for tourism-related equipment and services.
14% of hotels were in Grisons, 12% each in the Valais and Eastern Switzerland, 11% in Central Switzerland and 9% in the Bernese Oberland. The ratio of lodging nights in relation to resident population ("tourism intensity", a measure for the relative importance of tourism to local economy) was largest in Grisons (8.3) and Bernese Oberland (5.3), compared to a Swiss average of 1.3. 56.4% of lodging nights were by visitors from abroad (broken down by nationality: 16.5% Germany, 6.3% UK, 4.8% USA, 3.6% France, 3.0% Italy) [61]
The total financial volume associated with tourism, including transportation, is estimated to CHF 35.5 billion (as of 2010) although some of this comes from fuel tax and sales of motorway vignettes. The total gross value added from tourism is 14.9 billion. Tourism provides a total of 144,838 full time equivalent jobs in the entire country. The total financial volume of tourist lodging is 5.19 billion CHF and eating at the lodging provides an additional 5.19 billion. The total gross value added of 14.9 billion is about 2.9% of Switzerland's 2010 nominal GDP of 550.57 billion CHF.[62][63]
In 2003, the financial sector[64] comprised an estimated 11.6% of Switzerland's GDP and employed approximately 196,000 people (136,000 of whom work in the banking sector); this represents about 5.6% of the total Swiss workforce.[65]
Swiss neutrality and national sovereignty, long recognized by foreign nations, have fostered a stable environment in which the banking sector was able to develop and thrive. Switzerland has maintained neutrality through both World Wars, is not a member of the European Union, and was not even a member of the United Nations until 2002.[66][67] Currently an estimated 28 percent of all funds held outside the country of origin (sometimes called "offshore" funds) are kept in Switzerland.[68] In 2009 Swiss banks managed 5.4 trillion Swiss Francs.[69]
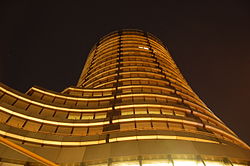
The Bank of International Settlements, an organization that facilitates cooperation among the world's central banks, is headquartered in the city of Basel. Founded in 1930, the BIS chose to locate in Switzerland because of the country's neutrality, which was important to an organization founded by countries that had been on both sides of World War I.[70] In May 2006, foreign banks operating in Switzerland managed 870billion Swiss francs worth of assets.[71] In 2014, this number was estimated to be 960billion Swiss francs.[72]
Switzerland is a major hub for commodities trading, globally. Commodities trading represents 4% of Swiss GDP (2022).[79] The range of products traded either physically or financially include agriculture, minerals, metals and oil/energy.[80] Some 40% of all oil shipments are traded through Switzerland, along with 60% of metals and grains (2022).[81] Alternate sources give Switzerland's share of agricultural commodities trade at 35% (2023).[82]
10,000 persons work in the commodity trade business in Switzerland (& 35,000 indirectly).[83] Mostly around Lake Geneva, Zug and Lugano.[84][79]
Corporate loans and revolving credit facilities granted to the five main Swiss energy trading houses (Glencore, Mercuria, Gunvor, Vitol and Trafigura) between 2013 and 2019 exceeded $360 billion.[85]
The Swiss economy is characterised by a skilled and generally 'peaceful' workforce. One quarter of the country's full-time workers are unionised. Labour and management relations are amicable, characterised by a willingness to settle disputes instead of resorting to labour action. They take place between trade unions and branch associations, that are themselves often grouped in Union of Employers, like the Fédération patronale vaudoise or the Fédération des Entreprises Romandes Genève. About 600 collective bargaining agreements exist today in Switzerland and are regularly renewed without major problems. However, there is no country-wide minimum wage across sectors, but some collective bargaining agreement may contain minimum wage requirements for specific sectors or employers. A May 2014 ballot initiative which would have required a Swiss minimum wage to 22 Swiss francs an hour (corresponding to a monthly income of about 4000 Swiss francs) failed to pass, gaining only 23.7% support on the ballot.[96] On 27 September 2020 voters in the Canton of Geneva approved a minimum wage of 23 Swiss franc per hour or about 4,000 per month.[97]
With the peak of the number of bankruptcies in 2003, however, the mood was pessimistic. Massive layoffs and dismissals by enterprises resulting from the global economic slowdown, major management scandals and different foreign investment attitudes have strained the traditional Swiss labour peace. Swiss trade unions have encouraged strikes against several companies, including Swiss International Air Lines, Coca-Cola, and Orange. Total days lost to strikes, however, remain among the lowest in the OECD.
A study estimated that Switzerland will have a short fall of hundreds of thousands of workers by 2030.[98] According to statistics, one in four Swiss has a second job.[99]
In 2013 the mean household income in Switzerland was CHF 120,624 (c. USD 134,000 nominal, US$101,000 PPP), the mean household income after social security, taxes and mandatory health insurance was CHF 85,560 (c. USD 95,000 nominal, US$72,000 PPP).[100] The OECD lists Swiss household gross adjusted disposable income per capita US$32,594 PPP for 2011.[101]
As of 2016, Switzerland had the highest average wealth per adult, at $561,900.[102] The top 1% richest persons own 35% of all the wealth (2015).[103] This inequality gap increased to 42% of all the wealth in 2023.[104]
The "net wealth" of Switzerland was $5.4 trillion as measured by the net worth of its richest citizens. Among this group are 740 super-rich people with assets of at least $100 million. Switzerland has 580,000 millionaires in total which is 60,000 more than Germany with a population which is approximately 10 times larger.[105]
This development was tied to the exchange rate between the US Dollar and the Swiss franc, which caused capital in Swiss francs to more than double its value in dollar terms during the 2000s and especially during the 2008 financial crisis, without any direct increase in value in terms of domestic purchasing power.[106]
The high average wealth is determined by the few who are extremely wealthy; the median (50th percentile) wealth of a Swiss adult is five times lower than the average, at US$100,900 (US$70,000 PPP as of 2011).[107]
The Statistical Office defines the majority of the population as “neither rich nor poor and the average Swiss earns just enough to afford the high cost of living in Switzerland”.[108] According to some Swiss statistics "28% [of Swiss families] have nothing left to save at the end of the month".[109]
As of 2022, one in seven Swiss pensioners was living in poverty. Some 46,000 Swiss pensioners have already fallen into poverty and a further 295,000 are in danger of joining them. The official poverty line is drawn at CHF2,279 ($2,300) per month to pay for rent, health insurance, clothes and food.[110]
About 8.2% of the population live below the national poverty line, defined in Switzerland as earning less than CHF3,990 per month for a household of two adults and two children, and a further 15% are at risk of poverty.[111][112]
Income and wealth distribution in Switzerland reflects a high-income economy with relatively moderate inequality and strong social outcomes. The Swiss Federal Statistical Office reports a Gini coefficient of 31.5 in 2023, a level that has remained stable over the past decade and indicates balanced income dispersion for a market-oriented system. Switzerland's wage structure is supported by coordinated wage negotiations, extensive vocational training, and high labor force participation, which contribute to low unemployment and broadly shared earnings. Extreme poverty is nearly nonexistent, although national poverty rates slightly above 15 percent reflect high living costs rather than severe material deprivation. Wealth inequality is more pronounced due to the concentration of financial assets, but broad household access to occupational pensions and mandatory private savings reduces disparities in retirement security. Taken together, Switzerland's institutional framework, labor market design, and targeted social programs support relatively equitable income distribution despite limited reliance on expansive welfare spending.[113]
Unlike France or Spain, Switzerland has one of the lowest homeownership rates in Europe (around 36%).[114]
On 6 June 2025, following the collapse and following UBS takeover of Credit Suisse, the Federal Council outlined a series of amendments to existing legislation, aiming to prevent such a crisis from happening again. This collection of proposed amendments, called "Too Big To Fail measures", is specifically intended to address the risks caused by banks and other institutions that are critical to Swiss and global financial infrastructure.[115] The four banks that are currently deemed "systemically important banks" are UBS, Postfinance, Raiffeisen, and the Zurich Cantonal Bank.[116] Among the proposed measures is a requirement to fully finance the purchase of and continued involvement in foreign subsidiaries with capital, rather than partially using debt as is the current standard.[117] An expert report was commissioned by the State Secretariat for International Finance on the potential effects of this measure for banks such as UBS. The report indicates that among potential consequences to this increased requirement for capital is a temporary increase of borrowing costs. However, it also highlights how such a measure would increase the resilience of Swiss banks in the case of a crisis.[118]
A preliminary version of the measures in the Too Big To Fail (TBTF) package were first set forward in April 2024. However, the Federal Council waited to announce a final version of the plan until June 2025, waiting for input from a report from the Parliamentary Investigation Committee.[119] The measures in the TBTF plan are divided into three categories according to their role in ensuring banking stability.[120] The first, "Strengthening prevention" involves measures such as legislation to prevent encouragement for risk-taking in senior banking executives in systemically important banks, such as with variable bonuses. This proposed legislation makes such bonuses subject to retention periods and even cancellation and repayment in the event of misconduct. This area of the package also provides for an increase in clear allocation of responsibility within senior management structures of all banks in order to increase accountability and prevent misconduct.[120][121] The second, "Strengthening liquidity" includes measures such as requirements to prepare collateral to ensure liquidity of the central bank, with increased requirements for systemically important banks based on risk.[120] The third and final area addressed in the Too Big To Fail package is "Expanding the crisis toolkit", with measures that include requirements for recovery planning on the part of the banks and revision of legislature to include criteria for such recovery plans, and similar such requirements and legislation for resolution planning.[120] These measures affect both "going concern" issues, where the bank is still viable, and "gone concern" issues, when the bank is being liquidated and wound down.[122] In all, there are 31 proposed measures, consisting of amendments to current legislation and ordinances alike.[119] The TBTF package is expected to enter into force in stages, with amendments to existing ordinances already in consultation until September 2025. The first stage is expected to enter into force in 2027 at the earliest.[115][116] The next stage, legislative amendments on foreign capital requirements, is to be drafted in late 2025, and is expected to enter into force in 2028. The last stage, consisting of the remaining legislative amendments, is to be drafted in early 2026. This last stage is expected to enter into force in 2028/2029.[115]
Through the United States-Swiss Joint Economic Commission (JEC), Switzerland has passed strict legislation covering anti-terrorism financing and the prevention of terrorist acts, marked by the implementation of several anti-money laundering procedures and the seizure of al-Qaeda accounts.
European Union
Apart from agriculture, there are minimal economic and trade barriers between the European Union and Switzerland. In the wake of the Swiss voters' rejection of the European Economic Area Agreement in 1992, the Swiss Government set its sights on negotiating bilateral economic agreements with the EU. Four years of negotiations culminated in Bilaterals, a cross-platform agreement covering seven sectors: research, public procurement, technical barriers to trade, agriculture, civil aviation, land transport, and the free movement of persons. Parliament officially endorsed the Bilaterals in 1999 and it was approved by general referendum in May 2000. The agreements, which were then ratified by the European Parliament and the legislatures of its member states, entered into force on 1 June 2002.[123] The Swiss government then embarked on a second round of negotiations, called the Bilaterals II, approved by the Swiss electorate on 5 June 2005, which further strengthens the country's economic ties with the organisation.[124][125]
Switzerland has since brought most of their practices into conformity with European Union policies and norms in order to maximise the country's international competitiveness. While most of the EU policies are not contentious, police and judicial cooperation to international law enforcement and the taxation of savings are controversial, mainly because of possible side effects on bank secrecy.
Swiss and EU finance ministers agreed in June 2003 that Swiss banks would levy a withholding tax on EU citizens' savings income. The tax would increase gradually to 35% by 2011, with 75% of the funds being transferred to the EU. Recent estimates value EU capital inflows to Switzerland to $8.3 billion.
↑general government gross debt; gross debt consists of all liabilities that require payment or payments of interest and/or principal by the debtor to the creditor at a date or dates in the future; includes debt liabilities in the form of Special Drawing Rights (SDRs), currency and deposits, debt securities, loans, insurance, pensions and standardized guarantee schemes, and other accounts payable; all liabilities in the GFSM (Government Financial Systems Manual) 2001 system are debt, except for equity and investment fund shares and financial derivatives and employee stock options
↑Includes federal, cantonal and municipal accounts
↑Regina Wecker, "Frauenlohnarbeit - Statistik und Wirklichkeit in der Schweiz an der Wende zum 20," Jahrhundert Schweizerische Zeitschrift für Geschichte (1984) 34#3 pp 346-356.
↑Roman Studer, "When Did the Swiss Get so Rich?" Comparing Living Standards in Switzerland and Europe, 1800-1913, Journal of European economic history (2008) 37 (2), 405-452.
↑National report on the Swiss Energy regime, BARENERGY project of EU, "Archived copy"(PDF). Archived from the original(PDF) on 26 May 2012. Retrieved 22 January 2014.{{cite web}}: CS1 maint: archived copy as title (link)
↑"Swiss fortunes in 2011 have more than doubled since 2000 in dollar terms" Franc's rise puts Swiss top of rich list, Simon Bowers, The Guardian, 19 October 2011. CHF 500,000 in late 2007 corresponded to USD 403,000 (USD 252,000 PPP), in late 2011 to USD 540,000 (USD 380,000 PPP) and in 2015 to USD 510,000 (USD 400,000 PPP). Exchange rates: xe.com, PPP conversion: 1.601 (2007), 1.433 (2011), 1.275 (2015) oecd.org.
↑Tages Anzeiger, Das reichste Land der Welt (20 October 2011) reports 3,820 individuals with a wealth of USD 50 million or more, out of a total population of just above 8 million.
Tariffs applied by Switzerland as provided by ITC's Market Access MapArchived 3 December 2024 at the Wayback Machine , an online database of customs tariffs and market requirements
This page is based on this Wikipedia article Text is available under the CC BY-SA 4.0 license; additional terms may apply. Images, videos and audio are available under their respective licenses.