Economy of Peru

Last updated

Economy of Peru
San Isidro, Lima, Peru - Torre Begonias.jpg
Lima, the financial centre of Peru
Currency Peruvian sol (PEN, S/)
calendar year
Trade organizations
CPTPP, APEC, CAN, Pacific Alliance, WTO, Prosur, Mercosur (associate)
Country group
Statistics
GDP
  • Increase2.svg $268  billion (nominal, 2023) [3]
  • Increase2.svg $556.680 billion (PPP, 2023) [3]
GDP rank
GDP growth
  • Increase2.svg 2.7% (2022) [4]
  • Increase2.svg 2.4% (2023f) [4]
  • Increase2.svg 3.0% (2024f) [4]
GDP per capita
  • Increase2.svg $7,772 (nominal, 2023) [3]
  • Increase2.svg $16,132 (PPP, 2023) [3]
GDP per capita rank
GDP by sector
1.9% (2020 est.) [3]
Population below poverty line
Decrease Positive.svg 40.2 medium (2021, World Bank) [9]
Labor force
  • Increase2.svg 18,818,406 (2019) [12]
  • Decrease2.svg 65.5% employment rate (2018) [13]
Labor force by occupation

(2019) [14]

Unemployment
  • Increase Negative.svg 6.9% (2017 est.) note: data are for metropolitan Lima; widespread underemployment [5]
  • Decrease Positive.svg 3.6% (2012) [15]
Main industries
External
ExportsIncrease2.svg $44.92 billion (2017 est.) [5]
Export goods
(2018) [16]
Main export partners
ImportsIncrease2.svg $43.13 billion (2018) [16]
Import goods
[16]
Main import partners
FDI stock
  • Increase2.svg $98.24 billion (31 December 2017 est.) [5]
  • Increase2.svg Abroad: $5.447 billion (31 December 2017 est.) [5]
Increase2.svg −$2.414 billion (2017 est.) [5]
Decrease Positive.svg $66.25 billion (31 December 2017 est.) [5]
Public finances
Increase Negative.svg 25.4% of GDP (2017 est.) [5]
−3.1% (of GDP) (2017 est.) [5]
Revenues58.06 billion (2017 est.) [5]
Expenses64.81 billion (2017 est.) [5]
Economic aid$27.267 million (2018 est.) [17]
Increase2.svg $63.83 billion (31 December 2017 est.) [5]
Main data source: CIA World Fact Book
All values, unless otherwise stated, are in US dollars.

The economy of Peru is an emerging, mixed economy characterized by a high level of foreign trade and an upper middle income economy as classified by the World Bank. [22] Peru has the forty-seventh largest economy in the world by total GDP [23] and currently experiences a high human development index. [24] The country was one of the world's fastest-growing economies in 2012, with a GDP growth rate of 6.3%. [25] The economy was expected to increase 9.3% in 2021, in a rebound from the COVID-19 pandemic in Peru. [26] Peru has signed a number of free trade agreements with its main trade partners. China became the nation's largest trading partner following the China–Peru Free Trade Agreement signed on 28 April 2009. [27] Additional free trade agreements have been signed with the United States in 2006, [15] [28] Japan in 2011 [29] and the European Union in 2012. [30] Trade and industry are centralized in Lima while agricultural exports have led to regional development within the nation.

Contents

Peru's economy is dependent on commodity exports, making the economy at risk due to price volatility in the international markets. The Government of Peru displayed little interaction in the public sector throughout the nation's history since the economy frequently experienced commodities booms. The extraction of such commodities has brought conflict within the country due to its environmental and social impacts. [31]

Following the independence of Peru from the Spanish Empire, the economic elite focused their power on the coastal regions through centralismo , while the rural provinces were governed by existing serfdom practices by hacienda landowners. [32] [33] [34] This model essentially continued until 1968 when General Juan Velasco Alvarado took power, leading a dictatorship that increased social spending and removing the power of landowners, which resulted with a power vacuum in the 1970s that saw the rise of communist guerilla group Shining Path. [32] [33] Beginning in the 1980s, Peru faced economic difficulties as a result of the early 1980s recession and the internal conflict in Peru during its Lost Decade. The government of Alan García enacted price controls that resulted in hyperinflation. [31] In response, the armed forces of Peru drafted Plan Verde, an operation to create a neoliberal, open market economy. This was reportedly executed by the government of Alberto Fujimori, beside prescriptions from economist Hernando de Soto, during a period known as "Fujishock". [31] [35] [36] [37] During this shock, price controls were discontinued, the privatization of state-run organizations occurred and the promotion of foreign investments happened through the removal of regulations. [31] The economic measures of the Fujimori administration made the country macro-economically stable.

Development in Peru increased following the 2000s commodities boom while government finances, poverty reduction and progress in social sectors improved. [31] [38] [32] [39] The nation has more recently adopted the Lima Consensus, an economic ideology of neoliberalism, deregulation and free market policies that has made foreign portfolio investment in Peru attractive. [32] [39] [40] Inflation in 2012 was the lowest in Latin America at 1.8%, [41] with the most recent annual rate standing at 1.9% in 2020. [3] Though statistical poverty has decreased significantly – from nearly 60% in 2004 to 20.5% in 2018.

Peruvian economic performance has been tied to exports, which provide hard currency to finance imports and external debt payments, though in recent decades the economy has begun to diversify. [31] [42] Peru's main exports are copper, gold, zinc, textiles, chemicals, pharmaceuticals, manufactures, machinery, services and fish meal. The country's major trade partners are the United States, China, Brazil, the European Union and Chile. [43] Although exports have provided substantial revenue, self-sustained growth and a more egalitarian distribution of income have proven elusive. [44] Services account for 59.9% of Peruvian gross domestic product, followed by industry (32.7%) and agriculture (7.6%). [45] Recent economic growth has been fueled by macroeconomic stability, improved terms of trade, as well as rising investment and consumption. [46]

History

Historic GDP per capita in Peru Historic GDP per capita in Peru.svg
Historic GDP per capita in Peru

Inca Empire

The Tahuantinsuyo (the Realm of the Four Parts), popularly known as the Inca Empire was the largest civilization which arose from the highlands of Peru sometime in the early 13th century. The last Inca stronghold was conquered by the Spanish in 1572.

The Inca Empire employed central planning. Writing about the Inca tax system, Spanish chronicler Pedro Cieza de León said "the system the Incas employed was so good that the people did not feel it, and prospered ... [A]ll this was accomplished in such orderly fashion that neither did the natives fail to pay what they owed and were assessed, nor did those who collected these tributes venture to take one grain of corn in excess". [47] Officials would travel to cities and provinces where they would be provided quipus storing data, with Inca territories contributing what was possible; whether it be labor ( mit'a ), textiles, food, weapons or construction materials. [47] Regarding labor, provinces would provide men to be employed by the empire who required to be married so their wives could maintain home life. [47] Citizens were not exposed to overwork as individuals who became ill would be returned and replaced by their home province while many days of a month were dedicated to recreation and feasts. [47]

Viceroyalty of Peru

Bozal African in Lima, 1805 Phillips, Richard - Bozal - From The present state of Peru - 1805.jpg
Bozal African in Lima, 1805

The economy of the viceroyalty of Peru largely depended on the export of silver. [48] The huge amounts of silver exported from the viceroyalty of Peru and Mexico deeply affected Europe, where some scholars believe it caused the so-called price revolution. [49] Silver mining was carried out using contract and free wage labourers, [50] as well as the encomienda system of slavery. [51] The encomienda has been described as constituting genocide. [52] [53] [54] Under the Spanish system, Cieza de León wrote that "with the disorder and greed of the Spaniards, the number of the people has fallen off to such a degree that most of them have disappeared, and they will be wiped out completely as a result of the covetousness and greed". [47] Afro-Peruvians also appeared as a result of slavery in colonial Spanish America. [55] Silver production peaked in 1610. [49]

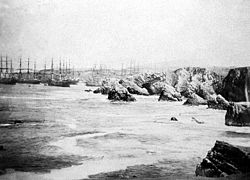
Prussian explorer Alexander von Humboldt first encountered guano in 1802 and started fertilizer research Callao in Peru, with his findings being reported throughout Europe. [56]

19th century

Guano Era

The Chincha Islands, a large source of guano, 1866 Carguio de guano en las islas Chincha..jpg
The Chincha Islands, a large source of guano, 1866

After winning independence from Spain on 28 July 1821, Peru was financially strapped. In addition, the economy suffered from the collapse of the silver mines. [57] However the guano trade with Europe beginning in the 1840s flushed Peru with European investments and money. In 1840, Peruvian politician and entrepreneur Francisco Quirós y Ampudia commercialized guano exports in a deal with French businessmen and the Peruvian government, abolishing existing claims to Peruvian guano; guano was essentially nationalized and became Peru's largest revenue source. [58] Despite the near exhaustion of guano, Peru achieved its greatest ever export of guano in 1870 at more than 700,000 tonnes (770,000 short tons). [59]

War of the Pacific

Chile was devastated by the Long Depression economic crisis of the 1870s [60] and began looking for a replacement for its silver, copper and wheat exports. [61] It has been argued that Chile's economic situation and the prospect of new wealth in nitrates were the true reasons for the Chilean elite to go to war against Peru and Bolivia, [61] [62] [63] with most historians agreeing that the Chilean government's expansionist foreign policy and its ambitions to control Atacama's mineral wealth led to the conflict . [64] [65] [66]

Chile won the war and with the Treaty of Ancón of 1884, the War of the Pacific ended. Chile obtained half of Peru's guano income from the 1880s and its guano islands, with Chile taking control over the most valuable nitrogen resources in the world. [67] Chile's national treasury would increase 900% from 1879 to 1902 due to the newly acquired lands. [68] Meanwhile, Peru's reliance on commodity exports – which continued through its history – resulted the bankruptcy of its economy. [32] Peru would go on to approve the Grace Contract, which granted ownership of Peru's railroads to holders of sovereign debt, with the Peruvian government not issuing new sovereign debt until 1906. [69]

20th century

Amazon rubber boom

Into the twentieth century, Anglo-Peruvian Amazon Rubber Co in Iquitos began to market rubber internationally. The rubber boom brought regions of Amazonia into the international market. [70] The Government of Peru ceded to the Anglo-Peruvian Amazon Rubber Co the Amazon territories north of Loreto, after the company's founder Julio César Arana purchased the land. During the rubber boom the Putumayo Genocide was committed by Anglo-Peruvian Amazon Rubber Co. Between 40,000 and 250,000 indigenous peoples were killed, with many being sent to labor camps; ninety percent of the affected Amazonian populations were annihilated. [71] [72] [73]

World War I and II eras

In the early 1910s, Peru enjoyed a growing economy due to mining and crop production, with a working class developing at the time. [74] Following the outbreak of World War I, international markets became turbulent and Peru experienced a recession and a series of coups occurred through the mid and late-1910s. [74] Augusto B. Leguía, a member of Peru's oligarchy, then took power through a coup and essentially assumed dictatorial powers, writing a new constitution; Leguía would often ignore the constitution through his acts, however. [74] [75] Víctor Raúl Haya de la Torre founded the American Popular Revolutionary Alliance (APRA) calling for reforms, though Leguía quickly banned the party. [74] Leguía increased spending to modernize Peru, though this also raised national debt and with the addition of the Great Depression in 1929, he was overthrown soon-after in 1930 by Luis Miguel Sánchez Cerro. [74]

Sánchez announced a debt moratorium on US$180 million and Peru was banned from markets in the United States as a result. [74] The Sánchez government also continued the repression of APRA, resulting in an Aprista party member assassinating Sánchez. [74] Óscar R. Benavides was chosen by the constituent assembly to finish Sánchez's term and intensified persecution of left-wing groups, resulting in increased support for the Peruvian Communist Party (PCP) among indigenous and labor groups. [74] As Peru's economy grew, a banker in Lima, Manuel Prado Ugarteche, was elected into the presidency in the 1939 Peruvian general election. [74]

President Prado adopted a softer tone on APRA while Aprista leader Haya de la Torre also espoused more moderate policy and support for foreign markets. [74] APRA was made a legal party in 1945 and in José Luis Bustamante y Rivero was elected the same year, making an Aprista politician the Minister of the Economy. [74] Subsequently, the Bustamante greatly increasedeconomic interventionism to include price controls and a foreign exchange controls, which appeared beside a slowing economy, resulting in increased inflation. [74]

Military juntas and first Belaúnde government

Over the next two decades, military juntas controlled Peru. On 29 October 1948, General Manuel A. Odría led a successful military coup against Bustamante and assumes the presidency until 1956. Odría's government experienced a growing economy due to a commodity boom, though many of the government's investments remained in coastal cities while unrest increased among interior and Andean regions that remained impoverished. [74] Haya de la Torre – whose APRA party had drifted even more to right-wing politics at this time – won the 1962 Peruvian general election against Fernando Belaúnde, founder of the right-wing Popular Action, though Haya de la Torre was unable to take office due to a military coup opposed to APRA.

After a brief military government, Belaúnde won the 1963 Peruvian general election, with his government making modest improvements by increasing industrialization and constructing highways into the Andes. [74] Belaúnde held a doctrine called "The Conquest of Peru by Peruvians", which promoted the exploitation of resources in the Amazon and other outlying areas of Peru through conquest. [76] In one 1964 incident called the Matsé genocide, the Belaúnde administration targeted the Matsés after two loggers were killed, with the Peruvian armed forces and American fighter planes dropping napalm on the indigenous groups armed with bows and arrows, killing hundreds. [76] [77] Belaúnde's economic measures were received with disapproval from rural and peasant Peruvians. [74] His government's reliance on resource exports, especially with the fishing industry, resulted in increased inflation and a growing deficit. [74] Amid this conflict, general Juan Velasco Alvarado overthrows the Belaúnde in the 1968 Peruvian coup d'état . [74]

Revolutionary Government of the Armed Forces

Velasco established the Revolutionary Government of the Armed Forces and it adopted a state capitalism economic policy amid a period of economic expansion. [34] The government immediately instituted land reform initiatives, establishing one of the most ambitious land tenure projects in the history of Latin America. [34] The land reform projects removed the traditional hacienda system that resembled landowners imposing a serfdom on peasants and replaced it with agricultural cooperatives called Agricultural Social-Interest Societies (SAIS). [34] The Velasco government took a structural approach; it invested in infrastructure and began a widespread nationalization campaign of key economic production sectors, education and the media. [74] [34] A fixed exchange rate system was adopted and the national debt began to increase dramatically. [34] A combination of debt, inflation and the 1973 oil crisis induced an economic crisis in the Velasco government, with General Francisco Morales-Bermúdez overthrowing Velasco in the Tacnazo. [74] [34]

Bermúdez in name led the Second Revolutionary Government of the Armed Forces, with his government introducing austerity measures and removing state capitalist systems. [74] [34] This government began monetary adjustment and started with negotiations on foreign debt. [34] However, corruption scandals and widespread protests broke out and the military government agreed to transition Peru back into a democratic political system. [34]

The Lost Decade

In 1980, after twelve years of military rule, Fernando Belaúnde Terry was elected president for a second time. [34] On the day of the election, Shining Path launched its armed struggle in Chuschi with a ballot burning incident, essentially beginning the internal conflict in Peru. [34] Belaúnde's used a floating exchange rate and used populist policies, primarily relying on key exports. [34] His government continued to reverse Velasco's existing policies and some economic liberalization. [34] However, Belaúnde's government could not develop a monetary policy, failed at managing state-run entities and faced a growing external debt, leaving Peru in a vulnerable state. [34]

Alan García was elected president in the 1985 Peruvian general election and the first Aprista president in over sixty years. His administration adopted a neo-structuralist economic policy, with the government funding the private sector to enhance economic performance, increasing welfare spending and instituting price controls; this resulted with temporary economic growth, though Peru's national debt grew dramatically. [34] By 1989, inflation reached almost 3,000 percent and 7,000 percent in 1990, with Peru experiencing a GDP loss of twenty-four percent in the last three years of García's tenure. [34] With the growing economic crisis and the terrorist Shining Path gaining territory in an armed conflict with the Peruvian government, the idea of a leader with a "heavy hand" became more attractive to Peruvians according to Gutiérrez Sanín and Schönwälder. [34]

The Peruvian armed forces grew frustrated with the inability of the García administration to handle the nation's crises and began to draft a plan to overthrow his government. [37] [78] According to Peruvian sociologist and political analyst Fernando Rospigliosi, Peru's business elites held relationships with the military planners, with Rospigliosi writing that businesses "probably provided the economic ideas which [the military] agreed with, the necessity of a liberal economic program as well as the installment of an authoritarian government which would impose order". [79] Thus, Plan Verde was drafted at the end of the García presidency; the objectives evolved into establishing a civilian-military government with a neoliberal economic policy.

Fujimori government

During his campaigning for the 1990 election, Alberto Fujimori expressed concern against the proposed neoliberal policies of his opponent Mario Vargas Llosa. [80] Peruvian magazine Oiga reported that following the election, the armed forces were unsure of Fujimori's willingness to fulfill their objectives outlined in Plan Verde and it was reported that the meeting held a negotiatory meeting with him to ensure that Fujimori followed their direction. [35] [81] After taking office, Fujimori abandoned the economic platform he promoted during his campaign, adopting more aggressive neoliberal policies than those espoused by Vargas Llosa, his competitor in the election. [82] Fujimori would go on to adopt many of the policies outlined in Plan Verde. [78] [79] Fujimori ultimately served as president from 28 July 1990 to 17 November 2000.

Fujimori is often credited with defeating the Shining Path terrorist group in Peru and restoring its macroeconomic stability. [83] [84] [85] [86] Fujimori's economic policy was largely adopted from the advice of Peruvian economist Hernando de Soto, who prescribed economic guidelines – including the loosening of economic regulation, the introduction of austerity measures and the use of neoliberal policies – that were ultimately adopted by the Fujimori administration and established in the 1993 Constitution of Peru. [87] [88] [89] [90] Although economic statistics show improved economic data in Peru in recent decades, the wealth earned between 1990 and 2020 was not distributed throughout the country; living standards showed disparities between the more-developed capital city of Lima and similar coastal regions while rural provinces remained impoverished. [91] [92]

21st century

Peru bonds
.mw-parser-output .legend{page-break-inside:avoid;break-inside:avoid-column}.mw-parser-output .legend-color{display:inline-block;min-width:1.25em;height:1.25em;line-height:1.25;margin:1px 0;text-align:center;border:1px solid black;background-color:transparent;color:black}.mw-parser-output .legend-text{}
30 year
20 year
15 year
10 year
5 year
2 year Peru bonds.webp
Peru bonds
  30 year
  20 year
  15 year
  10 year
  5 year
  2 year

Lima Consensus

Initially established by the Fujimori administration, the Lima Consensus focused on deregulation and privatization with the goal of establishing a neoliberal economy, all while limiting the involvement of the government in the public sector. [32] [39] As the Washington Consensus lost popularity in the 2000s, a more defined Lima Consensus began to emerge in Peru as the economy simultaneously improved during the 2000s commodities boom. [93] While Latin American governments invested into social programs for education, healthcare and poverty programs in the early 21st century, Peru under the Consensus chose to cut social programs. [33] [94] President Alejandro Toledo continued to promote the decentralization of Peru, [32] while the former social democrat Alan García took implementation of the consensus even further, adopting policies similar to Augusto Pinochet. [39] [93] Keiko Fujimori, the daughter of Alberto Fujimori, has been a major proponent for the Lima Consensus, using the support of neoliberal economist Hernando de Soto to support her position during her elections. [40] This lack of state intervention as promoted by the Consensus has resulted with a weak government with poor performance, with many Peruvians experiencing insufficient basic services such as education, justice and security while corruption, crime, crony capitalism and economic inequality increased as many political officials frequently moving between business and government positions without oversight. [33] [39]

Following the 2021 Peruvian general election that saw lefitst candidate Pedro Castillo elected into the presidency, Fitch Solutions warned that his election posed "substantial risks to the 'Lima Consensus', the investor-friendly economic policy framework that has persisted over the last 20 years". [95]

Sectors

Peru's economic activity in the 1970s Peru econ 1970.jpg
Peru's economic activity in the 1970s

Agriculture

Peru is a country with many climates and geographical zones that make it a very important agricultural nation. Peruvian agricultural exports are highly appreciated and include artichokes, grapes, avocados, mangoes, peppers, sugarcane, organic coffee and premium-quality cotton.

Peru is one of the 5 largest producers of avocado, blueberry, artichoke and asparagus, one of the 10 largest producers in the world of coffee and cocoa, one of the 15 largest producers in the world of potato and pineapple, and also has a considerable production of grape, sugarcane, rice, banana, maize and cassava; its agriculture is considerably diversified. [96]

In 2018, Peru produced 10.3 million tons of sugarcane, 5.1 million tons of potato, 3.5 million tons of rice, 2.2 million tons of banana, 1.5 million tons of maize, 1.2 million tons of cassava, 921 thousand tons of palm oil, 645 thousand tons of grape, 548 thousand tons of pineapple, 504 thousand tons of avocado, 481 thousand tons of tangerine, 502 thousand tons of orange, 369 thousand tons of coffee, 383 thousand tons of mango, 360 thousand tons of asparagus, 270 thousand tons of lemon, 252 thousand tons of tomato, 207 thousand tons of barley, 195 thousand tons of wheat, 188 thousand tons of olives, 187 thousand tons of carrots, 175 thousand tons of papaya, 175 thousand tons of pepper, 154 thousand tons of artichoke, 140 thousand tons of apple, 134 thousand tons of cocoa, in addition to smaller productions of other agricultural products. [97]

Industry and services

Extraction

Natural gas separation plant of the Camisea Gas Project in La Convencion Province, Cuzco. MINISTRO VALAKIVI VISITO EL EJE ENERGETICO DE LA CONVENCION EN EL CUSCO (VRAEM) (19935504733).jpg
Natural gas separation plant of the Camisea Gas Project in La Convención Province, Cuzco.
Fishing fleet in Ferrol Bay near Chimbote. In the middle of the 20th century, its port became the one with the largest fishing production on the planet. Chimbote 02.jpg
Fishing fleet in Ferrol Bay near Chimbote. In the middle of the 20th century, its port became the one with the largest fishing production on the planet.

Fishing: Peru is an international leader in fishing, producing nearly 10 percent of the world's fish catch.

Mining is a major pillar of the Peruvian economy. In 2019, the country was the 2nd largest world producer of copper [98] and silver, [99] 8th largest world producer of gold, [100] 3rd largest world producer of lead, [101] 2nd largest world producer of zinc, [102] 4th largest world producer of tin, [103] 5th largest world producer of boron [104] and 4th largest world producer of molybdenum. [105] The country was once the world's largest producer of silver and was also one of the five largest gold producers in the world.

Manufacturing

Peru has developed a medium manufacturing sector. The sector now represents 23 percent of GDP and is tied heavily to mining, fishing, agriculture, construction and textiles. Manufacturing is mainly devoted to processing to gain a value-added advantage. The most promising sector is textiles, metal mechanics, food industry, agricultural industry, manufactures, chemicals, pharmaceuticals, machinery and services.

Services

Tourism has represented a new growth industry in Peru since the early 1990s, with the government and private sector dedicating considerable energies to boosting the country's tourist destinations both to Peruvians and foreigners.

Natural resources

Peru's natural resources are copper, silver, gold, timber, fish, iron ore, coal, phosphate, potash, and natural gas.

External trade and investment

Foreign investment and balance of payments

Foreign trade and balance of payments

In 2001 the current account deficit dropped to about 2.2% of GDP (US$1.17 billion)--from 3.1% in 2000—while the trade balance registered a small deficit. Exports dropped slightly to $7.11 billion, while imports fell 2.1% to $7.20 billion. After being hit hard by El Niño in 1998, fisheries exports have recovered, and minerals and metals exports recorded large gains in 2001 and 2002, mostly as a result of the opening of the Antamina copper-zinc mine. By mid-2002, most sectors of the economy were showing gains. After several years of substantial growth, foreign direct investment not related to privatization fell dramatically in 2000 and 2001, as well as in the first half of 2002. Net international reserves at the end of May 2002 stood at $9.16 billion, up from $8.6 billion (2001), $17 billion at the end of 2006, over $20 billion in 2007, and over $35 billion in May 2008. Peru has signed a number of free trade agreements, including the 2007 United States-Peru Trade Promotion Agreement, and agreements with Chile, Canada, Singapore, Thailand and China. Under President Alan Garcia administration Peru achieved a bilateral trade agreement with U.S. since 2010 to improve exports for its country and reach in August 2011 its pick in exports of more than 4,700 MM.

Foreign investment

The Port of Callao is Peru's gateway for exports and imports Puerto de Callao.jpg
The Port of Callao is Peru's gateway for exports and imports

The Peruvian government actively seeks to attract both foreign and domestic investment in all sectors of the economy. International investment was spurred by the significant progress Peru made during the 1990s toward economic, social, and political stability, but it slowed again after the government delayed privatizations and as political uncertainty increased in 2000. President Alejandro Toledo has made investment promotion a priority of his government. While Peru was previously marked by terrorism, hyperinflation, and government intervention in the economy, the Government of Peru under former President Alberto Fujimori took the steps necessary to bring those problems under control. Democratic institutions, however, and especially the judiciary, remain weak.

The Government of Peru's economic stabilization and liberalization program lowered trade barriers, eliminated restrictions on capital flows, and opened the economy to foreign investment, with the result that Peru now has one of the most open investment regimes in the world. Between 1992 and 2001, Peru attracted almost $17 billion in foreign direct investment, after negligible investment until 1991, mainly from Spain (32.35%), [106] the United States (17.51%), Switzerland (6.99%), Chile (6.63%), and Mexico (5.53%). The basic legal structure for foreign investment in Peru is formed by the 1993 constitution, the Private Investment Growth Law, and the November 1996 Investment Promotion Law. Although Peru does not have a bilateral investment treaty with the United States, it has signed an agreement (1993) with the Overseas Private Investment Corporation (OPIC) concerning OPIC-financed loans, guarantees, and investments. Peru also has committed itself to arbitration of investment disputes under the auspices of ICSID (the World Bank'sInternational Center for the Settlement of Investment Disputes) or other international or national arbitration tribunals.

Currency

The sol is the currency of Peru. The exchange rate as of 1 February 2022 is 3.83 soles to the US dollar and 4.31 soles to the Euro. It was instated in 1991, when the Peruvian government abandoned the inti due to hyperinflation of the currency; the sol has since maintained the lowest inflation rate in Latin America. [107] The sol replaced the inti at a rate of 1 nuevo sol = 1,000,000 intis. [108] The inti itself replaced another inflated currency, the sol, which was used between 1863 and 1985. The name sol comes from the Latin solidus , and is also the Spanish word for "sun", which the ancient Inca civilization worshiped as the god Inti.

The sol currently enjoys a low inflation rate of 2.5%. [41] Since it was put into use, the sol's exchange rate with the United States dollar has stayed mostly between 2.80 and 3.30 to 1. Out of all the currencies of the Latin American region, the sol is the most stable and reliable, being the least affected by the downturn in the value of the US dollar; during late 2007 and early 2008, the exchange rate fell to 2.69 to 1, which had not been seen since 1997. The exchange rate is set on a daily basis by the Banco Central de Reserva del Perú (Central Reserve Bank of Peru).

The sol is divided into 100 céntimos. The highest-denomination banknote is the 200 soles note; the lowest-denomination coin is the rarely used 5 céntimos coin.

Income and consumption

Peru divides its population into five socio-economic classes, A-E, with A representing the rich; B, the upper middle class; C, the middle class; D, the working class and low income families; and E, the marginalized poor. In 2018, the segments were described as "crude" by Miguel Planas of the Ministry of Finance due to the complicated structure of the society in Peru, where some classes make money off of illegal trade which aren't counted in the GDP, and are thus falsely classified as low income or marginalised poor families.

Employment

Unemployment in Greater Lima is 5.6%, while for the rest of Peru is 7%. FY 2012–2013 [109]

Greater depth

The Lima Stock Exchange Bolsa de Valores, Lima, Peru, 2015-07-28, DD 101.JPG
The Lima Stock Exchange

From 1994 through 1998, under the government of Alberto Fujimori, the economy recorded robust growth driven by foreign direct investment, almost 46% of which was related to the privatization program. The government invested heavily on the country's infrastructure, which became a solid foundation for the future of the Peruvian economy.[ citation needed ] The economy stagnated from 1998 through 2001, the result of the century's strongest El Niño weather phenomenon, global financial turmoil, political instability, a stalled privatization program, increased government intervention in markets[ citation needed ], and worsening terms of trade. President Alejandro Toledo implemented a recovery program after taking office, maintained largely orthodox economic policies, and took measures to attract investment, including restarting the privatization program. Nonetheless, political uncertainty led to GDP growth of 0.2% in 2001.[ citation needed ] The Lima Stock Exchange general index fell 34.5% in 2000 and 0.2% in 2001.[ citation needed ] Inflation remained at record lows, registering 3.7% in 2000.[ citation needed ]

The year 2001 saw deflation of 0.1%. The government's overall budget deficit rose sharply in 1999 and 2000 to 3.2% of GDP, the result of hikes in government salaries, expenditures related to the 2000 election campaign, higher foreign debt service payments, and lower tax revenues.[ citation needed ] The government brought the deficit down to 2.5% of GDP in 2001, and set a target of 1.9% of GDP for 2002. Peru's stability brought about a substantial reduction in underemployment, from an average of 74% from the late 1980s through 1994 to 43% in the 1995–96 period, but the rates began climbing again in 1997–2002 to over half the working population. The poverty rate remained at 54% in 2001, with 24% of Peruvians living in extreme poverty. In 2005, 18% of Peruvians were living in extreme poverty and a poverty rate at 39%. [110] As of 2010, around 30% of its total population is poor. [111]

Outlook

The virtues of today's new multi-polar world for Peru are many. At 30 million people, Peru is neither too small to matter nor so big it is going to be a power in its own right. Midsized states, benefits from a world where it is no longer mandatory to pick a big-power patron.

With expanding ports loading up boats to China on one side, and a new superhighway to Brazil on the other, along with a free trade agreement with the United States in its hip pocket, Peru seems well-positioned to prosper in the coming years. But former President Toledo may not be hyperbolic when he worries the future stability of the state may depend on its willingness to distribute wealth more evenly.

Forecasts for the medium- and long-term remain highly positive. Peru's real GDP growth in 2007 was (8.3%) and largest in Latin America in 2008 was an outstanding 9.8%, the highest in the world. [112] Inflation remained low, at about 3%, while the budget surplus is expected to remain at about 1% of GDP.[ citation needed ] Private investment should keep growing at a rate of 15% a year.[ citation needed ] Exports and imports are expected to keep rising.[ citation needed ] The unemployment and underemployment indexes (5.2% and 34%, respectively, in Lima) should keep coming down as the economy grows[ citation needed ], other cities in Peru like Cajamarca, Ica, Cuzco and Trujillo are starting to show less unemployment nowadays.[ citation needed ] The country is likely to attract future domestic and foreign investment in tourism, agriculture, mining, petroleum and natural gas, power industries and financial institutions. According to the IMF and the World Bank, Peruvian GDP economic growth between 2007 and 2013 was:

In 2007 at 8.9%, in 2008 at 9.7%, in 2009 at 0.9%, in 2010 at 8.6%, in 2011 at 6.0%, in 2012 at 6,3% and in 2013 at 5.3%.

Therefore, Peruvian GDP grew in the 2007–2013 6 years period an outstanding net growth of 45.7% or a 7.61% yearly average. The IMF forecast for Peru's economic growth for the next 6 years 2013–2019 is a 7% yearly growth.

In FY 2011 for the first time since 1991 the size of the Peruvian economy surpassed the Chilean economy. Peru now is the fifth major economy in South America and is expected to become the fourth South American economy in 2018 by surpassing Venezuela.

Private investment reached 25% of the GDP in 2007, and has remained stable through 2010; and inflation is under control at an average 2% per year for the next 5 years. International Debt will reach 25% of the GDP by 2010, down from 35% in 2006, and will be only 12% of the GDP by 2015.[ citation needed ] The International Monetary Reserves of the National Reserve Bank (Dollar, Euro, Yen, Gold, and other currencies) reached US$27 billion by the end of 2007, and US$31 billion at the end of 2008. Currently reserves are at a US$73 billion level for end of FY 2013, which more than doubles the total foreign debt of Peru which is US$30 billion at the end of FY 2013.

Exports are growing at a pace of 25% and reached US$28 billion at the end of 2007 and US$30 billion at the end of 2010. In FY 2012 Peruvian exports reached a total of US$46 billion.

High technological investment is growing fast in Peru, and will be 10% of the GDP by 2010.[ citation needed ]

Narcotics

Background

Coca has a long history of cultivation in the Andes, and has always been a traditional part of Peruvian life. However, the narcotic properties of coca were known only locally until 1786, when Lamarck listed the leaf in his botanical encyclopedia. [113] After the arrival of the Spanish, coca cultivation increased and its use became more common and widespread. [114] Since 1543, coca has been internationally recognized for its trading value, and regulations imposed upon it have attached increasing economic importance to the plant. [114] Exchange of the coca leaf between consumers in the highlands and growers in the low-lying hills has gone on for at least the last millennium, strengthening local economic ties. [115] Between 1884 and 1900, coca and cocaine grew in popularity for medical purposes and mass consumption in the United States. From 1905 to 1922, anti-cocaine sentiments in the US resulted in criminalization of both coca and cocaine. It was not until the 1920s that US diplomats began to extend drug prohibitions internationally. [116]

The Peruvian coca and cocaine industry is as huge as it is today because of advanced industrial nations’ demand for drugs. This high demand has created a framework of dependence on "coca-dollars" and on US drug policy. [117] Money from cocaine trafficking feeds local economies, supports inflation, and even causes social changes such as cocaine smoking among indigenous Peruvians. [118] Coca farming today is still a significant source of income for peasants, as it accounts for 48% of total net family income in the high coca-growing Apurímac River region. [119] In an effort to reduce drug use in America, for the past 50 years the US government together with the United Nations have been waging a war on drugs. [113] The US Drug Control Program maintains that "eliminating the cultivation of illicit coca and opium is the best approach to combating cocaine and heroin availability in the US." [120]

With US government cooperation, the Peruvian Government installed the National Plan for the Prevention and Control of Drugs in 1995. [119] This government prohibition of narcotics trafficking in Peru has resulted in a 70% reduction of coca leaf cultivation since 1995. However the reduction in cultivation may not have actual effects on cocaine production, as recent advances in coca growing and more efficient processing methods allow for greater cocaine yield. [121] The size of the narcotics industry as a part of the national economy is difficult to measure, but estimates range from $300–$600 million. An estimated 200,000 Peruvian households have economies based on the production, refining, or distribution of coca. [119] Many economists believe that large flows of dollars into the banking system contribute to the traditional depression of the dollar exchange rate vis-a-vis the sol. [ citation needed ] The Central Bank engages in open market activities to prevent the price of the sol from rising to levels that would cause Peruvian exports to become prohibitively expensive.

Hurt economically by Peruvian Air Force interdiction efforts in the mid-1990s,[ citation needed ] drug traffickers are now using land and river routes as well as aircraft to transport cocaine paste and, increasingly, refined cocaine to consumers around and out of the country. The Air Bridge Denial Program was suspended in April 2001 after the Peruvian Air Force and strength of the U.S. DEA misidentified a civilian aircraft as a drug trafficker and shot it down, killing two American citizens on board. Peru continues to arrest drug traffickers and seize drugs and precursor chemicals, destroy coca labs, disable clandestine airstrips, and prosecute officials involved in narcotics corruption.

Working with limited aid of the U.S. Agency for International Development (USAID), the Peruvian Government carries out alternative development programs in the leading coca-growing areas in an effort to convince coca farmers not to grow that crop. Although the government previously eradicated only coca seed beds, in 1998 and 1999 it began to eradicate mature coca being grown in national parks and elsewhere in the main coca growing valleys. In 1999 the government eradicated more than 150 km2 of coca; this figure declined to 65 km2 in 2000, due largely to political instability.[ citation needed ] The government agency "Contradrogas", founded in 1996, facilitates coordination among Peruvian Government agencies working on counter-narcotics issues. Alternative crops, however, are not economically comparable to coca. 2004 prices indicate an annual income per hectare of $600 for coffee and $1000 for cocoa, versus up to $7500 for a hectare of coca. [122]

Effect on family economies

The anti-coca policies imposed in 1995 have had adverse effects on Peruvian's household economies. Many families dependent on coca farming have been forced to send their children to work as eradication of crops has decreased their household income. [119] In states where coca is grown, child labour increased by 18% in 1997 and 40% in 2000. Work hours and domestic work increased as well, with girls taking on 28% more domestic work with boys doing 13% more. Wage work for adults also increased since 1995. As such, it can be inferred that the increase in child labour since eradication policies have come into effect is caused by children filling in for working parents. [119] However, the issue of child labour in cocoa production is still present in Peru as reported in 2013 in the U.S. Department of Labor's report Findings on the Worst Forms of Child Labor and in December 2014, in the Bureau of International Labor Affairs's List of Goods Produced by Child Labor or Forced Labor .[ citation needed ]

Corruption

Peru is the 101st least corrupt country in the world according to Transparency International's Corruption Perceptions Index.

The Peruvian organization "Ciudadanos al Dia" has started to measure and compare transparency, costs, and efficiency in different government departments in Peru. It annually awards the best practices which has received widespread media attention. This has created competition among government agencies to improve. [123]

A recent case of corruption was the 2008 oil scandal.[ citation needed ]

Statistics

Main economic indicators

The following table shows the main economic indicators in 1980–2021 (with IMF staff stimtates in 2022–2027). Inflation below 5% is in green. [124]

YearGDP

(in Bil. US$PPP)

GDP per capita

(in US$ PPP)

GDP

(in Bil. US$nominal)

GDP per capita

(in US$ nominal)

GDP growth

(real)

Inflation rate

(in Percent)

Unemployment

(in Percent)

Government debt

(in % of GDP)

198053.93,111.320.21,164.8Increase2.svg7.7%Increase Negative.svg59.1%7.3%n/a
1981Increase2.svg62.3Increase2.svg3,503.5Increase2.svg24.4Increase2.svg1,373.1Increase2.svg5.5%Increase Negative.svg75.4%Decrease Positive.svg6.8%n/a
1982Increase2.svg65.9Increase2.svg3,618.9Decrease2.svg24.3Decrease2.svg1,332.5Decrease2.svg-0.3%Increase Negative.svg64.5%Decrease Positive.svg6.4%n/a
1983Decrease2.svg62.1Decrease2.svg3,329.7Decrease2.svg18.9Decrease2.svg1,011.7Decrease2.svg-9.3%Increase Negative.svg111.1%Increase Negative.svg9.0%n/a
1984Increase2.svg66.8Increase2.svg3,498.4Increase2.svg19.4Increase2.svg1,018.8Increase2.svg3.8%Increase Negative.svg110.2%Decrease Positive.svg8.9%n/a
1985Increase2.svg70.3Increase2.svg3,601.1Decrease2.svg16.8Decrease2.svg861.6Increase2.svg2.1%Increase Negative.svg163.4%Decrease Positive.svg4.6%n/a
1986Increase2.svg80.4Increase2.svg4,026.1Increase2.svg25.2Increase2.svg1,263.7Increase2.svg12.1%Increase Negative.svg77.9%Increase Negative.svg5.3%n/a
1987Increase2.svg88.8Increase2.svg4,346.5Increase2.svg41.7Increase2.svg2,040.7Increase2.svg7.7%Increase Negative.svg85.8%Decrease Positive.svg4.8%n/a
1988Decrease2.svg83.3Decrease2.svg3,987.4Decrease2.svg33.0Decrease2.svg1,579.5Decrease2.svg-9.4%Increase Negative.svg667.0%Decrease Positive.svg4.2%n/a
1989Decrease2.svg74.9Decrease2.svg3,512.3Increase2.svg40.7Increase2.svg1,908.5Decrease2.svg-13.4%Increase Negative.svg3398.3%Increase Negative.svg7.9%n/a
1990Decrease2.svg73.8Decrease2.svg3,388.6Decrease2.svg28.3Decrease2.svg1,301.5Decrease2.svg-5.1%Increase Negative.svg7481.7%Increase Negative.svg8.3%n/a
1991Increase2.svg77.9Increase2.svg3,510.0Increase2.svg34.0Increase2.svg1,530.7Increase2.svg2.2%Increase Negative.svg409.5%Decrease Positive.svg5.9%n/a
1992Increase2.svg79.3Decrease2.svg3,501.8Increase2.svg35.4Increase2.svg1,562.6Decrease2.svg-0.5%Increase Negative.svg73.5%Increase Negative.svg9.4%n/a
1993Increase2.svg85.4Increase2.svg3,702.0Decrease2.svg34.3Decrease2.svg1,487.9Increase2.svg5.2%Increase Negative.svg48.6%Increase Negative.svg9.9%n/a
1994Increase2.svg98.0Increase2.svg4,169.0Increase2.svg43.2Increase2.svg1,839.2Increase2.svg12.3%Increase Negative.svg23.7%Decrease Positive.svg8.8%n/a
1995Increase2.svg107.4Increase2.svg4,490.8Increase2.svg51.4Increase2.svg2,147.4Increase2.svg7.4%Increase Negative.svg11.1%Decrease Positive.svg7.1%n/a
1996Increase2.svg112.5Increase2.svg4,619.6Increase2.svg53.4Increase2.svg2,193.7Increase2.svg2.8%Increase Negative.svg11.5%Increase Negative.svg7.2%n/a
1997Increase2.svg121.8Increase2.svg4,918.8Increase2.svg56.3Increase2.svg2,272.4Increase2.svg6.5%Increase Negative.svg8.5%Increase Negative.svg8.6%n/a
1998Increase2.svg122.7Decrease2.svg4,873.1Decrease2.svg53.9Decrease2.svg2,141.1Decrease2.svg-0.4%Increase Negative.svg7.3%Decrease Positive.svg6.9%n/a
1999Increase2.svg126.3Increase2.svg4,936.0Decrease2.svg48.7Decrease2.svg1,903.9Increase2.svg1.5%Increase2.svg3.5%Increase Negative.svg9.4%n/a
2000Increase2.svg132.6Increase2.svg5,105.1Increase2.svg50.4Increase2.svg1,940.2Increase2.svg2.7%Increase2.svg3.8%Decrease Positive.svg7.8%44.9%
2001Increase2.svg136.5Increase2.svg5,176.0Increase2.svg51.0Decrease2.svg1,935.5Increase2.svg0.6%Increase2.svg2.0%Increase Negative.svg9.2%Decrease Positive.svg43.8%
2002Increase2.svg146.2Increase2.svg5,466.1Increase2.svg54.0Increase2.svg2,017.8Increase2.svg5.5%Increase2.svg0.2%Increase Negative.svg9.4%Increase Negative.svg45.5%
2003Increase2.svg155.3Increase2.svg5,728.1Increase2.svg58.5Increase2.svg2,159.7Increase2.svg4.2%Increase2.svg2.3%Steady2.svg9.4%Increase Negative.svg49.4%
2004Increase2.svg167.3Increase2.svg6,093.4Increase2.svg66.1Increase2.svg2,408.1Increase2.svg5.0%Increase2.svg3.7%Steady2.svg9.4%Decrease Positive.svg46.7%
2005Increase2.svg183.4Increase2.svg6,595.2Increase2.svg74.2Increase2.svg2,669.2Increase2.svg6.3%Increase2.svg1.6%Increase Negative.svg9.6%Decrease Positive.svg40.4%
2006Increase2.svg203.3Increase2.svg7,222.1Increase2.svg87.5Increase2.svg3,106.7Increase2.svg7.5%Increase2.svg2.0%Decrease Positive.svg8.5%Decrease Positive.svg34.9%
2007Increase2.svg226.6Increase2.svg7,955.7Increase2.svg102.2Increase2.svg3,587.8Increase2.svg8.5%Increase2.svg1.8%Decrease Positive.svg8.4%Decrease Positive.svg31.9%
2008Increase2.svg252.0Increase2.svg8,748.4Increase2.svg121.3Increase2.svg4,209.0Increase2.svg9.1%Increase Negative.svg5.8%Steady2.svg8.4%Decrease Positive.svg28.0%
2009Increase2.svg256.4Increase2.svg8,801.7Increase2.svg121.8Decrease2.svg4,179.7Increase2.svg1.1%Increase2.svg2.9%Steady2.svg8.4%Increase Negative.svg28.3%
2010Increase2.svg281.1Increase2.svg9,541.6Increase2.svg148.9Increase2.svg5,055.5Increase2.svg8.3%Increase2.svg1.5%Decrease Positive.svg7.9%Decrease Positive.svg25.3%
2011Increase2.svg305.1Increase2.svg10,239.4Increase2.svg170.9Increase2.svg5,736.1Increase2.svg6.3%Increase2.svg3.4%Decrease Positive.svg7.7%Decrease Positive.svg23.0%
2012Increase2.svg318.4Increase2.svg10,567.0Increase2.svg193.1Increase2.svg6,407.6Increase2.svg6.1%Increase2.svg3.7%Decrease Positive.svg6.8%Decrease Positive.svg21.1%
2013Increase2.svg338.7Increase2.svg11,115.3Increase2.svg202.6Increase2.svg6,647.5Increase2.svg5.9%Increase2.svg2.8%Decrease Positive.svg5.9%Decrease Positive.svg19.9%
2014Increase2.svg349.9Increase2.svg11,356.0Increase2.svg202.9Decrease2.svg6,584.0Increase2.svg2.4%Increase2.svg3.2%Steady2.svg5.9%Increase Negative.svg20.6%
2015Increase2.svg356.8Increase2.svg11,454.4Decrease2.svg192.0Decrease2.svg6,164.2Increase2.svg3.3%Increase2.svg3.5%Increase Negative.svg6.5%Increase Negative.svg24.0%
2016Increase2.svg378.5Increase2.svg12,019.8Increase2.svg195.5Increase2.svg6,207.4Increase2.svg4.0%Increase2.svg3.6%Increase Negative.svg6.7%Increase Negative.svg24.3%
2017Increase2.svg402.0Increase2.svg12,631.7Increase2.svg215.7Increase2.svg6,776.9Increase2.svg2.5%Increase2.svg2.8%Increase Negative.svg6.9%Increase Negative.svg25.2%
2018Increase2.svg428.0Increase2.svg13,307.2Increase2.svg226.8Increase2.svg7,051.6Increase2.svg4.0%Increase2.svg1.3%Decrease Positive.svg6.7%Increase Negative.svg26.0%
2019Increase2.svg445.4Increase2.svg13,430.2Increase2.svg232.3Decrease2.svg7,006.3Increase2.svg2.2%Increase2.svg2.1%Decrease Positive.svg6.6%Increase Negative.svg26.9%
2020Decrease2.svg401.1Decrease2.svg11,975.3Decrease2.svg205.8Decrease2.svg6,145.0Decrease2.svg-11.0%Increase2.svg1.8%Increase Negative.svg13.9%Increase Negative.svg35.0%
2021Increase2.svg474.4Increase2.svg14,022.8Increase2.svg225.9Increase2.svg6,678.9Increase2.svg13.6%Increase2.svg4.0%Decrease Positive.svg10.9%Increase Negative.svg36.4%
2022Increase2.svg521.8Increase2.svg15,273.2Increase2.svg239.3Increase2.svg7,004.8Increase2.svg2.7%Increase Negative.svg7.5%Decrease Positive.svg7.6%Decrease Positive.svg34.8%
2023Increase2.svg554.5Increase2.svg16,067.4Increase2.svg253.8Increase2.svg7,353.4Increase2.svg2.6%Increase2.svg4.4%Decrease Positive.svg7.5%Increase Negative.svg35.7%
2024Increase2.svg584.2Increase2.svg16,762.7Increase2.svg266.8Increase2.svg7,655.6Increase2.svg3.2%Increase2.svg2.5%Decrease Positive.svg7.4%Steady2.svg35.7%
2025Increase2.svg613.5Increase2.svg17,428.4Increase2.svg279.7Increase2.svg7,945.5Increase2.svg3.1%Increase2.svg2.1%Decrease Positive.svg7.3%Decrease Positive.svg35.7%
2026Increase2.svg644.0Increase2.svg18,111.8Increase2.svg293.2Increase2.svg8,246.5Increase2.svg3.0%Increase2.svg2.0%Decrease Positive.svg7.2%Decrease Positive.svg35.2%
2027Increase2.svg676.1Increase2.svg18,828.5Increase2.svg307.4Increase2.svg8,560.9Increase2.svg3.0%Increase2.svg2.0%Decrease Positive.svg7.0%Decrease Positive.svg34.3%
Peru's poverty rate from 2004 to 2012. Poverty Rate in Peru 2004 to 2012.png
Peru's poverty rate from 2004 to 2012.

Household income or consumption by percentage share:
lowest 10%: 0.8%
highest 10%: 37.5% (2000)

Inflation rate (consumer prices): 2.08% (2010)

Budget:
revenues: $57 billion (2014 est.)
expenditures: $50 billion, including long-term capital expenditures of $3.8 billion (2010 est.)

Industrial production growth rate: 12% (2013 est.)

Electricity – production: 175,500 GWh (2013 est.)

Electricity – production by source:
natural gas: 44.53%
hydro: 54.79%
nuclear: 0%
other: 0.68% (2013)

Electricity – consumption: 133,000 GWh (2013)

Electricity – exports: 32,000 kWh (2013) mainly to Ecuador

Electricity – imports: 0 kWh (2013)

Agriculture – products: coffee, cotton, sugarcane, rice, wheat, potatoes, plantains, coca; poultry, beef, dairy products, wool; fish

Exports: 63.5 billion f.o.b. (2013 est.) of goods and products. 10.5 billion f.o.b. (2013 est.) of services. Total Exports $73.5 billion f.o.b. (2013) Exports: fish and fish products, copper, zinc, gold, molybdenum, iron, crude petroleum and byproducts, lead; coffee, asparagus, artichokes, paprika, sugar, cotton, textiles, chemicals, pharmaceuticals, manufactures, machinery, services.

Exports – partners: Mainland China 20%, United States 15%, European Union 15%, Brazil 10%, Chile 10%, Japan 5%, Mexico 5%, United Kingdom 5%, Bolivia 5% Rest of Latin America 5%, Rest of world 5%, (2013)

Imports: Total Imports $68 billion f.o.b. (2013)

Imports – commodities: machinery, transport equipment, foodstuffs, iron and steel, pharmaceuticals, electronics, petroleum and chemicals.

Imports – partners: Mainland China 25%, US 15%, European Union 15%, Brazil 10%, Japan 10%, Chile 5%, Colombia 5%, Mexico 5%, Ecuador 4%, Bolivia 1%, Rest of World 5% (2013).

Trade agreements

According to the Ministry of Foreign Trade and Tourism, Peru decided to negotiate trade agreements to consolidate the access of Peruvian exports to its most important markets by giving them permanent benefits unlimited in time and coverage as opposed to temporary commercial preferences given unilaterally by certain countries; a system that did not allow Peruvian exporters embark in long-term export-related investments. [125]

Economic Complementation Agreement

FTA (Free Trade Agreement) currently in force
FTA (Free Trade Agreement) concluded
FTA (Free Trade Agreement) in negotiation

Peru – United States Trade Promotion Agreement

The United States – Peru Trade Promotion Agreement (Spanish: Tratado de Libre Comercio Perú – Estados Unidos) is a bilateral free trade agreement, whose objectives are eliminating obstacles to trade, consolidating access to goods and services and fostering private investment in and between the United States and Peru. Besides commercial issues, it incorporates economic, institutional, intellectual property, labor and environmental policies, among others. The agreement was signed on 12 April 2006; ratified by the Peruvian Congress on 28 June 2006; by the U.S. House of Representatives on 2 November 2007 and by the U.S. Senate on 4 December 2007. The agreement was implemented on 1 February 2009. [144]

Peru looks to the agreement are to:

The United States looks to the agreement to:

The U.S.-Peru agreement has faced criticism. In Peru, the treaty was championed by Toledo, and supported to different extents by former President Alan García and candidates Lourdes Flores and Valentín Paniagua. Ollanta Humala has been its most vocal critic. Humala's Union for Peru won 45 of 120 seats in Congress in 2006, the largest share by a single party, prompting debate on ratification of the agreement before the new legislature was sworn in. Some Congressmen-elect interrupted the debate after forcibly entering Congress in an attempt to stop the agreement ratification. [146]

One controversial element of the agreement relates to land resources. Laura Carlsen, of the Center for International Policy, who is also a contributor to Foreign Policy in Focus notes that "Indigenous organizations warn that this ruling effectively opens up 45 million hectares to foreign investment and timber, oil, and mining exploitation." [147]

However, most of the criticism of the agreement has focused on its potential impact on Peru's agricultural sector. By planting crops to similar to those subsidized by the U.S., Peru faced a competitive disadvantage in the production of agricultural products because poor farming families with inadequate tools, technology and techniques may not be able to produce crops at low enough prices to export. In response to these concerns, Peruvian lawmakers created a Compensation Fund which directed $34 million per year to cotton, maize/corn, and wheat producers for a five-year period to help them adjust to the new competitive pressures. [148]

Toledo is therefore a market-oriented politician who continued to globalize Peru's economy and is rumored to be getting ready for another run for president. Toledo says bluntly that unless the poorest in the country are better educated, better paid, housed, and fed, the Peruvian economic miracle will stall.

See also

Notes

  1. "World Economic Outlook Database, April 2019". IMF.org. International Monetary Fund . Retrieved 29 September 2019.
  2. "World Bank Country and Lending Groups". World Bank. Retrieved 29 September 2019.[ permanent dead link ]
  3. 1 2 3 4 5 6 "Report for Selected Countries and Subjects: April 2023". imf.org. International Monetary Fund.
  4. 1 2 3 "The outlook is uncertain again amid financial sector turmoil, high inflation, ongoing effects of Russia's invasion of Ukraine, and three years of COVID". International Monetary Fund . 11 April 2023.
  5. 1 2 3 4 5 6 7 8 9 10 11 12 "CIA World Factbook". Central Intelligence Agency . Retrieved 2 January 2019.
  6. Gestión, Redacción (11 July 2019). "Perú fue el país con mayor reducción de la pobreza multidimensional en la última década". Gestión (in Spanish). Retrieved 2 February 2020.
  7. "Peru | Data". World Bank . Retrieved 16 April 2018.
  8. "Poverty headcount ratio at $5.50 a day (2011 PPP) (% of population) – Peru". World Bank. Retrieved 21 March 2020.
  9. "GINI index (World Bank estimate)". World Bank. Retrieved 21 March 2020.
  10. "Human Development Index (HDI)". hdr.undp.org. HDRO (Human Development Report Office) United Nations Development Programme . Retrieved 15 November 2022.
  11. "Inequality-adjusted Human Development Index (IHDI)". hdr.undp.org. HDRO (Human Development Report Office) United Nations Development Programme. Archived from the original on 12 December 2020. Retrieved 15 November 2022.
  12. "Labor force, total – Peru". World Bank. Retrieved 12 January 2020.
  13. "Employment to population ratio, 15+, total (%) (national estimate) – Peru". World Bank. Retrieved 24 October 2019.
  14. "Employment in services (% of total employment) (modeled ILO estimate) – Peru, Korea, Rep. Data". World Bank. Retrieved 7 May 2021.
  15. 1 2 "Unemployment, total (% of total labor force)". World Bank . Retrieved 13 March 2014.
  16. 1 2 3 4 5 "Peru Trade Summary 2018 Data". World Bank . Retrieved 7 December 2020.
  17. "U.S. Foreign Aid by Country". explorer.usaid.gov. Archived from the original on 8 January 2021. Retrieved 20 September 2019.
  18. "Sovereigns rating list". Standard & Poor's. Retrieved 17 April 2014.
  19. "S&P Global Ratings revised outlook on Peru to negative and affirmed at "A-" (Local Currency LT) credit rating". CBonds. Retrieved 24 November 2021.
  20. "Moody's affirms Peru rating but unrest triggers negative outlook". Reuters . 31 January 2023. Retrieved 1 February 2023.
  21. "Fitch Downgrades Peru to 'BBB'; Outlook Stable". Fitch Ratings . 15 October 2021. Retrieved 24 November 2021.
  22. The World Bank, Data by country: Peru. Retrieved 1 October 2011.
  23. "Rank Order – GDP (purchasing power parity)". CIA. Archived from the original on 14 March 2014. Retrieved 13 March 2014.
  24. "Human Development Reports – Peru". United Nations Development Programme . Retrieved 13 March 2014.
  25. "Peru". World Bank . Retrieved 13 March 2014.
  26. "Moody's advierte sobre efectos de "deterioro institucional" en Perú". Infobae (in European Spanish). 2 December 2020. Retrieved 7 December 2020.
  27. El Comercio, Peru's main daily newspaper China and Peru Sign Trade Promotion Agreement, 28 April 2009. Retrieved 19 April 2014.
  28. Office of the U.S. Trade Representative, United States and Peru Sign Trade Promotion Agreement Archived 6 May 2009 at the Wayback Machine , 4 April 2006. Retrieved 15 May 2007.
  29. "El Perú firmó hoy TLC con Japón tras seis rondas de negociación" [Peru signed an FTA with Japan today after six rounds of negotiation]. El Comercio Perú. 20 April 2014. Archived from the original on 20 April 2014. Retrieved 14 March 2021.
  30. "Perú suscribió TLC con la Unión Europea | LaRepublica.pe". 20 April 2014. Archived from the original on 20 April 2014. Retrieved 7 December 2020.
  31. 1 2 3 4 5 6 "Peru seeks to maintain growth as demand for commodities falls". Oxford Business Group. 14 February 2016. Archived from the original on 10 April 2021. Retrieved 7 December 2020.
  32. 1 2 3 4 5 6 7 Orihuela, José Carlos (January–June 2020). "El consenso de Lima y sus descontentos: del restringido desarrollismo oligarca a revolucionarias reformas estructurales". Revista de historia. 27 (1). Concepción, Chile: 77–100.
  33. 1 2 3 4 Levitsky, Steven (Fall 2014). "First Take: Paradoxes of Peruvian Democracy: Political Bust Amid Economic Boom?". ReVista. Archived from the original on 22 November 2014.
  34. 1 2 3 4 5 6 7 8 9 10 11 12 13 14 15 16 17 18 Gutiérrez Sanín, Francisco; Schönwälder, Gerd (2010). Economic Liberalization and Political Violence: Utopia Or Dystopia?. International Development Research Centre. pp. 256–284. ISBN   978-0745330631.
  35. 1 2 "El "Plan Verde" Historia de una traición". Oiga. 647. 12 July 1993.
  36. Cameron, Maxwell A. (June 1998). "Latin American Autogolpes: Dangerous Undertows in the Third Wave of Democratisation". Third World Quarterly . 19 (2). Taylor & Francis: 228–230. doi:10.1080/01436599814433. The Plan Verde bore a striking resemblance to the government outlined by Fujimori in his speech on 5 April 1992. It called for a market economy within a framework of a 'directed democracy' that would be led by the armed forces after they dissolved the legislature and executive. ... The authors of the Plan Verde also stated that relations with the USA revolved more around the issue of drug trafficking than democracy and human rights, and thus made the fight against drug trafficking the number two strategic goal
  37. 1 2 Burt, Jo-Marie (September–October 1998). "Unsettled accounts: militarization and memory in postwar Peru". NACLA Report on the Americas . 32 (2). Taylor & Francis: 35–41. doi:10.1080/10714839.1998.11725657. the military's growing frustration over the limitations placed upon its counterinsurgency operations by democratic institutions, coupled with the growing inability of civilian politicians to deal with the spiraling economic crisis and the expansion of the Shining Path, prompted a group of military officers to devise a coup plan in the late 1980s. The plan called for the dissolution of Peru's civilian government, military control over the state, and total elimination of armed opposition groups. The plan, developed in a series of documents known as the "Plan Verde," outlined a strategy for carrying out a military coup in which the armed forces would govern for 15 to 20 years and radically restructure state-society relations along neoliberal lines.
  38. The World Bank, Countries: Peru Archived 30 October 2019 at the Wayback Machine . Retrieved 1 October 2011
  39. 1 2 3 4 5 Tegel, Simeon. "How Peru Laid the Groundwork for an Oil Spill Disaster". Foreign Policy . Retrieved 23 February 2022.
  40. 1 2 Peru Country Risk Report – Q3 2021. London: Fitch Solutions. 2021.
  41. 1 2 "Peru and the IMF". International Monetary Fund.
  42. Rosemary Thorp and Geoffrey Bertram, Peru 1890–1977, p. 4.
  43. 2006 figures. (in Spanish) Banco Central de Reserva, Memoria 2006 Archived 17 December 2008 at the Wayback Machine , pp. 60–61. Retrieved 3 July 2007.
  44. Rosemary Thorp and Geoffrey Bertram, Peru 1890–1977, p. 321.
  45. "South America :: Peru — The World Factbook – Central Intelligence Agency". Central Intelligence Agency. 2017. Retrieved 7 December 2020.
  46. (in Spanish) Banco Central de Reserva, Memoria 2006 Archived 17 December 2008 at the Wayback Machine , pp. 15, 203. Retrieved 25 June 2007.
  47. 1 2 3 4 5 Starn, Orin; Kirk, Carlos Iván; Degregori, Carlos Iván (2009). The Peru Reader: History, Culture, Politics. Duke University Press. ISBN   978-0-8223-8750-3.
  48. Viceryoalty of Peru, Encyclopedia Britannica. Academic edition. 2011.
  49. 1 2 Garner, Richard L. Long-Term Silver Mining Trends in Spanish America: A Comparative Analysis of Peru and Mexico
  50. Cook, Noble David (1981). Demographic collapse, Indian Perú, 1520–1620. Cambridge University Press. p. 237. ISBN   0-521-23995-8.[ permanent dead link ]
  51. "Encomienda". Encyclopædia Britannica. 26 September 2008. Archived from the original on 21 January 2019. Retrieved 21 January 2019.
  52. Raphael Lemkin's History of Genocide and Colonialism, Holocaust Memorial Museum https://www.ushmm.org/confront-genocide/speakers-and-events/all-speakers-and-events/raphael-lemkin-history-of-genocide-and-colonialism%5B%5D
  53. Yeager, Timothy J. (December 1995). "Encomienda or Slavery? The Spanish Crown's Choice of Labor Organization in Sixteenth-Century Spanish America". The Journal of Economic History. 55 (4): 842–859. doi:10.1017/S0022050700042182. JSTOR   2123819. S2CID   155030781.
  54. Stannard, David E. (1993). American Holocaust: The Conquest of the New World. Oxford University Press. p. 139. ISBN   978-0195085570. Archived from the original on 25 November 2020. Retrieved 10 November 2020.
  55. Lockhart, James. Spanish Peru, 1532–1560: A Social History, 2nd ed., Madison, Wis., University of Wisconsin Press, 1994 p. 196
  56. Cushman 2013, p. 26.
  57. Baten, Jörg (2016). A History of the Global Economy. From 1500 to the Present. Cambridge University Press. p. 132. ISBN   9781107507180.
  58. Cushman 2013, pp. 40–43.
  59. Cushman 2013, pp. 59–60.
  60. Historia contemporánea de Chile III. La economía: mercados empresarios y trabajadores. 2002. Gabriel Salazar and Julio Pinto. pp. 25–29.
  61. 1 2 Salazar & Pinto 2002, pp. 25–29.
  62. Pinto Rodríguez, Jorge (1992), "Crisis económica y expansión territorial : la ocupación de la Araucanía en la segunda mitad del siglo XIX", Estudios Sociales, 72
  63. Historia contemporánea de Chile III. La economía: mercados empresarios y trabajadores. 2002. Gabriel Salazar and Julio Pinto. p. 25-29.
  64. J.R. Brown, "The Frustration of Chile's Nitrate Imperialism," Pacific Historical Review (University of California Press), Vol. 32, No. 4 (November 1963), pp. 383–396.
  65. Riet Delsing, "Issues of Land and Sovereignty: The Uneasy Relationship Between Chile and Rapa Nui," in Decolonizing Native Histories, ed. Florencia Mallon (Durham, North Carolina: Duke University Press, 2012), p. 56.
  66. Robert N. Burr, By Reason or Force (1974), pp. 138–139.
  67. Cushman 2013, p. 73.
  68. Crow, J. A. The Epic of Latin America. p. 180.
  69. Sicotte, Richard; Vizcarra, Catalina; Wandschneider, Kirsten (2009). Military Conquest and Sovereign Debt: Chile, Peru and the London Bond Market, 1876–1890. University of Vermont. p. 42. Archived from the original (PDF) on 27 February 2016. Retrieved 25 August 2016.
  70. Coomes, Oliver T.; Barham, Bradford L. (May 1994). "The Amazon Rubber Boom: Labor Control, Resistance, and Failed Plantation Development Revisited". The Hispanic American Historical Review . 74 (2): 231–257. doi: 10.1215/00182168-74.2.231 .
  71. "Cien años después, la Amazonía recuerda uno de sus episodios más trágicos". BBC News (in Spanish). 12 October 2012. Retrieved 30 July 2021.
  72. White, Matthew (15 July 2019). "Twentieth Century Atlas – Death Tolls". Necrometrics. Retrieved 30 July 2021.
  73. "Cien años de la matanza de La Chorrera, Amazonas". El Tiempo (in Spanish). 7 October 2012. Retrieved 30 July 2021.
  74. 1 2 3 4 5 6 7 8 9 10 11 12 13 14 15 16 17 18 19 20 "Commanding Heights: Peru". PBS NewsHour . Retrieved 14 October 2021.
  75. "Augusto Bernardino Leguía y Salcedo | president of Peru". Encyclopædia Britannica . Retrieved 14 October 2021.
  76. 1 2 Dourojeanni, Marc J. (12 June 2017). "Belaúnde en la Amazonía". Centro Amazónico de Antropología y Aplicación Práctica (CAAAP) (in Spanish). Archived from the original on 28 October 2021. Retrieved 14 October 2021.
  77. "El día en el que Fernando Belaúnde mandó a matar a cientos de nativos". Diario Voces (in Spanish). 19 April 2017. Retrieved 14 October 2021.
  78. 1 2 Alfredo Schulte-Bockholt (2006). "Chapter 5: Elites, Cocaine, and Power in Colombia and Peru". The politics of organized crime and the organized crime of politics: a study in criminal power. Lexington Books. pp. 114–118. ISBN   978-0-7391-1358-5. important members of the officer corps, particularly within the army, had been contemplating a military coup and the establishment of an authoritarian regime, or a so-called directed democracy. The project was known as 'Plan Verde', the Green Plan. ... Fujimori essentially adopted the 'Plan Verde,' and the military became a partner in the regime. ... The autogolpe, or self-coup, of April 5, 1992, dissolved the Congress and the country's constitution and allowed for the implementation of the most important components of the 'Plan Verde.'
  79. 1 2 Avilés, William (Spring 2009). "Despite Insurgency: Reducing Military Prerogatives in Colombia and Peru". Latin American Politics and Society . 51 (1). Cambridge University Press: 57–85. doi:10.1111/j.1548-2456.2009.00040.x. S2CID   154153310.
  80. "La frugalidad de "Cambio 90" y el derroche de Fredemo" (in Spanish). El Proceso. 14 April 1990. Archived from the original on 20 September 2018. Retrieved 27 December 2017.
  81. Rospigliosi, Fernando (1996). Las Fuerzas Armadas y el 5 de abril: la percepción de la amenaza subversiva como una motivación golpista. Lima, Peru: Instituto de Estudios Peruanos. pp. 28–40.
  82. Gouge, Thomas. Exodus from Capitalism: The End of Inflation and Debt. 2003, page 363.
  83. Fox, Elizabeth, and Fox, de Cardona and Waisbord, Silvio Ricardo. Latin Politics, Global Media. 2002, p. 154
  84. Hough, Peter. Understanding Global Security. 2008, pp. 79–80
  85. "Ex-President's Trial a Moment of Truth". Fox News. 8 December 2007.
  86. Fujimori's controversial career, BBC News, 18 September 2000. Retrieved 4 November 2006.
  87. Burt, Jo-Marie (25 September 2007). "Peru: Facade of Democracy Crumbles". NACLA . Archived from the original on 9 September 2020. Retrieved 11 December 2020.
  88. Brooke, James (27 November 1990). "A Peruvian Is Laying Out Another Path". The New York Times. ISSN   0362-4331 . Retrieved 26 September 2020.
  89. Stokes, Susan (1997). "Are Parties What's Wrong with Democracy in Latin America?". CiteSeerX   10.1.1.569.1490 .{{cite journal}}: Cite journal requires |journal= (help)
  90. Borda, Luis (8 May 2016). "Hernando de Soto: "Alberto Fujimori fue víctima de la seducción de Montesinos"". RPP (Peru) (in Spanish). Retrieved 11 December 2020.
  91. "Buenos Aires Times | Inequality fuels rural teacher's unlikely bid to upend Peru". Buenos Aires Times . Bloomberg. 3 June 2021. Archived from the original on 4 June 2021. Retrieved 4 June 2021.
  92. O’Boyle, Brendan (3 May 2021). "Pedro Castillo and the 500-Year-Old Lima vs Rural Divide". Americas Quarterly . Archived from the original on 3 June 2021. Retrieved 3 June 2021.
  93. 1 2 "El Consenso de Lima". La Republica (in Spanish). 11 May 2013. Retrieved 23 February 2022.
  94. Holland, Lynn (30 July 2014). "The House on the Mountain: How Mining Corrodes Democracy in Peru". Council on Hemispheric Affairs . Retrieved 23 February 2022.
  95. Peru country risk report – Q4 2021. London: Fitch Solutions. 2021. p. 45.
  96. "Peru en 2018, by FAO".
  97. "Peru production in 2018, by FAO".
  98. "USGS Copper Production Statistics" (PDF).
  99. "USGS Silver Production Statistics" (PDF).
  100. "USGS Gold Production Statistics" (PDF).
  101. "USGS Lead Production Statistics" (PDF).
  102. "USGS Zinc Production Statistics" (PDF).
  103. "USGS Tin Production Statistics" (PDF).
  104. "USGS Boron Production Statistics" (PDF).
  105. "USGS Molybdenum Production Statistics" (PDF).
  106. "Foreign investment statistics (in Spanish)".{{cite journal}}: Cite journal requires |journal= (help)
  107. San José State University Department of Economics, The economic history and the economy of Peru Archived 5 October 2000 at the Wayback Machine . Retrieved 11 July 2007.
  108. (in Spanish)
  109. "PERÚ Instituto Nacional de Estadística e Informática". Archived from the original on 12 April 1997. Retrieved 11 June 2015.
  110. "El Comercio Perú : página no encontrada". Archived from the original on 15 August 2008. Retrieved 11 June 2015.
  111. "Pobreza se redujo a 30% en el 2010". larepublica.pe. Archived from the original on 13 May 2015. Retrieved 11 June 2015.
  112. "UPDATE 2-Peru's GDP surges 9.84 pct in 2008, slips in December". Reuters. 16 February 2009.
  113. 1 2 McCoy, Alfred W (2004). Dangerous Harvest. The Stimulus of Prohibition: A Critical History of the Global Narcotics Trade, p. 25. Oxford University Press, New York. ISBN   0-19-514319-1.
  114. 1 2 MacGregor, Felipe E. (ed.) (1993). Coca and Cocaine: An Andean Perspective, p.109. Greenwood Press, US. ISBN   0-313-28530-6.
  115. Salisbury, D.S. and C. Fagan (2011). "Coca and conservation: cultivation, eradication, and trafficking in the Amazon borderlands." GeoJournal doi : 10.1007/s10708-011-9430-x. URL: http://upperamazon.org/ Retrieved 28 January 2012
  116. Gootenberg, Paul (2004). "Secret Ingredients: The Politics of Coca in US-Peruvian Relations, 1915–65." Journal of Latin American Studies doi : 10.1017/S0022216X04007424 Retrieved 27 January 2012.
  117. Morales, Edmundo (1990). "The Political Economy of Cocaine Production: An Analysis of the Peruvian Case". Latin American Perspectives. 67 (4): 91. doi:10.1177/0094582X9001700406. S2CID   145443713.
  118. Morales, Edmundo (1989). Cocaine: White Gold Rush in Peru, p. xv. The University of Arizona Press, US. ISBN   0-8165-1066-0.
  119. 1 2 3 4 5 Dammert, Ana C (2008). "Child labor and schooling response to changes in coca production in rural Peru" (PDF). Journal of Development Economics. 86: 164–180. CiteSeerX   10.1.1.175.2259 . doi:10.1016/j.jdeveco.2007.06.007. S2CID   15767732.
  120. US Office of National Drug Control Policy (1998) 1, 23, 28.
  121. United Nations. Office on Drugs and Crime. Peru Coca Cultivation Survey for 2005. 2006. www.unodc.org/unodc/en/crop_monitoring.html. Retrieved 31 January 2012
  122. "DEVIDA – Comisión Nacional para el Desarrollo y Vida sin Drogas". Archived from the original on 13 June 2015. Retrieved 11 June 2015.
  123. "Private Sector Development". Archived from the original on 20 September 2009. Retrieved 11 June 2015.
  124. "Report for Selected Countries and Subjects". imf.org. Retrieved 11 September 2018.
  125. Peru – Ministry of Foreign Trade and Tourism: Trade Agreements of Peru, Trade Agreements of Peru (in Spanish) Archived 1 October 2011 at the Wayback Machine . Retrieved 29 September 2011.
  126. Peru – Ministry of Foreign Trade and Tourism: Trade Agreements of Peru, Trade Promotion Agreement Peru – USA (in Spanish) Archived 1 October 2011 at the Wayback Machine . Retrieved 22 September 2011.
  127. Office of the United States Trade Representative, Peru Trade Promotion Agreement. Retrieved 22 September 2011.
  128. Peru – Ministry of Foreign Trade and Tourism: Trade Agreements of Peru, Free Trade Agreement between Peru and Chile (in Spanish) Archived 1 October 2011 at the Wayback Machine . Retrieved 23 September 2011.
  129. Chile – National Customs Service, Free Trade Agreement Chile-Perú (in Spanish) Archived 11 March 2012 at the Wayback Machine . Retrieved 23 September 2011.
  130. Peru – Ministry of Foreign Trade and Tourism: Trade Agreements of Peru, Free Trade Agreement Peru-Canada (in Spanish) Archived 1 October 2011 at the Wayback Machine . Retrieved 24 September 2011.
  131. Foreign Affairs and International Trade Canada, Canada – Peru Free Trade Agreement Archived 5 November 2011 at the Wayback Machine . Retrieved 24 September 2011.
  132. Peru – Ministry of Foreign Trade and Tourism: Trade Agreements of Peru, Free Trade Agreement Peru-Singapore (in Spanish) Archived 1 October 2011 at the Wayback Machine . Retrieved 24 September 2011.
  133. Singapore FTA Network, Peru-Singapore Free Trade Agreement Archived 17 November 2011 at the Wayback Machine . Retrieved 24 September 2011.
  134. Peru – Ministry of Foreign Trade and Tourism: Trade Agreements of Peru, Free Trade Agreement Peru-China (in Spanish) Archived 1 October 2011 at the Wayback Machine . Retrieved 25 September 2011.
  135. China FTA Network, China-Peru FTA Archived 1 January 2010 at the Wayback Machine . Retrieved 25 September 2011.
  136. Peru – Ministry of Foreign Trade and Tourism: Trade Agreements of Peru, Free Trade Agreement Peru-Korea (in Spanish) Archived 1 October 2011 at the Wayback Machine . Retrieved 25 September 2011.
  137. Republic of Korea – Ministry of Foreign Affairs and Trade, Korea-Peru FTA Archived 13 August 2011 at archive.today . Retrieved 25 September 2011.
  138. Peru – Ministry of Foreign Trade and Tourism: Trade Agreements of Peru, Protocol between Peru and Thailand to Accelerate the Liberalization of Trade of Good and Trade Facilitation (in Spanish) Archived 1 October 2011 at the Wayback Machine . Retrieved 27 September 2011.
  139. Kingdom of Thailand – Ministry of Commerce, Peruvian Vice Minister of Foreign trade and Tourism and Thai Deputy Minister of Commerce signed the third Additional Protocol Archived 6 November 2011 at the Wayback Machine . Retrieved 27 September 2011.
  140. Peru – Ministry of Foreign Trade and Tourism: Trade Agreements of Peru, Trade Agreement Peru-European Union (in Spanish) Archived 1 October 2011 at the Wayback Machine . Retrieved 28 September 2011.
  141. European Commission – Trade, Trade Agreement between the European Union and Colombia and Peru Archived 8 November 2011 at the Wayback Machine . Retrieved 28 September 2011.
  142. Peru – Ministry of Foreign Trade and Tourism: Trade Agreements of Peru, Free Trade Agreement Peru-Costa Rica (in Spanish) Archived 1 October 2011 at the Wayback Machine . Retrieved 30 September 2011.
  143. Costa Rica – Ministry of Foreign Trade, Free Trade Agreement with Peru (in Spanish). Retrieved 30 September 2011.
  144. "Presidential Proclamation 8341—To Implement The United States-Peru Trade Promotion Agreement And for Other Purposes" (PDF)., published at 74 FR 4105, 22 January 2009
  145. E85.whipnet.net, Peruvian Desert to Host Ethanol Production Facility. February 2007. Retrieved 30 November 2007.
  146. "Peru Ratifies US Free Trade Deal" 28 June 2006. BBC News. Retrieved 29 June 2011.
  147. [Trade Agreement Kills Amazon Indians "Foreign Policy in Focus | Trade Agreement Kills Amazon Indians". Archived from the original on 10 September 2009. Retrieved 20 May 2011.]
  148. "Peruvian Congress Passes U.S. Free-Trade Pact" [ permanent dead link ]. Retrieved May 2011

Bibliography

Related Research Articles

<span class="mw-page-title-main">Economy of Canada</span>

The economy of Canada is a highly developed mixed economy, with the world's tenth-largest economy as of 2023, and a nominal GDP of approximately US$2.117 trillion. Canada is one of the world's largest trading nations, with a highly globalized economy. In 2021, Canadian trade in goods and services reached $2.016 trillion. Canada's exports totalled over $637 billion, while its imported goods were worth over $631 billion, of which approximately $391 billion originated from the United States. In 2018, Canada had a trade deficit in goods of $22 billion and a trade deficit in services of $25 billion. The Toronto Stock Exchange is the tenth-largest stock exchange in the world by market capitalization, listing over 1,500 companies with a combined market capitalization of over US$3 trillion.

<span class="mw-page-title-main">Economy of Chile</span>

The economy of Chile is a market economy and high-income economy as ranked by the World Bank. The country is considered one of South America's most prosperous nations, leading the region in competitiveness, income per capita, globalization, economic freedom, and low perception of corruption. Although Chile has high economic inequality, as measured by the Gini index, it is close to the regional mean.

The economy of Colombia is the fourth largest in Latin America as measured by gross domestic product and the third-largest economic power in South America. Colombia has experienced a historic economic boom over the last decade. Throughout most of the 20th century, Colombia was Latin America's 4th and 3rd largest economy when measured by nominal GDP, real GDP, GDP (PPP), and real GDP at chained PPPs. Between 2012 and 2014, it became the 3rd largest in Latin America by nominal GDP. As of 2018, the GDP (PPP) per capita has increased to over US$14,000, and real gross domestic product at chained PPPs increased from US$250 billion in 1990 to nearly US$800 billion. Poverty levels were as high as 65% in 1990, but decreased to under 30% by 2014, and 27% by 2018. They decreased by an average of 1.35% per year since 1990.

<span class="mw-page-title-main">Economy of Ecuador</span>

The economy of Ecuador is the eighth largest in Latin America and the 69th largest in the world by total GDP. Ecuador's economy is based on the export of oil, bananas, shrimp, gold, other primary agricultural products and money transfers from Ecuadorian emigrants employed abroad. In 2017, remittances constituted 2.7% of Ecuador's GDP. The total trade amounted to 42% of the Ecuador's GDP in 2017.

<span class="mw-page-title-main">Economy of Indonesia</span>

The economy of Indonesia is a mixed economy with dirigiste characteristics, and it is one of the emerging market economies in the world and the largest in Southeast Asia. As an upper-middle income country and member of the G20, Indonesia is classified as a newly industrialized country. Estimated at over 21 quadrillion rupiah in 2023, it is the 16th largest economy in the world by nominal GDP and the 7th largest in terms of GDP (PPP). Indonesia's internet economy reached US$77 billion in 2022, and is expected to cross the US$130 billion mark by 2025. Indonesia depends on the domestic market and government budget spending and its ownership of state-owned enterprises. The administration of prices of a range of basic goods also plays a significant role in Indonesia's market economy. However, since the 1990s, the majority of the economy has been controlled by individual Indonesians and foreign companies.

<span class="mw-page-title-main">Economy of North Macedonia</span>

The economy of North Macedonia has become more liberalized, with an improved business environment, since its independence from Yugoslavia in 1991, which deprived the country of its key protected markets and the large transfer payments from Belgrade. Prior to independence, North Macedonia was Yugoslavia's poorest republic. An absence of infrastructure, United Nations sanctions on its largest market, and a Greek economic embargo hindered economic growth until 1996.

<span class="mw-page-title-main">Economy of Paraguay</span>

The economy of Paraguay is a market economy that is highly dependent on agriculture products. In recent years, Paraguay's economy has grown as a result of increased agricultural exports, especially soybeans. Paraguay has the economic advantages of a young population and vast hydroelectric power. Its disadvantages include the few available mineral resources, and political instability. The government welcomes foreign investment.

<span class="mw-page-title-main">Economy of Slovenia</span>

The economy of Slovenia is a developed economy, and the country enjoys a high level of prosperity and stability as well as above-average GDP per capita by purchasing power parity at 92% of the EU average in 2022. The nominal GDP in 2023 is 68.108 billion USD, nominal GDP per capita (GDP/pc) in 2023 is USD 32,350. The highest GDP/pc is in central Slovenia, where the capital city Ljubljana is located. It is part of the Western Slovenia statistical region, which has a higher GDP/pc than eastern Slovenia.

<span class="mw-page-title-main">Economy of Syria</span>

Syria's economic situation has been turbulent and their economy has deteriorated considerably since the beginning of the Syrian civil war, which erupted in March 2011.

<span class="mw-page-title-main">Economy of Vietnam</span>

The economy of Vietnam is a developing mixed socialist-oriented market economy incorporating industrial policies and strategic five-year plans, which is the 35th-largest in the world as measured by nominal gross domestic product (GDP) and 26th-largest in the world as measured by purchasing power parity (PPP) in 2022. It is a lower-middle income country with a low cost of living. Vietnam is a member of the Asia-Pacific Economic Cooperation, the Association of Southeast Asian Nations and the World Trade Organization.

<span class="mw-page-title-main">Economy of Tunisia</span>

The economy of Tunisia is in the process of being liberalized after decades of heavy state direction and participation in the country's economy. Prudent economic and fiscal planning has resulted in moderate but sustained growth for over a decade. Tunisia's economic growth historically has depended on oil, phosphates, agri-food products, car parts manufacturing, and tourism. In the World Economic Forum Global Competitiveness Report for 2015–2016, Tunisia ranks in 92nd place.

<span class="mw-page-title-main">Economy of Bolivia</span>

The economy of Bolivia is the 95th-largest in the world in nominal terms and the 87th-largest in purchasing power parity. Bolivia is classified by the World Bank to be a lower middle income country. With a Human Development Index of 0.703, it is ranked 114th. Driven largely by its natural resources, Bolivia has become a region leader in measures of economic growth, fiscal stability and foreign reserves, although it remains a historically poor country. The Bolivian economy has had a historic single-commodity focus. From silver to tin to coca, Bolivia has enjoyed only occasional periods of economic diversification. Political instability and difficult topography have constrained efforts to modernize the agricultural sector. Similarly, relatively low population growth coupled with low life expectancy has kept the labor supply in flux and prevented industries from flourishing. Rampant inflation and corruption previously created development challenges, but in the early twenty-first century the fundamentals of its economy showed unexpected improvement, leading Moody's Investors Service to upgrade Bolivia's economic rating in 2010 from B2 to B1. The mining industry, especially the extraction of natural gas and zinc, currently dominates Bolivia's export economy.

<span class="mw-page-title-main">Alejandro Toledo</span> President of Peru from 2001 to 2006

Alejandro Celestino Toledo Manrique is a Peruvian former politician who served as President of Peru, from 2001 to 2006. He gained international prominence after leading the opposition against president Alberto Fujimori, who held the presidency from 1990 to 2000.

<span class="mw-page-title-main">Economic history of Peru</span>

The industries of the economy of Peru arose in response to the country's rich natural resources. During the regime of the Inca Empire, the economy was centrally planned, and labour was mandatory. Spanish explorers held the Incan system in much regard.

<span class="mw-page-title-main">Peru–United States relations</span> Bilateral relations

Peru and the United States established relations on May 2, 1826, following Peru's independence from Spain.

<span class="mw-page-title-main">Economy of Algeria</span>

Algeria's economy continued to recover in the first half of 2022, led by a return of oil production to pre-pandemic levels and a continued recovery of the service sector along with a more vigorous agricultural activity. The recovery should continue into 2023, supported by the nonhydrocarbon sector and public expenditure growth, according to the latest edition of the World Bank's Algeria Economic Update.

<span class="mw-page-title-main">Economy of Argentina</span>

The economy of Argentina is the second-largest national economy in South America, behind Brazil. Argentina is a developing country with a highly literate population, an export-oriented agricultural sector, and a diversified industrial base.

<span class="mw-page-title-main">Latin American economy</span> Overview of the economy of Latin American

Latin America as a region has multiple nation-states, with varying levels of economic complexity. The Latin American economy is an export-based economy consisting of individual countries in the geographical regions of North America, Central America, South America, and the Caribbean. The socioeconomic patterns of what is now called Latin America were set in the colonial era when the region was controlled by the Spanish and Portuguese empires. Up until independence in the early nineteenth century, colonial Latin American regional economies thrived and worked things out. Many parts of the region had favorable factor endowments of deposits of precious metals, mainly silver, or tropical climatic conditions and locations near coasts that allowed for the development of cane sugar plantations. In the nineteenth century following independence, many economies of Latin America declined. In the late nineteenth century, much of Latin America was integrated into the world economy as an exporter of commodities. Foreign capital investment, construction of infrastructure, such as railroads, growth in the labor sector with immigration from abroad, strengthening of institutions, and expansion of education aided industrial growth and economic expansion. A number of regions have thriving economies, but "poverty and inequality have been deeply rooted in Latin American societies since the early colonial era."

The Lost Decade or the Crisis of the 80s was a period of economic stagnation in Peru throughout the 1980s which was exacerbated to a severe macroeconomic crisis by the end of the decade. Foreign debt accumulation throughout Latin America, a series of natural disasters, mass public expenditures, nationalizations of banks and financial institutions, and the shutting of Peru out of international credit markets led to a decade of macroeconomic decline. The financial crisis soon became adopted into the public sphere through hyperinflation in commodities, food shortages, and mass unemployment. By the end of the decade, Peru's gross domestic product (GDP) contracted over 20%, and poverty rose to 55%.

Juan Carlos Hurtado Miller is a Peruvian former engineer and Fujimorist politician who served in the cabinet during the presidency of Fernando Belaúnde Terry and Alberto Fujimori in which, he served as Fujimori's first Prime Minister of Peru from 1990 to 1991 and was the Minister of Agriculture during the presidency of Fernando Belaúnde Terry between 1983 and 1985.

References