Peru is a multiethnic country, which means that it is home to people of many different historical backgrounds. Therefore, it is a multicultural country as well. Since it is a multiethnic society, Peruvian people usually treat their nationality as a citizenship instead of an ethnicity. The Peruvian census does not contain information about ethnicity so only rough estimates are available.
Population size and structure
According to the 2022 revision of the World Population Prospects[12][13] the total population was 33,715,471 in 2021, compared to only 7,728,000 in 1950. The proportion of children below the age of 15 in 2010 was 27.9%, 65.3% were between 15 and 65 years of age, while 6.8% were 65 years or older.[14]
Peru's football team in 1970; the ethnic diversity of Peruvians is visible, with players showing African, Amerindian and European ancestry in various mixes.
Peru is a multiethnic country formed by the amalgamation of different cultures and ethnicities over thousands of years. Amerindians inhabited the land for over ten millennia before the Spanish conquest in the 16th century; their cultures and influence represent the foundation of today's Peru.
As a result of European contact and conquest, the population of the area now known as Peru decreased from an estimated 9 million in the 1520s to around 600,00 in 1620.[30] This happened mostly because of the unintended spread of germs and infectious diseases. In fact, the spread of smallpox greatly weakened the Inca empire, even before the Spanish arrival. The Amerindians did not have as much natural immunity to the disease as did the Europeans.[31] For this reason, several Amerindian populations were decimated. Furthermore, the disease killed Inca ruler Wayna Capac, triggering a civil war in the Inca empire that preceded the conquest efforts the Spaniards. Thus, the conquest was facilitated by the weakness of the Inca empire which was recovering from both a civil war and epidemics of unknown diseases.
Peruvian girls
However, other reasons for the decrease of Amerindian population include violence during the conquest followed by the breakdown of the Inca social system and famine. The Amerindian population suffered further decrease as the Spanish exploited an Inca communal labor system called mita for mining purposes, thus killing thousands in forced labor.
Spaniards arrived in small numbers under colonial rule. After independence, there has been a gradual European immigration from Austria, England, Scotland, France, Germany, Italy, Croatia and Spain.[32][33] Polynesians also came to the country lured to work in the Guano islands during the boom years of this commodity around the 1860s. Chinese arrived in the 1850s as a replacement for slave workers in the sugar plantations of the north coast and have since become a major influence in Peruvian society.[34] Other immigrant groups include Arabs (namely from Levant/West Asian countries), South Asians, Japanese, Americans and Colombians.[35]
Since 2014, Peru has experienced a massive rise in the immigrant population from nearby Venezuela. In May 2023, the estimated population of Venezuelans in Peru is 1,600,000, being the second most popular destination for Venezuelans after Colombia.[36]
Mestizos compose about 60%[37] of the total population. The term traditionally denotes Amerindian (mostly Quechua ancestry) and European ancestry (mostly Spaniard ancestry). This term, was part of the caste classification during colonial times, whereby people of exclusive Spanish descent but born in the colonies were called criollos, people of mixed Amerindian and Spanish descent were called mestizos, those of African and Spanish descent were called mullatoes, and those of Amerindian and African descent were called Zambos. Some mestizos are urban dwellers and show some European inheritance in regions like Lima Region, La Libertad Region, Callao Region, San Martín Region, Cajamarca Region, Piura Region, Amazonas Region, Lambayeque Region, and Arequipa Region.
Amerindians constitute around 25%[37] of the total population. The two major indigenous or ethnic groups are the Quechuas (belonging to various cultural subgroups), followed by the Aymaras, mostly found in the extreme southern Andes. A large proportion of the indigenous population who live in the Andean highlands still speak Quechua and have vibrant cultural traditions, some of which were part of the Inca Empire. Dozens of indigenous cultures are also dispersed throughout the country beyond the Andes Mountains in the Amazon basin. This region is rapidly becoming urbanized. Important urban centers include Iquitos, Nauta, Puerto Maldonado, Pucallpa and Yurimaguas. This region is home to numerous indigenous peoples, though they do not constitute a large proportion of the total population. Examples of indigenous peoples residing in eastern Peru include the Shipibo, Urarina,[38]Cocama, and Aguaruna, to name just a few.
European descendants constitute around 6%[37] of the total population. They are descendants of the Spanish conquerors and other Europeans such as Germans, Italians, British, French, and Croatians (see also Croats) who arrived in the 19th and 20th centuries. The majority of them live also in the largest cities (like mestizos), usually in the North and Center of Peru: Lima, Trujillo, Chiclayo, Piura, and through all the highlands of Northwest, like Amazonas, Cajamarca and San Martin. A Southern city with a significant white population is Arequipa.
Chinatown in Lima
There is also a presence of Asian Peruvians, who are primarily of Chinese and Japanese origin, constituting less than 1% of the population.[37] Peru has the second largest population of people of Japanese descent in Latin America after Brazil and the largest population of Chinese descent in Latin America. Historic communities inhabited by people of Chinese descent are found throughout the Peruvian upper Amazon, including cities such as Yurimaguas, Nauta, Iquitos and the north central coast (Lambayeque and Trujillo). In contrast to the Japanese community in Peru, the Chinese appear to have intermarried much more since they came to work in the rice fields during the Viceroyalty and to replace the African slaves, during the abolition of slavery itself. Other Asian communities include small numbers of West Asian/Arab Peruvians, mostly of Lebanese and Syrian origin, and Palestinians,[39][40] as well a small community of South Asians, namely of Indian and Pakistani background. There have been several notable Peruvian politicians of Asian heritage, notable past president (Alberto Fujimori), who is of Japanese origin, as well as Omar Chehade, of Lebanese heritage and served as the Second Vice President of Peru from 2011 to 2012.
The remaining is constituted by Afro-Peruvians, a legacy of Peru's history as an importer of slaves during the colonial period. Today mulattos (mixed African and European) and zambos (mixed African and Amerindian) also constitute an important part of the population, especially in Piura, Tumbes, Lambayeque, Lima and Ica regions. The Afro-Peruvian population is concentrated mostly in coastal cities south of Lima, such as those found in the Ica Region, in cities like Cañete, Chincha, Ica, Nazca and Acarí in the Arequipa Region. Another large but poorly promoted segment of Afro-Peruvian presence is in the Yunga regions (west and just below the Andean chain of northern Peru), (i.e., Piura and Lambayeque), where sugarcane, lemon, and mango production are still of importance. Important communities are found all over the Morropón Province, such as in the city of Chulucanas. One of them is Yapatera, a community in the same city, as well as smaller farming communities like Pabur or La Matanza and even in the mountainous region near Canchaque. Further south, the colonial city of Zaña or farming towns like Capote and Tuman in Lambayeque are also important regions with Afro-Peruvian presence.
Socioeconomic and cultural indicators are increasingly important as identifiers. For example, Peruvians of Amerindian descent who have adopted aspects of Hispanic culture also are beginning to consider themselves "mestizo". With economic development, access to education, intermarriage, and large-scale migration from rural to urban areas, a more homogeneous national culture is developing, mainly along the relatively more prosperous coast.
The Lima-Callao Metropolitan area is home to over 11 million residents, being one of South America's largest urban areas as well as one of the five megacities in the continent.
According to the Peruvian Constitution of 1993, Peru's official languages are Spanish, Quechua, Aymara, and other indigenous languages in areas where they predominate. Today, Spanish is spoken by some 83.9% of the population. It is used by the government and the media and in education and commerce. Amerindians who live in the Andean highlands speak Quechua and Aymara and are ethnically distinct from the diverse indigenous groups who live on the eastern side of the Andes and in the tropical lowlands adjacent to the Amazon basin.
Peru's distinct geographical regions are mirrored in a socioeconomic divide between the coast's Hispanic mestizo culture and the more diverse, traditional Andean cultures of the mountains and highlands. The indigenous populations east of the Andes speak various languages and dialects. Some of these groups still adhere to traditional customs, while others have been almost completely assimilated into the Hispanic mestizo culture.
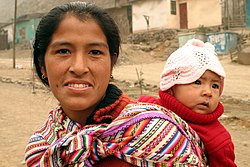
Amerindian woman with child
According to official sources, the use of Spanish has increased while the knowledge and use of indigenous languages have decreased considerably during the last four decades (1960–2000). At the beginning of the 1960s some 39% of the total Peruvian population were registered as speakers of indigenous languages, but by the 1990s the figures show a considerable decline in the use of Quechua, Aymara, and other indigenous languages, when only 28% is registered as Quechua-speaking (16% of whom are reported to be bilingual in Spanish) and Spanish-speakers increased to 72%.
For 2017, government figures place Spanish as being spoken by 82.6% of the population, but among Amerindian languages, another decrease is registered. Of the indigenous languages, Quechua remains the most spoken, and even today is used by some 13.9% of the total Peruvian population or a third of Peru's total indigenous population. The number of speakers of Aymara and other indigenous languages is placed at 2.5%, and those of foreign languages at 0.2%.
The drastic decline in use and knowledge of indigenous languages is largely attributed to recent demographic factors. The urbanization and assimilation of Peru's Amerindian plurality into the Hispanic mestizo culture, as well as new socioeconomic factors associated with class structure, have given privilege to the use of Spanish at the expense of the Amerindian languages which were spoken by the majority of the population less than a century ago.
The major obstacle to a more widespread use of Quechua is the fact that multiple varieties of this language exist. Quechua, along with Aymara and the minor indigenous languages, was originally and remains essentially an oral language. As a result, there is a lack of modern media which use it, such as books, newspapers, software, magazines, and technical journals. However, non-governmental organizations, as well as state-sponsored groups, are involved in projects to edit and translate major works into Quechua; for instance, in late 2005 a version of Don Quixote was presented in the language. There has also been an increasing and organized effort to teach Quechua in public schools in the areas where it is spoken.
The percentage of native speakers of Quechua who are illiterate was decreasing as of 2008,[42] as 86.87% of the Peruvian population is literate. More encouraging, nationwide literacy rate of youth aged 15 to 24 years is high and considered an achievement in Peruvian educational standards.[43][bettersourceneeded]
As part of the recent push in Peru to recognize and integrate indigenous people into national life, the government of Pedro Pablo Kuczynski supported the use of indigenous languages in Peru, with the state-run TV station starting to broadcast in December 2016 a daily news program in Quechua and in April 2017 one in Aymara. The President's state-of-the-union address was simultaneously translated into Quechua in July 2017.[44]As of 2016[update], government figures show about 4 million (13 percent) of the population speak Quechua fluently, while up to 10 million – around a third of the population – understand some of the language.[45]
↑Cuche, Denys. “Un siècle d’immigration palestinienne au Pérou: La construction d’une ethnicité spécifique.” Revue Européenne de Migrations Internationales 17/3 (2001): 94–95.
This page is based on this Wikipedia article Text is available under the CC BY-SA 4.0 license; additional terms may apply. Images, videos and audio are available under their respective licenses.