Estonia lies in the northern part of the temperate climate zone and in the transition zone between maritime and continental climate. Because Estonia (and all of Northern Europe) is continuously warmed by maritime air influenced by the heat content of the northern Atlantic Ocean, it has a milder climate despite its northern latitude. The Baltic Sea causes differences between the climate of coastal and inland areas.
Estonia has four seasons of near-equal length. Average temperatures range from 17.8°C (64.0°F) on the Baltic islands to 18.4°C (65.1°F)[1] inland in July, the warmest month, and from −1.4°C (29.5°F) on the Baltic islands to −5.3°C (22.5°F) inland in February, the coldest month.[1]
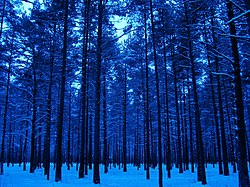
Estonia Endla Nature Reserve 07 ForestYoung pines stand in winter
The average annual temperature in Estonia is 6.4°C (43.5°F).[1] The climate is also influenced by the Atlantic Ocean, the North-Atlantic Stream and the IcelandicMinimum, which is an area known for the formation of cyclones and where the average air pressure is lower than in neighbouring areas.
Estonia is located in a humid zone in which the amount of precipitation is greater than total evaporation. The average precipitation in 1991–2020 ranged from 573 to 761 millimetres (22.6 to 30.0in) per year and was the heaviest in late summer.[2] There were between 102 and 127 rainy days a year, and the average precipitation was the most plentiful on the western slopes of the Sakala and Haanja Uplands.
Spring is usually dry and mild. The weather in April can be the most changeable, in the first half of the month there can sometimes be snowy days but at the same time it is sometimes possible to experience days when the temperature rises above 20°C. Spring is the warmest inland in southern Estonia and the coolest on the coast. May is the warmest month in spring when the first warm spells arrive and the temperatures can reach 20-30°C. Thunder season starts in April.
Summer
Summers are mild, warmer in south and east Estonia, colder on the islands. On some days temperatures can reach up to 30-35°C, but they are usually near 20°C. The warmest month is July, but the official maximum air temperature record was recorded in August at 35.6°C. Highest temperature ever recorded in Estonia is 38.0°C in August in Himmiste in Põlva county.[26] Thunderstorms can be commonly seen in the afternoon.
Autumn
Autumn is wet and windy. The first half of September can be warm. Many cyclones come from the southwest and west and bring heavy rains with thunderstorm to Estonia. Some storms can cause coastal flooding and winds over 35m/s. In the coming months, the weather gradually cools down, the share of cloudy days increases. The first snow usually comes in late October or November. Autumn in coastal areas is considerably milder than inland.
Winter
It is colder in Eastern Estonia, and warmer on the coastal areas. The coldest months are January and February; some nights can be as cold as -35°C. The record low is -43.5°C. Cyclones bring snowstorms. Sometimes, the sea effect affects Estonia, bringing more snow.
Wind
The strongest wind was in 1969 in Ruhnu, 48m/s.
Sunshine
The total annual sunshine is 1,829.6 hours. The sunniest month is usually July followed by May, the cloudiest month is usually December followed by November.
This page is based on this Wikipedia article Text is available under the CC BY-SA 4.0 license; additional terms may apply. Images, videos and audio are available under their respective licenses.