List of countries by net international investment position per capita

Last updated

List of creditor nations

This is a list of the top creditor nations of the world sorted by their net international investment positions (NIIPs) per capita. A creditor nation is a sovereign state that has a positive NIIP. [1]

Contents

The table uses the latest available data, mostly from websites approved by the International Monetary Fund, [2] and includes Macau and Hong Kong because of their special economic statuses. Population figures may list citizens only or total population, therefore ranking and figures may vary.

The 6 Gulf Cooperation Council countries are widely considered to be creditor nations (and perhaps some of the largest ones), but because of Islamic sensitivities about credit and debt, they seldom report their external assets and liabilities. [3] [4]

RankCountryExternal Assets
(in millions)
External Liabilities
(in millions)
NIIP
(in millions)
NIIP
(in USD)
Ref.PopulationRef.Per Capita
(in USD)
As of
1Flag of Macau.svg  Macau [5] 523% of GDP (est)244% of GDP (est)279.6% of GDP (est)129,175,000,000 [6] 601,000[ citation needed ]214,934Dec 2015
2Flag of Hong Kong.svg  Hong Kong [7] HKD 40,681,611HKD 30,440,448HKD 10,241,1631,309,268,000,000 [8] 7,409,800 [9] 176,694Oct. 2017
3Flag of Singapore.svg  Singapore [10] SGD 4,150,370.8SGD 3,306,317.3SGD 844,053.5596,858,559,145 [11] 3,902,700 [12] 152,935Dec. 2015
4Flag of Norway.svg  Norway [13] NOK 12,994,059NOK 6,785,470NOK 6,208,589701,964,590,784 [14] 5,213,985134,631Dec. 2015
5Flag of Switzerland (Pantone).svg   Switzerland [15] CHF 4,260,301CHF 3,651,607CHF 608,694607,782,326,510 [16] 8,325,200 [17] 73,005Dec. 2015
6Flag of the Republic of China.svg  Taiwan [18] USD 1,634,712USD 580,807USD 1,053,9051,053,905,000,00023,492,074 [19] 44,862Dec. 2015
7Flag of Luxembourg.svg  Luxembourg [20] EUR 9,470,480.534EUR 9,454,005.815EUR 16,474.71917,887,096,660 [21] 576,200 [22] 31,043Dec. 2015
8Flag of the Netherlands.svg  Netherlands [23] EUR 7,583,186.1EUR 7,171,831.9EUR 411,354.2446,619,595,566 [21] 16,980,049 [24] 26,303Dec. 2015
9Flag of Belgium (civil).svg  Belgium [25] EUR 1,973,000EUR 1,719,000EUR 254,000275,775,420,000 [21] 11,268,000 [26] 24,474Dec. 2015
10Flag of Mauritius.svg  Mauritius [27] MUR 15,178,485MUR 14,106,085MUR 1,072,40029,934,403,350 [28] 1,262,862 [29] [30] 23,704Dec. 2015
11Flag of Saudi Arabia.svg  Saudi Arabia [31] SAR 3,548,790SAR 1,283,100SAR 2,265,690604,758,000,00024,000,00025,198Dec. 2016
12Flag of Japan.svg  Japan [32] [33] JPY 948,729,000JPY 609,466,000JPY 339,263,0002,812,543,005,181 [34] 127,043,000 [35] [36] 22,139Dec. 2015
13Flag of Denmark.svg  Denmark [37] DKK 5,924,000DKK 5,090,000DKK 834,000121,352,159,894 [38] 5,707,300 [39] 21,263Dec. 2015
14Flag of Germany.svg  Germany [40] EUR 7,903,800EUR 6,415,600EUR 1,488,2001,615,783,386,000 [21] 81,770,900 [41] 19,760Dec. 2015
15Flag of Malta.svg  Malta [42] [43] EUR 223,234.8EUR 218,747.7EUR 4,487.14,871,779,083 [21] 429,34411,347Dec. 2015
16Flag of Israel.svg  Israel [44] USD 418,535USD 283,411USD 135,124135,125,000,0008,464,200 [45] 8,097Sep. 2017
17Flag of South Korea.svg  South Korea [46] USD 1,494,722USD 1,173,651USD 321,071321,071,000,00052,617,000 [47] 6,104Jun. 2018
18Flag of Russia.svg  Russia [48] [49] USD 1,596,563USD 772,192USD 824,371824,371,086,246146,500,0005,627Mar. 2023
19Flag of the People's Republic of China.svg  China [50] USD 6,218,905.405USD 4,622,452.390USD 1,596,453.0151,596,453,015,0001,367,820,000 [51] 1,167Dec. 2015

List of debtor nations

This is a list of debtor nations by net international investment position per capita.

This is a list of debtor nations of the world sorted by their net international investment positions (NIIPs) per capita. A debtor nation is a sovereign state that has a negative NIIP, i.e. a country that has net external liabilities, NOT net external assets. [52]

The table uses data from respective national government statistical agencies, Eurostat, or IMF. Though many do, a large portion of nations do not report data to the IMF. Disclaimer: Note that parallel reports from government or international agencies may report vastly different data.

RankCountryExternal Assets
(in millions)
External Liabilities
(in millions)
NIIP
(in millions)
NIIP
(in USD)
Ref.PopulationRef.per capita
(in USD)
 % of GDPAs of
1Flag of Cyprus.svg  Cyprus [53] N/AN/AEUR -24,468-29,361,000,0001,140,000-25,755-139.8%2014
2Flag of Greece.svg  Greece [53] N/AN/AEUR -222,323-266,787,000,00010,000,000-26,678-126.4%2014
3Flag of Portugal.svg  Portugal [53] N/AN/AEUR -196,053-235,263,000,00010,500,000-22,406-113.3%2014
4Flag of Spain.svg  Spain [54] N/AN/AEUR -978,000-978,000,000,00046,400,000-21,005-81.7%Q2 2018
5Flag of Australia (converted).svg  Australia [55] --AUD -1,043,300-762,000,000,00024,000,000-31,758-56.8%Sep 2016
6Flag of Indonesia.svg  Indonesia [56] USD 214,481USD 627,588USD -413,106-413,106,000,000250,000,000-1,652-47.5%Dec 2014
7Flag of the United States.svg  USA [57] USD 31,680,100USD 47,792,200USD -16,112,100-16,112,100,000,000332,300,000-48,487-63.3%4Qtr 2022
8Flag of Brazil.svg  Brazil [58] USD 777,674USD 1,434,811USD -657,136-657,136,000,000205,000,000-3,567-31.2%Jun 2015
9Flag of the United Kingdom.svg  UK [53] N/AN/AGBP -431,454-690,326,000,00065,000,000-10,620-24.1%2014
10Flag of India.svg  India [59] USD 920,600USD 1,280,400INR -27,485,450-359,800,000,0001,410,000,000-255-11.6%Mar 2022
11Flag of the Philippines.svg  Philippines [60] USD 240,935USD 368,557USD -27,603-27,603,000,000113,000,000-244-7%Dec 2021

See also

Notes

    Related Research Articles

    <span class="mw-page-title-main">Economy of Ecuador</span>

    The economy of Ecuador is the eighth largest in Latin America and the 69th largest in the world by total GDP. Ecuador's economy is based on the export of oil, bananas, shrimp, gold, other primary agricultural products and money transfers from Ecuadorian emigrants employed abroad. In 2017, remittances constituted 2.7% of Ecuador's GDP. The total trade amounted to 42% of the Ecuador's GDP in 2017.

    <span class="mw-page-title-main">ISO 4217</span> Standard that defines codes for the representation of currencies

    ISO 4217 is a standard published by the International Organization for Standardization (ISO) that defines alpha codes and numeric codes for the representation of currencies and provides information about the relationships between individual currencies and their minor units. This data is published in three tables:

    <span class="mw-page-title-main">Economy of Russia</span>

    The economy of Russia has gradually transformed from a planned economy into a mixed market-oriented economy. It has enormous natural resources, particularly oil and natural gas. In 2023, it was the world's 11th-largest economy by nominal GDP, 6th-largest by purchasing power parity (PPP) according to IMF, and 5th-largest according to World Bank. Due to a volatile currency exchange rate, Russia's GDP as measured in dollars fluctuates sharply. Russia was the last major economy to join the WTO, becoming a member in 2012.

    Special drawing rights are supplementary foreign exchange reserve assets defined and maintained by the International Monetary Fund (IMF). SDRs are units of account for the IMF, and not a currency per se. They represent a claim to currency held by IMF member countries for which they may be exchanged. SDRs were created in 1969 to supplement a shortfall of preferred foreign exchange reserve assets, namely gold and U.S. dollars. The ISO 4217 currency code for special drawing rights is XDR and the numeric code is 960.

    <span class="mw-page-title-main">Economy of Uzbekistan</span>

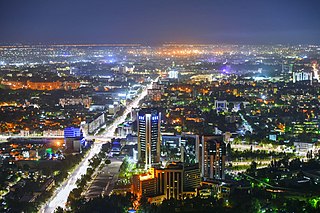
    The economy of Uzbekistan was formerly associated with a Soviet-style command economy, with a slow transformation to a market economy. However, in recent years and since the election of President Shavkat Mirziyoyev, Uzbekistan has seen rapid economic and social reform, aimed at boosting growth and transforming Uzbekistan into a true, modern market economy. International Financial Institutions, including EBRD, Asian Development Bank and the World Bank are actively engaging in supporting Uzbekistan's successful reform process and have rapidly increased their presence in the country.

    <span class="mw-page-title-main">Economy of Zimbabwe</span>

    The economy of Zimbabwe is a tertiary sector based economy, making up to 56.64% of total GDP as of 2021. Zimbabwe has a $44 billion dollar informal economy in PPP terms which translates to 64.1% of the total economy. Agriculture and mining largely contribute to exports. The economy is set to reach $66 billion by end of 2023, 88% increase in forecast from $35 billion.

    <span class="mw-page-title-main">Economy of Iran</span>

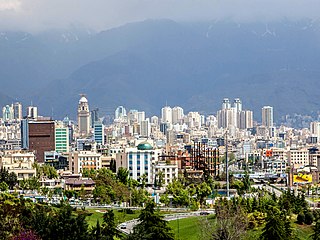
    Iran is a mixed economy with a large public sector. Some 60% of Iran's economy is centrally planned.. Iran's economy is characterized by its hydrocarbon, agricultural, and service sectors, in addition to manufacturing and financial services, with over 40 industries are directly involved in the Tehran Stock Exchange. The stock exchange has been one of the best performing exchanges in the world over the past decade. With 10% of the world's proven oil reserves and 15% of its gas reserves, Iran is considered an "energy superpower".

    <span class="mw-page-title-main">Reserve currency</span> Currencies held by monetary authorities as part of their foreign exchange reserves

    A reserve currency is a foreign currency that is held in significant quantities by central banks or other monetary authorities as part of their foreign exchange reserves. The reserve currency can be used in international transactions, international investments and all aspects of the global economy. It is often considered a hard currency or safe-haven currency.

    Listed below is a table of historical exchange rates relative to the U.S. dollar, at present the most widely traded currency in the world. An exchange rate represents the value of one currency in another. An exchange rate between two currencies fluctuates over time. The value of a currency relative to a third currency may be obtained by dividing one U.S. dollar rate by another. For example, if there are ¥120 to the dollar and €1.2 to the dollar then the number of yen per euro is 120/1.2 = 100.

    <span class="mw-page-title-main">Economy of the European Union</span>

    The economy of the European Union is the joint economy of the member states of the European Union (EU). It is the second largest economy in the world in nominal terms, after the United States, and the third largest at purchasing power parity (PPP), after China and the US. The European Union's GDP is estimated to be $19.35 trillion (nominal) in 2024 or $26.64 trillion (PPP), representing around one-sixth of the global economy. Germany has the biggest national GDP of all EU countries, followed by France and Italy.

    <span class="mw-page-title-main">Net international investment position</span> Concept in economics

    The net international investment position (NIIP) is the difference in the external financial assets and liabilities of a country. External debt of a country includes government debt and private debt. External assets publicly and privately held by a country's legal residents are also taken into account when calculating NIIP. Commodities and currencies tend to follow a cyclical pattern of significant valuation changes, which is also reflected in NIIP.

    <span class="mw-page-title-main">Hyperinflation in Venezuela</span> Increasing inflation rates in Venezuela since 2017

    Hyperinflation in Venezuela is the currency instability in Venezuela that began in 2016 during the country's ongoing socioeconomic and political crisis. Venezuela began experiencing continuous and uninterrupted inflation in 1983, with double-digit annual inflation rates. Inflation rates became the highest in the world by 2014 under Nicolás Maduro, and continued to increase in the following years, with inflation exceeding 1,000,000% by 2018. In comparison to previous hyperinflationary episodes, the ongoing hyperinflation crisis is more severe than those of Argentina, Bolivia, Brazil, Nicaragua, and Peru in the 1980s and 1990s, and that of Zimbabwe in the late-2000s.

    References

    1. Staff, Investopedia (14 May 2007). "Creditor Nation". Archived from the original on 13 January 2015. Retrieved 24 June 2022.
    2. "IMF--Dissemination Standards Bulletin Board-- Subscribing Countries-- International". dsbb.imf.org. Archived from the original on 2018-04-09. Retrieved 2022-06-24.
    3. "New questions for a new year on UAE's surging markets". 12 January 2014. Archived from the original on 5 October 2016. Retrieved 24 June 2022.
    4. "GCC States: Eyeing Opportunities in the Global Financial Crisis". Stratfor.
    5. Dept, International Monetary Fund. Asia and Pacific. "People's Republic of China-Macao Special Administrative Region : 2016 Article IV Consultation-Press Release; and Staff Report". Archived from the original on 2022-07-07. Retrieved 2022-06-24.
    6. "Annual Economic Report" (PDF). sinoptic.ch. 31 May 2016. Archived (PDF) from the original on 15 July 2022. Retrieved 24 June 2022.
    7. "Table 045 : International Investment Position - Census and Statistics Department". www.censtatd.gov.hk. Archived from the original on 2020-10-13. Retrieved 2022-06-24.
    8. "XE: USD / HKD Currency Chart. US Dollar to Hong Kong Dollar Rates". www.xe.com. Archived from the original on 2022-06-24. Retrieved 2022-06-24.
    9. "Population Estimates - Overview - Census and Statistics Department". www.censtatd.gov.hk. Archived from the original on 2016-03-06. Retrieved 2022-06-24.
    10. "Statistics Singapore - IMF Special Data Dissemination Standard - Economic and Financial Data for Singapore". 1 May 2016. Archived from the original on 1 May 2016.{{cite web}}: CS1 maint: bot: original URL status unknown (link)
    11. "XE: USD / SGD Currency Chart. US Dollar to Singapore Dollar Rates". www.xe.com. Archived from the original on 2022-06-24. Retrieved 2022-06-24.
    12. "Statistics Singapore - Latest Data" for Singapore Residents, i.e. citizens and permanent residents In Singapore's case, the non-resident population is about 30% of the total population (which is highly significant, compared to the much lower proportion of non-residents living in the other countries in this list); so the non-resident population (the vast majority of whom are temporary foreign workers), which has no share in Singapore's net external assets, should be excluded.
    13. "Economic and Financial Data for Norway - SSB". 28 June 2016. Archived from the original on 28 June 2016.{{cite web}}: CS1 maint: bot: original URL status unknown (link)
    14. "XE: USD / NOK Currency Chart. US Dollar to Norwegian Krone Rates". www.xe.com. Archived from the original on 2022-06-24. Retrieved 2022-06-24.
    15. "International economic affairs". data.snb.ch. Archived from the original on 2022-06-29. Retrieved 2022-06-24.
    16. "XE: USD / CHF Currency Chart. US Dollar to Swiss Franc Rates". www.xe.com. Archived from the original on 2022-06-24. Retrieved 2022-06-24.
    17. "Swiss Statistics - Overview". 28 June 2016. Archived from the original on 28 June 2016.
    18. "International Investment Position (End-Period Stocks)" (PDF). cbc.gov.tw. Archived (PDF) from the original on 2022-07-15. Retrieved 2022-06-24.
    19. "Archived copy". Archived from the original on 2014-03-29. Retrieved 2014-02-02.{{cite web}}: CS1 maint: archived copy as title (link)
    20. "Banque centrale du Luxembourg - International investment position of Luxembourg". www.bcl.lu. Archived from the original on 2022-06-21. Retrieved 2022-06-24.
    21. 1 2 3 4 5 "XE: EUR / USD Currency Chart. Euro to US Dollar Rates". www.xe.com. Archived from the original on 2022-06-24. Retrieved 2022-06-24.
    22. "Table view". www.statistiques.public.lu. Archived from the original on 2022-01-19. Retrieved 2022-06-24.
    23. "Balance of payments and international investment position - De Nederlandsche Bank" ("T12.12 Net external assets; Yearly/Quarterly") Archived 2015-12-20 at the Wayback Machine
    24. "CBS StatLine - Select..." statline.cbs.nl. Archived from the original on 2018-02-16. Retrieved 2022-06-24.
    25. NBB. "International Investment Position". stat.nbb.be. Archived from the original on 2019-06-05. Retrieved 2022-06-24.
    26. NBB. "NBB Statistics". stat.nbb.be. Archived from the original on 2022-08-09. Retrieved 2022-06-24.
    27. "international investment position". Archived from the original on 2022-06-26. Retrieved 2022-06-24.
    28. "XE: USD / MUR Currency Chart. US Dollar to Mauritian Rupee Rates". www.xe.com. Archived from the original on 2022-06-24. Retrieved 2022-06-24.
    29. "Statistics Mauritius - Population and Vital Statistics". statsmauritius.govmu.org. Archived from the original on 2020-08-03. Retrieved 2022-06-24.
    30. "Statistics Mauritius - Population and Vital Statistics Year 2015". statsmauritius.govmu.org. Archived from the original on 2020-08-03. Retrieved 2022-06-24.
    31. "Saudi Arabia International Investment Position". ceicdata.com. Archived from the original on 2018-01-08. Retrieved 2022-06-24.
    32. "International Investment Position : Ministry of Finance". 28 June 2016. Archived from the original on 28 June 2016.{{cite web}}: CS1 maint: bot: original URL status unknown (link)
    33. "International Investment Position of Japan (End of 2015) : Ministry of Finance". 28 June 2016. Archived from the original on 28 June 2016.{{cite web}}: CS1 maint: bot: original URL status unknown (link)
    34. "XE: USD / JPY Currency Chart. US Dollar to Japanese Yen Rates". www.xe.com. Archived from the original on 2022-06-24. Retrieved 2022-06-24.
    35. "Statistics Bureau Home Page/Result of the Population Estimates". www.stat.go.jp. Archived from the original on 2022-08-09. Retrieved 2022-06-24.
    36. "Population Estimates 2016Jun. - Search from file - Search for statistics - Portal Site of Official Statistics of Japan". www.e-stat.go.jp. Archived from the original on 2016-08-20. Retrieved 2022-06-24.
    37. "IMF". 28 June 2016. Archived from the original on 28 June 2016.{{cite web}}: CS1 maint: bot: original URL status unknown (link)
    38. "XE: USD / DKK Currency Chart. US Dollar to Danish Krone Rates". www.xe.com. Archived from the original on 2022-06-24. Retrieved 2022-06-24.
    39. "Population at the first day of the quarter - StatBank Denmark - data and statistics" Archived 2014-10-21 at archive.today
    40. "International investment position: Balance of Payments Statistics" (PDF). 28 June 2016. Archived from the original on 28 June 2016.{{cite web}}: CS1 maint: bot: original URL status unknown (link)
    41. "State & society - Current population - Population based on the 2011 Census - Federal Statistical Office (Destatis)". 28 June 2016. Archived from the original on 28 June 2016.{{cite web}}: CS1 maint: bot: original URL status unknown (link)
    42. "Economic and Financial Data For Malta". nso.gov.mt. Archived from the original on 2016-04-05.
    43. "The International Investment Position of Malta". 19 April 2016. Archived from the original on 19 April 2016.{{cite web}}: CS1 maint: bot: original URL status unknown (link)
    44. ""Bank of Israel - Data & Statistics - Subject Page" ("External Sector > International investment position")". Archived from the original on 2022-07-15. Retrieved 2022-06-24.
    45. "The Central Bureau of Statistics (Israel)-Time Series-DataBank-Population". cbs.gov.il. Archived from the original on 2014-10-31. Retrieved 2022-06-24.
    46. "Bank of Korea - International Investment Position (IIP) at the end of 2015 (preliminary)" (PDF). Archived from the original (PDF) on 2017-03-05. Retrieved 2020-03-08.
    47. "Population Projections for Provinces (2013~2040)" (pdf). Statistics Korea. 1 December 2015. Archived from the original on 27 September 2015. Retrieved 24 June 2022.
    48. "Минфин России :: National Summary Data Page (NSDP) :: National Summary Data Page (NSDP)". 27 June 2016. Archived from the original on 27 June 2016.{{cite web}}: CS1 maint: bot: original URL status unknown (link)
    49. "Statistics - External Sector Statistics - Bank of Russia". www.cbr.ru. Archived from the original on 2017-05-10. Retrieved 2022-06-24.
    50. "The time-series data of International Investment Position of China". safe.gov.cn. Archived from the original on 2016-06-02. Retrieved 2015-08-12.
    51. "National Data". data.stats.gov.cn. Archived from the original on 2016-02-01. Retrieved 2022-06-24.
    52. "Creditor Nation". Investopedia. Archived from the original on 2015-01-13. Retrieved 2015-01-14.
    53. 1 2 3 4 "Net international investment position - quarterly data, % of GDP". Archived from the original on 2016-01-30. Retrieved 2016-01-23.
    54. Banco de España. "Spanish international investment position vis-à-vis other Euro area residents and the rest of the world" (PDF). Economic Bulletin. Archived (PDF) from the original on 2015-01-14. Retrieved 2015-01-14.
    55. "5302.0 - Balance of Payments and International Investment Position, Australia, Dec 2014". abs.gov.au. Archived from the original on 2018-12-26. Retrieved 2015-04-02.
    56. "..: International Investment Position - Bank Indonesia". Archived from the original on 2015-09-23. Retrieved 2016-08-30.
    57. "News Release: U.S. Net International Investment Position". bea.gov. Archived from the original on 2018-03-03. Retrieved 2018-03-09.
    58. "Historical Series of the International Investment Position". bcb.gov.br. Archived from the original on 2018-12-26. Retrieved 2015-01-14.
    59. "Reserve Bank of India". rbi.org.in. Archived from the original on 2022-10-31. Retrieved 2022-10-31.
    60. "International Investment Position Report" (PDF). The Manila Times . April 2016. Archived from the original on 2016-04-14. Retrieved 2016-04-02.