Water supply and sanitation in Brazil

Last updated
Water supply and sanitation in Brazil
Flag of Brazil.svg
Data
Access to an at least basic water source 97% (2015) [1]
Access to at least basic sanitation 86% (2015) [1]
Share of collected wastewater treated35% (2000) [2]
Average urban water use (L/person/day)143
Average urban water and sanitation tariff (US$/m3)0.82 (2006) [3]
Share of household metering76% [4]
Annual investment in WSSUS$3.4 bn corresponding to US$17/capita (2012)
Financing51% self-financing by utilities (2004)
Institutions
Decentralization to municipalitiesSubstantial
National water and sanitation companyNone
Water and sanitation regulatorState-level multi-sector
Responsibility for policy settingMinistry of Cities
No. of urban service providers26 State Companies, >1500 municipalities for water, >4500 municipalities for sanitation

Access to at least basic water increased from 94% to 97% between 2000 and 2015; an increase in access to at least basic sanitation from 73% to 86% in the same period; [5]

Contents

Brazil has a national system to finance water and sanitation infrastructure; a high level of cost recovery compared to most other developing countries.

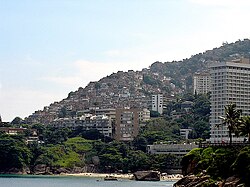
A high number of poor Brazilians live in urban slums (favela) and in rural areas without access to piped water or sanitation. Water is scarce in the northeast of Brazil. Water pollution is common, especially in the southeast of the country. Brazil has a low share of collected wastewater that is being treated (35% in 2000), and long-standing tensions between the federal, state and municipal governments about their respective roles in the sector.

Access

In 2015 around 6.2 million people lacked access to "at least basic water", whereas 97% of the population had access to it. The figures were 99% in urban areas and 87% in rural areas. [1] [6] As for access to sanitation, in 2015, 29 million people were without access to "at least basic sanitation", whereas 86% of the population had access to it. This was 91% of the population in urban areas and 58% of the population in rural areas. [1] [6]

In earlier years, access to piped water supply in Brazil stood at 92% and access to improved sanitation also at 79% in 2008. [5] Coverage was significantly higher in urban areas, where 87% of the Brazilian population live. Urban coverage is 100% for water and 85% for improved sanitation, including 53% access to sewerage, the remainder being accounted for by on-site sanitation. Coverage in rural areas, where 13% of Brazil's population lives, is much lower. It stands at 85% for improved water supply and only 44% for improved sanitation. Geographically coverage is lowest in the country's poorest regions: particularly in predominantly rural North, Northeast, and Center-West.

Official data for every municipality in Brazil are published in the National Information System SNIS

Water use

Current water use in Brazil for users served by utilities is 154.9 Liter/capita/day, ranging from an average of 95.3 L/capita /day (state Pernambuco) to 254 L/capita /day (state Rio de Janeiro). [7] Water use in Brazilian cities is lower than in some other Latin American cities (370 in Buenos Aires, 259 across cities in Peru, 196 across cities in Chile) and is now much closer to levels in Central Europe (165 in France, 150 in England and 122 in Germany). Increased metering and a higher share of low-income users with low per capita water use may have played a role in the reduced water use.

Reaching the poor

Favelas in Rio de Janeiro. RiodeJaneiro-Favela.jpg
Favelas in Rio de Janeiro.

Reaching poor urban neighborhoods remains a challenge. This frequently requires non-conventional approaches. While Brazil has pioneered the use of low cost appropriate technology (such as condominial sewers) and active community participation it still faces the challenge of the many informal peri-urban settlements, called favelas, often situated on steep slopes or in flood plains. An example of how the government addresses these issues is the World Bank-supported Low Income Sanitation Technical Assistance Project PROSANEAR.

History and recent developments

The water and sanitation sector has gradually evolved over time. The changes that have occurred have largely been the product of political, economic, social and cultural factors external to the sector. [8]

Municipal service provision (prior to 1968)

Until 1968, the responsibility for water supply and sanitation was municipal. Service providers were municipal water and drainage companies, each of them with different financial and administrative structures. The federal role was limited to the Special Service for Public Health, which lacked funding as well as regulatory or enforcement capacity. [9] At that time coverage rates were low and there was no institutional structure to plan and finance an increase in coverage on the necessary scale. [10] The military regime that took power in 1964 initially did not intervene in the structure of the sector. The central role of municipalities in water supply and sanitation was thus confirmed by the 1967 Federal Constitution, only to be fundamentally altered a year later.

The National Water Supply and Sanitation Plan PLANASA (1968–1986)

A water tower in Campinas, Sao Paulo. SANASA - Caixa d'agua.JPG
A water tower in Campinas, São Paulo.

To address the challenges in the sector, the National Water Supply and Sanitation System was created in 1968. It was supported by three newly created institutions:

Planasa was the first federal government initiative in water and sanitation in Brazil. BNH managed the FGTS and, by extension, national urban development policy. [10] Beginning in 1971 State Water and Sanitation Companies (CESBs) were set up in every Brazilian state. Until 1985, only these public companies could obtain financing from BNH for water supply and sanitation, being responsible for construction, operation and maintenance. In order for CESBs to operate in their respective states, they had to obtain municipal licenses to run the services under long-term contracts, because the Brazilian Constitution had already established that the power to grant licences for public water and sanitation services belonged to the municipalities.

The favorable performance of the economy, the scale of the system being installed, the amount of funds available and the subsidized interest rates on loans, all helped services to expand quickly. [10] Between 1970 and 1990, PLANASA expanded coverage from 45% to 95% for water and 24% to 42% for sanitation among urban residents [11] Due to their larger territorial scope, state water companies were able to cross-subsidize between different classes of consumers, especially between grossly disparate neighboring municipalities. [12]

The coverage expansion happened unequally. Investment in water services was given priority because it was less costly and produced a quicker return through water charges. In addition, although there was significant expansion of services all over Brazil, Planasa gave priority to the country's richer regions of the South and South East; most of the investment was concentrated in the larger cities, and within these cities, in the better-off sections of the population. [10] About 3,200 of Brazil's municipalities took advantage of PLANASA (although often without formal contracts), granting concessions to these state companies for 20–30 years. 1,800 municipalities chose to continue providing services directly on their own or indirectly through municipal companies, most of them in the relatively wealthy South-eastern region, particularly in Minas Gerais and São Paulo. [13]

Other municipalities retained partial autonomy, linked to a Health Ministry entity, now known as the National Health Foundation (Funasa). They operated in accordance with the model established by the Special Service for Public Health over 40 years ago. Services are operated by a municipal agency which is administratively, technically and financially autonomous, but in which there is considerable input from Funasa, whose functions range from administration to technical assistance. In 1993 about 6% of Brazilian municipalities functioned under this system in 625 locations. They are largely concentrated in the North-eastern region. [10]

Planasa coincided with the period of military government in Brazil (1964–1985) (see also History of Brazil), which has left its mark on the corporate culture of the state water companies at the time. For example, Lemos and Oiveira labeled the state water and sanitation companies as "pre-democratic institutions" that perceived themselves as "islands of competence", constituting an "infallible technocracy" which systemically warded off public involvement in policy-making. [14] PLANASA also reduced the role of many municipal governments to signing concession contracts with state water companies, leaving them with a sense of marginalization. [15] The return to democracy and the decline in federal funding encouraged many states and municipalities to devolve services to the local level. Some also began to seek private concessions. Water and sanitation policy thus entered a new era that was characterized by an environment of increasing legal uncertainty and political controversy.

Gradual municipalization, some private sector participation (1986–2002)

In 1986 the Housing Bank BNH was dissolved and management of the FGTS, the key financing instrument for the sector, was passed on to the Caixa Econômica Federal (CEF), under the supervision and control of the Supervisory Council of the FGTS (CCFGTS). However, the sector policy functions of BNH were not passed on to CEF and national policy for sanitation became the responsibility of various bodies in charge of urban management. PLANASA was formally abolished in 1992, making it more difficult for state governments to finance state water companies. The 1988 Federal Constitution does not clearly assign the responsibility for water supply and sanitation to either municipalities or states. [11] Both can implement programs, provided the basic guidelines issued by the Federal Government are followed. A complicated web of un-enforced or weakly enforced statutory requirements (e.g. permit requirements) persisted. [11] An effect of the new constitution was to render the responsibility for water provision "less clearly defined". [12] Article 30 of the 1988 constitution allows municipal government to legislate in matters of "local interest" and to "organize and provide, directly or by concession or permit, the public services of local interest", but does not resolve a variety of "unclear property rights" questions relating to the concession authority of municipalities. Nevertheless, state water companies continue to be regulated almost exclusively by state governments.

State governments have adopted different strategies during the 1990s. Some, such as those of Rio de Janeiro and of Espírito Santo, attempted to grant concessions to the private sector. Others, such as Mato Grosso do Sul, returned the operation of services to the municipalities. Other states, such as São Paulo, Paraná and Ceará, took a series of measures to strengthen their state companies. This strategy also included diversifying the origin of the funds, opening the company's capital to private investors, as well as contracting out the management of systems to local private operators. [10]

In February 1995 The Public Concession Act was passed. It cast additional legal uncertainty on swathes of public concession contracts with state water companies and eviscerated relevant states on contract law. [10] Nevertheless, since 1996 some 65 municipalities in 10 states have granted concessions to private operators, serving about 7 million people, or 4% of the population of Brazil.

The Lula administration (2003–2011)

In January 2003 President Luiz Inácio Lula da Silva assumed office. In the same year his government created a Ministry of Cities with a National Department of Environmental Sanitation, entrusted with the responsibility to monitor sector performance and to establish directives for "basic sanitation" (including water supply, sewerage, wastewater treatment and solid waste management, which are all covered by the Portuguese term saneamento básico). [8] At the same time the Council of Cities was established, which has an important role in advising on sanitation policy and in approving it. The strengthening of the sector policy authority at the federal and municipal levels represented "a major departure from the past, when the provincial states had the leadership in basic sanitation policy". [8]

Water treatment plant Barra da Tijuca, Rio de Janeiro ETEBarra.JPG
Water treatment plant Barra da Tijuca, Rio de Janeiro

In January 2007, at the beginning of his second term, the President signed a new federal water and sanitation law (Lei 11.445/07 para o saneamento básico) that outlines federal policies in the sector. The law aims at increasing investments to provide universal access to water and sanitation, while taking into account local specificities and using appropriate technologies that are in line with users' ability to pay. It also aims at increasing transparency and "social control". The law is a compromise between diverging interests of a broad array of stakeholders. It thus leaves some important issues undefined. One of these issues is the responsibility for service provision in large metropolitan areas, where some municipalities have challenged the constitutionality of service provision by state companies. The Supreme Court is expected to rule soon on two such cases. Nevertheless, the law fills a void by providing a legal basis for the role of the federal government in water and sanitation that had remained undefined during the previous 20 years. [16] Léo Heller, professor of sanitary and environmental engineering at the Federal University of Minas Gerais, even called it "arguably the most important legislative innovation in basic sanitation sector in decades". [8]

In the same month, the President announced a new Program for the Acceleration of Growth (PAC) that includes major investments in highways, airports, ports, energy, as well as providing housing, water and sewage that would benefit poor Brazilians. The program calls for a total of 504 billion real (235 billion U.S. dollars) through 2010, of which about 205 billion U.S. dollars would be provided by state-owned companies and the private sector, while the rest would come from the federal government. [17]

National Sanitation Plan

In December 2013 the federal government approved a National Sanitation Plan (Plansab) that aims to reach universal access to drinking water by 2023, and universal access to sanitation in urban areas by 2033. It also aims to reach 93% coverage in terms of wastewater treatment by 2033. The plan foresess federal subsidies to municipalities, provided they draw up local water and wastewater plans. As of December 2013 only around 30% of municipalities have drafted such plans. Especially municipalities in the poorest states have failed to submit plans, thus potentially cutting themselves off from federal funding. [18]

Infrastructure

In Brazil, countrywide, 19.1% of households are connected to septic tanks but they are not connected to the general network. [19] Approximately 9 million households (12.6%) had a ditch, rudimentary cesspit, river, lake or sea, in addition to other forms of waste disposal. The relevance of sanitation infrastructure in the health-disease process was highlighted in a study on hospitalizations due waterborne diseases. Overall, in 2015, diarrhea was estimated to be one of the main causes of death in all age groups (1.31 million). [19] In terms of coverage, around 40% of the sewage generated in Brazil is treated, with an estimated number of treatment plants in the order of 2,800. [20] National responsibility for wastewater and sewage treatment lies in the hands of the ministry of cities in Brazil. The ministry of cities consists of different ministries that each contribute to water supply and sanitation including wastewater and sewage treatment.

Responsibility for water supply and sanitation

Policy and regulation

At the national level the Ministry of Cities coordinates sector policies, which are implemented by various Ministries. For example, the Ministry of Health has certain attributions related to sanitation, and the Ministries of Regional Development and of Agriculture and Agrarian Reform have attributions in rural areas. Water resources management is the responsibility of the national water agency ANA.

Headquarters of the Department of Water and Wastewater (DAE) of the municipality of Santa Barbara d'Oeste, Sao Paulo. DAE SBO.JPG
Headquarters of the Department of Water and Wastewater (DAE) of the municipality of Santa Bárbara d'Oeste, São Paulo.

The Council of Cities is "a consultative and decision-making body with the purpose of 'proposing goals for the formulation and implementation of national urban development policy, as well as monitoring and assessing its execution". It includes a Consultative Technical Committee for Environmental Sanitation. Similar structures exist at the state and municipal levels. [8]

The National Water Supply and Sanitation Policy, approved by the Council of Cities, has identified six steps to improve service coverage and efficiency by encouraging a more competitive and better regulated environment: (1) the institutional separation of service providers and service regulators: (2) promotion of different decentralized alternatives for service provision; (3) promotion of social participation in service regulation and control; (4) use of low-cost technologies; (5) development of financially sustainable pricing schemes which include subsidies for low-income families where required to assure universal access to basic services; and (6) greater cooperation between federal and local authorities and civil society.

Regulation of service provision is a responsibility of the municipalities. Nevertheless, 14 Brazilian states have established regulatory agencies for public services that cover, among other sectors, water supply and sanitation. Given that the legal mandate for regulation rests with the municipalities, however, the role of these regulatory agencies in water and sanitation is minimal.

Service provision

According to the Brazilian constitution the provision of water and sanitation services is the responsibility of the country's 5,560 municipalities (see List of major cities in Brazil). However, state water and sewer companies 25 of Brazil's 27 states (see States of Brazil) are in charge of water services in about 3,887 municipalities with a population of 103 million, corresponding to about 75% of Brazil's urban population with water connections. They are also in charge of sewer services in 893 municipalities with a population of 45 million, corresponding to about 55% of the population. The two only states that have no water and sanitation company are Amazonas State and Mato Grosso [ citation needed ]

The state water and sanitation companies are as follows:

Water treatment plant of the Copasa (Companhia de Saneamento de Minas Gerais) in Coronel Fabriciano, Minas Gerais. Estacao de tratamento de agua de Coronel Fabriciano MG.jpg
Water treatment plant of the Copasa (Companhia de Saneamento de Minas Gerais) in Coronel Fabriciano, Minas Gerais.

Most state water and sewer companies are mixed public-private companies with the majority of shares owned by the respective state government. Three companies - Sabesp in São Paulo, Copasa in Minas Gerais and Sanepar in Paraná - have floated shares in the Brazilian stock market and one of them - Sabesp - also at the New York Stock Exchange. One state company, Saneatins in Tocantins, is majority-owned by the private sector with the state government owning only a minority of shares. [21] Some state companies operate under concession contracts with municipalities, while others operate under the authority of state governments. In some cases municipalities have challenged the legality of service provision by state companies that do not have concession contracts with municipalities.

Since 1996 65 municipalities in 10 states (Rio de Janeiro, São Paulo, Paraná, Espírito Santo, Mato Grosso and Pará among others) that serve 7 million customers signed concession contracts with private service providers either to provide only water services, only sewer services or both. [22]

According to the World Bank's Private Participation in Infrastructure database, investment commitments by the private sector in Brazil's water and sanitation sector reached US$3 bn in 1994-2004 through 52 projects. 3 projects were divestitures, 39 were concessions and 10 were greenfield projects in wastewater treatment plants. [23]

Some public service providers, both at the state and the municipal level, perform very well, while other perform poorly. Likewise, some private concessions are quite successful, while others have not lived up to expectations and their obligations.

Utility associations

About 2,000 municipal utilities and municipalities are associated in the National Association of Municipal Water and Sanitation Service Providers ASSEMAE, created in 1984. [24] Also in 1984, state water and sanitation companies have formed the Association of State Companies for Water Supply and Basic Sanitation AESBE. [25] In 1996 private service providers have formed the Brazilian Association of Private Water and Sanitation Concessionnaire (ABCON). [26] All three associations promote the interests of their member by influencing national policy.

Efficiency

Two common indicators of the operating efficiency of water and sanitation utilities are the level of non-revenue water (NRW) and labor productivity.

Non-revenue water in Brazil varies between 21% and a staggering 81%, reflecting huge differences in efficiency between service providers. [27] The average level of NRW in Brazil in 2006 was 40%, [28] roughly the same for state and municipal public water companies. The level has remained unchanged since 2000. The average NRW for private utilities, however, was only 30% in 2000. [29]

Labor productivity. Many public utilities in Brazil are overstaffed. In 2000 the staff ratio was lowest for state utilities (3.7), much higher for municipal utilities (5.8) and - surprisingly - highest for privately operated utilities (6.4). [29] Average labor productivity has since then increased from 4.4 to 3.7 employees/1000 water connections.

Financial aspects

Tariffs

Tariff level.In 2020, Water and sanitation tariffs in many Brazilian cities are relatively high compared to other Latin American cities. According to the urban water and sanitation information system SNIS the average water tariff of utilities participating in the system (which provide water services to 95% of the urban population) was the equivalent of US$0.68/m3 and the average sanitation tariff was US$0.67/m3, Also, the sewage tariffs for Brazilians was US$1.35/m3 for those connected to the sewer network. This compares to US$0.81/m3 in Chilean cities, US$0.79/m3 in Argentine cities and US$0.51/m3 in Peruvian cities. The ratio of sanitation to water tariffs of almost 1:1 is very high for Latin America and close to the ratio of the actual cost of the two services, while in most other Latin American countries sewer tariffs remain much lower than water tariffs.

Water and sewer tariffs vary substantially between cities. According to a 2005 study by the Latin American association of water and sanitation regulators ADERASA the typical monthly residential water bill for a consumption of 20 cubic meters per month was equivalent to US$17 in São Paulo, US$15 in Espírito Santo and US$10 in Pernambuco, compared to an average of US$11 among the 21 Latin American cities covered. [30]

Tariff structure and subsidies. In most parts of Brazil a low social tariff applies to the first block of consumption. In some cases a minimum consumption fee applies to all residential connections, and sometimes to commercial and institutional connections. Such subsidies benefit many who are not poor.[ citation needed ] However, some State Water Companies have improved the targeting of their social tariffs by using the cadastres established for the Bolsa Familia Conditional Cash Transfer program. This is the case in Paraná (SANEPAR), Pernambuco (COMPESA) and Bahia (EMBASA). In these cases the social tariff is limited to about 10% of the company's customers. [31]

Other utilities have introduced direct cash payments to needy families to help them pay their water bills. For example, the city of Brasilia has introduced such a scheme. The Federal District pays the water utility an amount equivalent to the water and sewerage bills of poor families consuming less than 10 cubic meters per month. The State Water Company in Goiais has introduced a similar program. In each case, about 20,000 families benefit from the program. However, not many municipalities in Brazil have the institutional capacity to administer such a targeted subsidy scheme. [32]

Change in tariffs over time. Tariffs in most cities increased moderately in the 2002-2005 period net of inflation. According to the SNIS the average urban water tariff increased by 57% and the average sanitation tariff increased by 54% in nominal value prices, while inflation stood at 40%, thus resulting in a moderate increase in real prices.

Affordability. According to data collected by the Pan-American Health Organization based on multi-purpose household surveys, the share of water expenditures in household expenditures in urban areas was the second-highest among 10 countries in Latin America and the Caribbean in the late 1990s. The share was on average 2.3% and 3.4% for households in the poorest income decile. [33]

Revenue collection

Overall revenue collection losses for state utilities in Brazil were about 12% in 2000, but this masks large variations among utilities. State utilities with the highest collection losses are in the North and those in the Center-West and South have consistently good collection ratios. A number of municipal utilities appear to have serious collection problems. [29]

Investment

In 2010-12 total investment in water and sanitation averaged about R$8 billion (US$3.4 billion) per year. The National Sanitation Plan (Plansab) approved in December 2013 foresees investments of around R$15 billion (US$6.8 billion) per year. [18] As of 2005 investments by service providers participating in the national water and sanitation information system SNIS stood at only 3.55 billion Brazilian Reals, including 1.53bn for water and 1.35bn for sanitation and 0.67bn for other investments. [34] It has been estimated that investments in water and sanitation infrastructure in the order of R$9.6 billion (US$4.5bn or $24 per capita or 0.7% of GDP) per year, or almost three times the level of 2005, would be needed to achieve universal access. The Program for the Acceleration of Economic Growth raised investment levels since then.

Financing

The great majority of investments in water and sanitation in Brazil are financed from domestic resources, with some additional financing from international financial institutions. In general, utilities with the greatest need to improve performance and expand services find it hardest to access funding, partially because they do not know how to access funding (including grant funding), partially because of weak institutional capacity, and partially because of their lack of creditworthiness.

Self-financing. By far the major source of funding in 2004 was self-financing by the utilities, accounting for 1.82bn Reals or 51% of all financing. [35] This is a remarkably high share by Latin American standards. However, it is less a reflection of financial strength of the utilities, but rather a symptom of a historically low level of investment in 2004.

State contributions funded by federal public banks and international financial institutions. The federally owned Caixa Economica Federal and the Brazilian Development Bank BNDES both play important roles in financing water supply and sanitation investments in Brazil. They administer large public pension funds, such as the FGTS, which invest, among others, in water and sanitation. However, loans from the Caixa and BNDES are not made directly to utilities, but to the states, which in turn pass on funds to the utilities as a non-reimbursable contribution to their capital. Loans to state governments from international financial institutions, such as the World Bank and the IDB, are also passed on to utilities as a non-reimbursable contribution to their capital.

The capital market. The financially most solid utilities also tap the capital market directly either through the Brazilian stock market or borrow from commercial Banks. The state water utility for São Paulo, Sabesp, is even listed on the New York Stock Exchange.

Output-based grants from the federal government. Since 2001 the federal government "buys" treated wastewater through an innovative program called PRODES, which allows utilities to access federal grants if they properly operate and maintain their wastewater treatment plants.

The National Health Foundation FUNASA. For small towns and rural areas a major source of funding is the National Health Foundation FUNASA under the Ministry of Health, which has invested 890 million Reales in 3,500 municipalities benefitting 11.43 million people between 1995 and 1999, mainly through its Programa Alvorada. [36]

Program for the Acceleration of Growth (PAC). In January 2007, the federal government announced a new Program for the Acceleration of Growth (PAC) that includes major investments in highways, airports, ports, energy, as well as providing housing, water and sewage that would benefit poor Brazilians. The program calls for a total of 504 billion real (235 billion U.S. dollars) through 2010, of which about 205 billion U.S. dollars would be provided by state-owned companies and the private sector, while the rest would come from the federal government. [17]

External cooperation

The most important external partners supporting the development of the Brazilian water and sanitation sector are the Inter-American Development Bank (IDB), the World Bank and Japan. Germany is also an important partner in some states. Support is provided in terms of financing as well as analytical and advisory activities.

Inter-American Development Bank

Approved on November 30, 2005, the US$140 million loan provides for sanitary infrastructure and institutional strengthening in the Educandos-Cuarenta basin.

Approved on November 26, 2003, the US$100 million loan aims to improve the sanitary and environmental conditions of the State of Ceará.

Approved on July 17, 2002, the US$47.6 million loan aims to improve water supply and sanitation in the city of Goiania.

Approved on October 17, 2001, the US$100 million loan provided for the construction of water and sewerage systems in communities for low-income communities of up to 75,000 inhabitants where HDI is below the national average.

Approved on December 6, 2000, the US$130 million loan aims to improve potable water and sewerage services, institutional efficiency, financial sustainability, private sector participation in management and investment financing for the Federal District of Brasília.

Approved on October 20, 1999, the US$200 million loan aims to improve the environmental quality of the Tiete River basin in the Sai Paulo Metropolitan Region.

World Bank

Loans. Loans provide not only infrastructure financing, but also policy advice and capacity building in order to improve the institutional framework for improved service delivery.

Dedicated water and sanitation loans

Approved on March 21, 2007, the US$28.78 million loan aims to promote better living conditions for the Uberaba Municipality through the integration of several components, including, flood protection (41%), sewerage (31%), and water supply 15%.

Approved on August 25, 2005, 70% of the US$159.04 loan aims at financing water, sanitation, and flood protection sector.

Approved on July 1, 2004, the US$62.3 loan is aimed at improving sewerage (75%) and water supply (15%) in the state of Espirito Santo.

Approval March 5, 1998, the US$300 million loan aims to improve the sewerage (53%) and water supply (36%) sectors.

Other loans with water and sanitation components

Approved on October 19, 2006, the US$40 million loan aims at financing basic social and economic infrastructure, including, water supply (15%).

Approved on December 6, 2005, the US$82.2 million loan aims at reducing urban poverty in a sustainable manner in the city of Salvador as well as other cities in the State of Bahia. The water, sanitation and flood protection sector receives 25% of the loan.

Approved on September 6, 2005, the US$46.8 million loan aims to assist the State of Minas Gerais to reduce high levels of poverty through several aspects, including, improvement of sewerage infrastructure (20%).

Approved July 12, 2005, the US$649 million loan aims to strengthen social inclusion in the State of Ceará through 24% of expenditures in water, sanitation, and flood protection.

Approved on December 7, 2004, the US$6.81 million loan aims to reduce urban and rural poverty through 25% expenditures in the water, sanitation, and flood protection sector.

Approved on July 1, 2004, the US$49.07 loan aims to assist the Betim Municipality in improving sewerage (40%).

Approved on April 24, 2003, the US$84 million loan seeks to enhance urbanization by improving water supply (30%) and solid waste management (30%).

Technical assistance, analysis and advice:

Japan

Approved on August 6, 2004, the 21.32 billion Yen loan finances the improvement and expansion of the sewage system and the development of an environmental monitoring system and improved water quality. The Japan Bank for International Cooperation (JBIC) is the loaning agency.

Germany

Germany supports water supply and sanitation projects in small and medium towns of the mostly poor and arid North-East of Brazil, as well as in the metropolitan area of Belo Horizonte.

See also

Related Research Articles

<span class="mw-page-title-main">Water supply and sanitation in Latin America</span>

Water supply and sanitation in Latin America is characterized by insufficient access and in many cases by poor service quality, with detrimental impacts on public health. Water and sanitation services are provided by a vast array of mostly local service providers under an often fragmented policy and regulatory framework. Financing of water and sanitation remains a serious challenge.

Water supply and sanitation in Mexico is characterized by achievements and challenges. Among the achievements is a significant increase in access to piped water supply in urban areas as well as in rural areas between 1990 and 2010. Additionally, a strong nationwide increase in access to improved sanitation was observed in the same period. Other achievements include the existence of a functioning national system to finance water and sanitation infrastructure with a National Water Commission as its apex institution; and the existence of a few well-performing utilities such as Aguas y Drenaje de Monterrey.

This article has been written in 2007 with partial updates since then, including most recently concerning access in 2012. Please feel free to update it further. The Spanish article includes some more up-to-date information.

Water supply and sanitation in Colombia have been improved in many ways over the past decades. Between 1990 and 2010, access to improved sanitation increased from 67% to 82%, but access to improved water sources increased only slightly from 89% to 94%. In particular, coverage in rural areas lags behind. Furthermore, despite improvements, the quality of water and sanitation services remains inadequate. For example, only 73% of those receiving public services receive water of potable quality and in 2006 only 25% of the wastewater generated in the country underwent any kind of treatment.

Uruguay is the only country in Latin America that has achieved quasi-universal coverage of access to safe drinking water supply and adequate sanitation. Water service quality is considered good, with practically all localities in Uruguay receiving disinfected water on a continuous basis. 70% of wastewater collected by the national utility was treated. Given these achievements, the government's priority is to improve the efficiency of services and to expand access to sewerage, where appropriate, in areas where on-site sanitation is used.

<span class="mw-page-title-main">Water supply and sanitation in Chile</span>

Water supply and sanitation in Chile were once considered efficient and equitable but have recently struggled to reliably provide water throughout the country. Chile's water resources have been strained by the Chilean water crisis, which was partially caused by a continuing mega drought that began in 2010, along with an increased demand for agricultural and other commercial interests.

Drinking water supply and sanitation coverage in Honduras has increased significantly in the last decades. However, the sector is still characterized by poor service quality and poor efficiency in many places. Coverage gaps still remain, particularly in rural areas.

Drinking water and sanitation in Nicaragua are provided by a national public utility in urban areas and water committees in rural areas. Despite relatively high levels of investment, access to drinking water in urban areas has barely kept up with population growth, access to urban sanitation has actually declined and service quality remains poor. However, a substantial increase in access to water supply and sanitation has been reached in rural areas.

<span class="mw-page-title-main">Water supply and sanitation in Argentina</span>

Drinking water supply and sanitation in Argentina is characterized by relatively low tariffs, mostly reasonable service quality, low levels of metering and high levels of consumption for those with access to services. At the same time, according to the WHO, 21% of the total population remains without access to house connections and 52% of the urban population do not have access to sewerage. The responsibility for operating and maintaining water and sanitation services rests with 19 provincial water and sewer companies, more than 100 municipalities and more than 950 cooperatives, the latter operating primarily in small towns. Among the largest water and sewer companies are Agua y Saneamientos Argentinos (AYSA) and Aguas Bonarenses S.A. (ABSA), both operating in Greater Buenos Aires, Aguas Provinciales de Santa Fe, and Aguas Cordobesas SA, all of them now publicly owned. In 2008 there were still a few private concessions, such as Aguas de Salta SA, which is majority-owned by Argentine investors, and Obras Sanitarias de Mendoza (OSM).

Bolivia's drinking water and sanitation coverage has greatly improved since 1990 due to a considerable increase in sectoral investment. However, the country continues to suffer from what happens to be the continent's lowest coverage levels and from low quality of services. Political and institutional instability have contributed to the weakening of the sector's institutions at the national and local levels. Two concessions to foreign private companies in two of the three largest cities—Cochabamba and La Paz/El Alto—were prematurely ended in 2000 and 2006 respectively. The country's second largest city, Santa Cruz de la Sierra, relatively successfully manages its own water and sanitation system by way of cooperatives. The government of Evo Morales intends to strengthen citizen participation within the sector. Increasing coverage requires a substantial increase of investment financing.

Water supply and sanitation in Venezuela is currently limited and many poor people remain without access to piped water. Service quality for those with access is mixed, with water often being supplied only on an intermittent basis and most wastewater not being treated. Non-revenue water is estimated to be high at 62%, compared to the regional average of 40%. The sector remains centralized despite a decentralization process initiated in the 1990s that has now been stalled. Within the executive, sector policies are determined by the Ministry of Environment. The national water company HIDROVEN serves about 80% of the population.

The water and sanitation sector in Peru has made important advances in the last two decades, including the increase of water coverage from 30% to 85% between 1980 and 2010. Sanitation coverage has also increased from 9% to 37% from 1985 to 2010 in rural areas. Advances have also been achieved concerning the disinfection of drinking water and in sewage treatment. Nevertheless, many challenges remain, such as:

The Dominican Republic has achieved impressive increases in access to water supply and sanitation over the past two decades. However, the quality of water supply and sanitation services remains poor, despite the country's high economic growth during the 1990s.

The Water supply and sanitation services in Portugal have seen important advances in access to services, technologies used and service quality over the past decades (1980s–1990s), partially achieved thanks to important funds from the European Union. Nevertheless, sanitation still remains relatively low in mountain rural areas and some people have their own sources of water controlled by municipalities.

Water privatization in Brazil has been initiated in 1996. In 2008 private companies provided 7 million Brazilians - 4% of the urban population - in 10 of the country's 26 states with drinking water. The private sector holds 65 concession contracts in the states of São Paulo, Rio de Janeiro, Espírito Santo, Mato Grosso, Mato Grosso do Sul, Santa Catarina, Minas Gerais, Paraná, Pará and Amazonas. Private companies have committed to invest 4.5 billion reais in the sector. The bulk of Brazil's population receives water and sanitation services from public municipal or state-level utilities.

<span class="mw-page-title-main">Water supply and sanitation in Mozambique</span>

Water supply and sanitation in Mozambique is characterized by low levels of access to at least basic water sources, low levels of access to at least basic sanitation and mostly poor service quality. In 2007 the government has defined a strategy for water supply and sanitation in rural areas, where 62% of the population lives. In urban areas, water is supplied by informal small-scale providers and by formal providers.

Water management in the Metropolitan Region of São Paulo, Brazil faces several challenges, including pollution of drinking water reservoirs that are surrounded by slums, water scarcity leading to conflicts with the Campinas Metropolitan area to the north, inefficient water use, and flooding. The sprawling Metropolitan Region of São Paulo (MRSP) with close to 20 million people is the seventh most populous urban area in the world and the economic, financial and technical hub of Brazil. The main stakeholders in water management in MRSP are the state government, the state water and sanitation utility Sabesp and 39 municipal governments. A basin committee for the Alto Tietê basin, which covers the entire area of the MRSP and supplies half of its water, brings together all stakeholders. It has drawn up two master plans for the management of water resources in the basin. The first was approved in 2003 and focused on urban sprawl. The second was approved in 2009 and focused on water use conflicts.

<span class="mw-page-title-main">Water supply and sanitation in Morocco</span>

Water supply and sanitation in Morocco is provided by a wide array of utilities. They range from private companies in the largest city, Casablanca, the capital, Rabat, Tangier, and Tetouan, to public municipal utilities in 13 other cities, as well as a national electricity and water company (ONEE). The latter is in charge of bulk water supply to the aforementioned utilities, water distribution in about 500 small towns, as well as sewerage and wastewater treatment in 60 of these towns.

<span class="mw-page-title-main">Water supply and sanitation in Turkey</span> Overview of water supply and sanitation in Turkey

Water supply and sanitation in Turkey is characterized by achievements and challenges. Over the past decades access to drinking water has become almost universal and access to adequate sanitation has also increased substantially. Autonomous utilities have been created in the 16 metropolitan cities of Turkey and cost recovery has been increased, thus providing the basis for the sustainability of service provision. Intermittent supply, which was common in many cities, has become less frequent. In 2004, 61% of the wastewater collected through sewers was being treated. In 2020 77% of water was used by agriculture, 10% by households and the rest by industry.

Water supply and sanitation in Malaysia is characterised by numerous achievements, as well as some challenges. Universal access to water supply at affordable tariffs is a substantial achievement. The government has also shown a commitment to make the sector more efficient, to create a sustainable funding mechanism and to improve the customer orientation of service providers through sector reforms enacted in 2006. The reform creates a modern institutional structure for the water sector, including an autonomous regulatory agency, an asset management company and commercialised state water companies that have to reach certain key performance indicators that will be monitored by the regulatory agency. The government has also stated its intention not to embark on new private sector contracts for water provision, after a bout of such contracts during the 1990s showed mixed results.

References

  1. 1 2 3 4 WHO/UNICEF (2015) Progress on sanitation and drinking water - 2015 update and MDG assessment, Joint Monitoring Programme for Water Supply and Sanitation
  2. Brazilian Institute for Geography and Statistics (IBGE):National Survey of Basic Sanitation (PNSB) 2000 pt:Pesquisa Nacional de Saneamento Básico
  3. (in Portuguese) SNIS: Diagnóstico dos Serviços de Água e Esgotos – 2006, p. 118; Exchange rate of 12/31/2006: 1 US$ = 2.1385 Real
  4. International Benchmarking Network for Water and Sanitation Utilities. Retrieved September 17, 2010.
  5. 1 2 WHO/UNICEF: Progress on Drinking Water and Sanitation
  6. 1 2 "Brazil". WASHWatch. Retrieved 21 March 2017.
  7. Sistema Nacional de Informações sobre Saneamento: Diagnóstico dos Serviços de Água e Esgotos – 2018. Brasília: SNSA/MCIDADES, 2018. 74 p. : il.
  8. 1 2 3 4 5 Léo Heller:Water and Sanitation Policies in Brazil:Historical Inequalities and Institutional Change, in: José Estaban Castro and Léo Heller (Editors):Water and Sanitation Services. Public Policy and Management, Earthscan, London 2009, pp. 321-337
  9. da Motta, Ronaldo Seroa, and Moreira, Ajax. 2006. "Efficiency and regulation in the sanitation sector in Brazil." Utilities Policy, 14: p. 186.
  10. 1 2 3 4 5 6 7 Marta T S Arretche: Water supply and sanitation, an undated article on the website of the Brazilian Ministry of Foreign Affairs, accessed in 2007
  11. 1 2 3 McNallen, Brendan. 2006. "Fixing the leaks in Brazil’s water law: Encouraging sound private sector participation through legal and regulatory reform." Gonzaga Journal of International Law, 9: p. 173-177.
  12. 1 2 Tupper, Henrique Cesar, and Resende, Marcelo. 2004. "Efficiency and regulatory issues in the Brazilian water and sewage sector: an empirical study." Utilities Policy, 12: pp. 30-31.
  13. Sabbioni, Guillermo. 2008. "Efficiency in the Brazilian sanitation sector." Utilities Policy, 16: p. 13. Arretche gives the percentage of municipal service provision at that time as only 20%.
  14. Lemos, Maria Carmen, and de Oliveira, João Lúcio Farias. 2005. "Water Reform across the State/Society Divide: The Case of Ceará, Brazil." Water Resources Development, 21(1): p. 137.
  15. Barraqué, B., Formiga Johnsson, R.M., and Britto, A.L. 2007. "Sustainable water services and interaction with water resources in Europe and in Brazil." Hydrology and Earth System Sciences Discussions, 4: 3454.
  16. (in Portuguese) Edson da Silva, Federação Nacional dos Urbanitários (FCU), 2006. FCU is a public-sector trade union
  17. 1 2 Brazil launches economic growth acceleration program, January 23, 2007
  18. 1 2 "Funding freeze threatens Brazilian water capex". Global Water Intelligence. p. 28. Retrieved 23 December 2013.
  19. 1 2 Gomes, Filumena Maria da Silva; Santo, Maria Cristina Carvalho do Espírito; Gryschek, Ronaldo César Borges; Bertolozzi, Maria Rita; França, Francisco Oscar de Siqueira (2020). "Access to drinking water and sewage treatment in Brazil: a challenge for the control of waterborne infectious diseases". Revista do Instituto de Medicina Tropical de São Paulo. 62: e71. doi:10.1590/s1678-9946202062071. ISSN   1678-9946. PMC   7534402 . PMID   33027395.
  20. "Urban Wastewater Treatment in Brazil | Publications" (PDF). publications.iadb.org. Retrieved 2021-04-28.
  21. (in Portuguese) (AESBE) Financiamiento de Investimentos em Saneamento Básico 2006.
  22. (in Portuguese) ABCON
  23. PPI database. "Country Snapshot Brazil" . Retrieved 2008-02-13.
  24. (in Portuguese) Associação Nacional dos Serviços Municipais de Saneamento (ASSEMAE)
  25. (in Portuguese) Associação das Empresas de Saneamento Básico Estaduais (AESBE)
  26. (in Portuguese) ABCON
  27. (in Portuguese) SNIS Diagnostic 2005, p.102-107
  28. Source: SNIS: Diagnóstico dos Serviços de Água e Esgotos – 2006, p. 107
  29. 1 2 3 World Bank:Brazil, Equitable, Competitive, Sustainable. Contributions for Debate. Chapter 11: Water, Poverty Reduction, and Sustainable Development] 2003, p. 21-27
  30. (in Spanish) ADERASA/PPIAF/World Bank: Las tarifas de agua potable y alcantarillado en America Latina, 2005, p. 55
  31. World Bank, Implementation Completion and Results Report, PROSANEAR-TAL, April 20020
  32. World Bank 2003, p. 21 and World Bank, Implementation Completion and Results Report, PROSANEAR-TAL, April 2008
  33. Rangel et al., Public Health 11(5/6), 2002 and especially Table on Household Expenditure
  34. (in Portuguese) SNIS Diagnostic 2005, p. 98
  35. (in Portuguese) SNIS Diagnostic 2005, p. 100
  36. (in Portuguese) FUNASA, Saneamiento at FUNASA

English

Portuguese