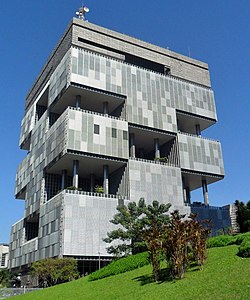
Energy in Brazil

Last updated
Petrobras world headquarters in Rio de Janeiro. The company is the most important energy producer in Brazil, as well as the country's second largest company, after Itau Unibanco. Edise.jpg
Petrobras world headquarters in Rio de Janeiro. The company is the most important energy producer in Brazil, as well as the country's second largest company, after Itaú Unibanco.
Energy mix of Brazil, 1965-2022 Energy mix Brazil.svg
Energy mix of Brazil, 1965–2022

Brazil is the 7th largest energy consumer in the world and the largest in South America. [1] [2] At the same time, it is an important oil and gas producer in the region and the world's second largest ethanol fuel producer. The government agencies responsible for energy policy are the Ministry of Mines and Energy (MME), the National Council for Energy Policy (CNPE), the National Agency of Petroleum, Natural Gas and Biofuels (ANP) and the National Agency of Electricity (ANEEL). [3] [4] [5] State-owned companies Petrobras and Eletrobras are the major players in Brazil's energy sector, as well as Latin America's. [6]

Contents

Overview

Sources of electricity in Brazil, 2000-2018 Brazil electricity generation by fuel types in 2000 through 2018 (47993181333).png
Sources of electricity in Brazil, 2000–2018
Development of carbon dioxide emissions CO2 emissions of Brazil.svg
Development of carbon dioxide emissions

In 2020, Brazil derived roughly one third of its total energy supply from oil, and another third from biofuels. Access to electricity across the country is almost universal, making Brazil’s energy sector one of the least carbon-intensive in the world. [7]

Brazil's place in the world rankings, 2019 [8]
Energy sourceindicatorrankyearquantityunity% world 'comments'
Crude oilProduction2019p145Mt3,3 % : United States (742 Mt), 2º : Russia (560 Mt), 3º : Saudi Arabia (546 Mt)
ElectricityProduction2018601TWh2,3 % : China (7149 TWh), 2º : United States (4434 TWh)
Net import201835TWh9,3 % : United States (44 TWh), 2º : Italy (44 TWh)
Electricity production by sourceRenewables2018495TWh7,4 % : China (1833 TWh), 2º : United States (743 TWh)
HydroelectricityProduction2018389TWh9,0 % : China (1232 TWh), 3º : Canada (386 TWh)
Power installed2018105GW8,1 % : China (352 GW), 3º : United States (103 GW)
% hydro/electric *201864,7 % : Norway (95,0 %)
Wind powerElectricity production201848TWh3,8 % : China (366 TWh), 2º : United States (276 TWh)
Power installed201814,4GW2,6 % : China (184.3 GW)
% wind/electric *20188,1 % : Spain (18,5 %)
BiomassPrimary energy consumption20193915PJ6,9 % : India (7998 PJ), 2º : China (5299 PJ), 3º : Nigeria (4929 PJ), 4º : United States (4540 PJ)
Electricity production [8] 201954,9TWh10,1 % : China (111,1 TWh), 2º : United States (56 TWh)
* % hydro/electric : share of hydroelectricity in electricity production (ranking on the top 10 producers)
2019p = provisional estimate for 2019.
Energy in Brazil, 2004–2013 [9] [10] [11]
CapitaPrim. energyProductionImportElectricityCO2-emission
MillionTWhTWhTWhTWhMt
2004183.92,3822,050364360323
2007191.62,7402,507289413347
2008192.02,8902,653314429365
2009193.72,7932,679182426338
2010195.03,0892,865289465388
2012196.73,1402,898333480408
2012R198.73,2762,930391498440
2013200.03,4152,941531517517
2014203.53,450504
Change 2004-106.0%30%40%-21%29%20%
Mtoe = 11.63 TWh, Prim. energy includes energy losses >

2012R = CO2 calculation criteria changed, numbers updated

Energy and electricity mix

Energy

In 2021, Brazil's energy consumption comprised a mix of sources, with crude oil and other petroleum liquids making up 44.2%, followed by renewables (including hydro) at 37.5%, natural gas at 11.6%, coal at 5.5%, and nuclear at 1.3%. Brazil's total energy production grew by an average annual rate of 1.5% from 2011 to 2021, primarily fueled by petroleum and other liquids. In 2021, Brazil's energy production accounted for 2.0% of global production and 48.8% of South America's total. Energy consumption in Brazil increased at a slower pace, with an average annual growth rate of 0.5% between 2011 and 2021, compared to 3.3% between 2000 and 2010. Brazil continues to be one of the world's largest energy consumers, accounting for 2.0% of global consumption and 53.3% of South America’s consumption. [12]

Electricity

In the electric energy matrix, the difference between Brazil and the world is even greater: while the world only had 25% of renewable electric energy in 2019, Brazil had 83%. The Brazilian electric matrix is composed of: hydroelectric energy, 64.9%; biomass, 8.4%; wind energy, 8.6%; solar electric, 1%; natural gas, 9.3%; oil products, 2%; nuclear, 2.5%; coal and derivatives, 3.3%. [13]

Reforms of the energy sector

At the end of the 1990s and the beginning of the 2000s, Brazil's energy sector underwent market liberalization. In 1997, the Petroleum Investment Law was adopted, [14] establishing a legal and regulatory framework, and liberalizing oil production. It created the CNPE and the ANP, increased use of natural gas, increased competition in the energy market, and increased investment in power generation. The state monopoly on oil and gas exploration ended,[ how? ] and energy subsidies were reduced. However, the government retained monopoly control of key energy complexes and regulated the price of certain energy products. [15]

Current[ when? ] government policies concentrate mainly on improving energy efficiency in both residential and industrial sectors, as well as increasing use of renewable energy. Further restructuring of the energy sector will be one of the key issues for ensuring sufficient energy investments to meet the rising need for fuel and electricity. [15]

Primary energy sources

Oil

Launch ceremony for oil platform P-52, which operates in the Campos Basin Plataforma P-52.jpg
Launch ceremony for oil platform P-52, which operates in the Campos Basin
Oil-based Arembepe thermal power plant in Camacari, Bahia Termeletrica Camacari.jpg
Oil-based Arembepe thermal power plant in Camaçari, Bahia

Brazil is the world's 8th-largest oil producer. Up to 1997, the government-owned Petróleo Brasileiro S.A. (Petrobras) had a monopoly on oil. More than 50 oil companies were engaged in oil exploration by 2006. [3] The only global oil producer is Petrobras, with an output of more than 2 million barrels (320,000 m3) of oil equivalent per day. It is also a major distributor of oil products, and owns oil refineries and oil tankers. [16]

In 2006, Brazil had 11.2 billion barrels (1.78×10⁹ m3) the second-largest proven oil reserves in South America after Venezuela. The vast majority of proven reserves were located in the Campos and Santos offshore basins off the southeast coast of Brazil. [16] In November 2007, Petrobras announced that it believed the offshore Tupi oil field had between 5 and 8 billion barrels (1.3×10⁹ m3) of recoverable light oil and neighbouring fields may even contain more, which all in all could result in Brazil becoming one of the largest producers of oil in the world. [17]

Brazil has been a net exporter of oil since 2011. [18] However, the country still imports some light oil from the Middle East, because several refineries, built in the 1960s and 1970s under the military government, are not suited to process the heavy oil in Brazilian reserves, discovered decades later.

Transpetro, a wholly owned subsidiary of Petrobras, operates a crude oil transport network. The system consists of 6,000 kilometres (3,700 mi) of crude oil pipelines, coastal import terminals, and inland storage facilities. [16]

Oil shale

Brazil has the world's second largest known oil shale (the Irati shale and lacustrine deposits) resources and has second largest shale oil production after Estonia. Oil shale resources lie in São Mateus do Sul, Paraná, and in Vale do Paraíba. Brazil has developed the world's largest surface oil shale pyrolysis retort Petrosix, operated by Petrobras. Production in 1999 was about 200,000 tonnes. [19] [20]

Natural gas

Cars fueled by natural gas, such as this Fiat Siena, are common in Brazil. SAO 09 2008 Fiat Siena TetraFuel 2 views v1.jpg
Cars fueled by natural gas, such as this Fiat Siena, are common in Brazil.

As of January 2023, Brazil possesses natural gas reserves totaling approximately 13.4 trillion cubic feet (Tcf), placing it fourth among Central and South American nations. These reserves primarily consist of associated gas from oil fields, notably within the pre-salt reserves. Approximately 76% of these reserves are located offshore in the Santos Basin, with the remaining 24% situated onshore, primarily in the Solimões Basin and Paranaíba Basin. [12]

At the end of 2017, the proven reserves of Brazil's natural gas were 369 x 109 m³, with possible reserves expected to be 2 times higher. [21] Petrobras controls over 90 percent of Brazil's natural gas reserves. [16]

Brazil's inland gas pipeline systems are operated by Petrobras subsidiary Transpetro. In 2005, construction began on the Gas Unificação (Gasun pipeline) which will link Mato Grosso do Sul in southwest Brazil, to Maranhão in the northeast. China's Sinopec is a contractor for the Gasene pipeline, which will link the northeast and southeast networks. Petrobras is also constructing the Urucu-Manaus pipeline, which will link the Urucu gas reserves to power plants in the state of Amazonas. [16] In 2015 the sale of 255 parcels for fracking was opposed with protest actions during and at the auction. [22]

In 2005, the gas production was 18.7 x 10⁹ m³, which is less than the natural gas consumption of Brazil. [3] Gas imports come mainly from Bolivia's Rio Grande basin through the Bolivia-Brazil gas pipeline (Gasbol pipeline), from Argentina through the Transportadora de Gas de Mercosur pipeline (Paraná-Uruguaiana pipeline), and from LNG imports. Brazil has held talks with Venezuela and Argentina about building a new pipeline system Gran Gasoducto del Sur linking the three countries; however, the plan has not moved beyond the planning stages. [16]

Coal

In 2004, Brazil had total coal reserves of about 30 billion tonnes, but the deposits vary by the quality and quantity. The proved recoverable reserves were approximately 10 billion tonnes. [23] In 2004 Brazil produced 5.4 million tonnes of coal, while coal consumption reached 21.9 million tonnes. [3] Almost all of Brazil's coal output is steam coal, of which about 85% is fired in power stations. Reserves of sub-bituminous coal are located mostly in the states of Rio Grande do Sul, Santa Catarina and Paraná. [23]

Uranium

Machinery for the extraction of uranium hexafluoride in a military facility at Ipero, built with Brazilian technology Usina de Hexafluoreto de Uranio.jpg
Machinery for the extraction of uranium hexafluoride in a military facility at Iperó, built with Brazilian technology

Brazil has the 6th largest uranium reserves in the world. [24] Deposits of uranium are found in eight different states of Brazil. Proven reserves are 162,000 tonnes. Cumulative production at the end of 2002 was less than 1,400 tonnes. The Poços de Caldas production centre in Minas Gerais state was shut down in 1997 and was replaced by a new plant at Lagoa Real in Bahia.

Electricity

Power sector reforms were launched in the mid-1990s and a new regulatory framework was applied in 2004. In 2004, Brazil had 86.5 GW of installed generating capacity and it produced 387 Twh of electricity. [3] As of today 66% of distribution and 28% of power generation is owned by private companies. [3] In 2004, 59 companies operated in power generation and 64 in electricity distribution. [5]

The major power company is Centrais Elétricas Brasileiras (Eletrobrás), which together with its subsidiaries generates and transmits approximately 60% of Brazil's electric supply. The largest private-owned power company is Tractebel Energia. [16] An independent system operator (Operador Nacional do Sistema Elétrico  [ pt ] - ((ONS)), responsible for the technical coordination of electricity dispatching and the management of transmission services, and a wholesale market were created in 1998. [5]

During the electricity crisis in 2001, [25] the government launched a program to build 55 gas-fired power stations with a total capacity of 22 GW, but only 19 power stations were built, with a total capacity of 4,012 MW. [15]

In 2021, Brazil was the world's sixth-largest electricity producer, generating 663 terawatt-hours (TWh), which represented 2% of global electricity generation. From 2011 to 2021, Brazil's electricity generation increased at an average annual rate of 2.4%, driven by growth in solar power (199%), wind power (40%), and fossil fuels (13%). In 2021, the most important sources of electricity generation were hydropower, contributing 55% of total electricity, followed by natural gas with 15%, and wind with 11%. The principal consumers of electricity were the industrial sector (39%), residential areas (29%), and commercial and public services (25%). [12]

Hydropower

Itaipu Dam, the world's largest hydroelectric dam by generating capacity Itaipu Decembre 2007 - Vue Generale.jpg
Itaipu Dam, the world's largest hydroelectric dam by generating capacity

In 2006, Brazil was the third largest hydroelectricity producer in the world after China and Canada. [3] The gross theoretical capability exceeds 3,000 TWh per annum, of which 800 TWh per annum is economically exploitable. [23] In 2004, Brazil produced 321TWh of hydropower. [26] In 2019, Brazil had 217 hydroelectric plants in operation, with an installed capacity of 98,581 MW, 60.16% of the country's energy generation. [27] At the end of 2021 Brazil was the 2nd country in the world in terms of installed hydroelectric power (109.4 GW). [28]

In total electricity generation, in 2019 Brazil reached 170,000 megawatts of installed capacity, more than 75% from renewable sources (the majority, hydroelectric plants). [29] [30]

In 2013, the Southeast used about 50% of the load of the National Integrated System (SIN), being the main energy consuming region in the country. The region's installed electricity generation capacity totaled almost 42,500 MW, which represented about a third of Brazil's generation capacity. The hydroelectric generation represented 58% of the installed capacity in the region, with the remaining 42% basically corresponding to the thermoelectric generation. São Paulo accounted for 40% of this capacity; Minas Gerais by about 25%; Rio de Janeiro by 13.3%; and Espírito Santo for the rest. [31]

The South Region has the Itaipu Dam, which was the largest hydroelectric plant in the world for several years, until the inauguration of the Three Gorges Dam in China. Remains the world's second largest operational hydroelectric power plant. Brazil co-owns the Itaipu Dam with Paraguay: the dam is on the Paraná River, located on the border between the countries. It has an installed generation capacity of 14 GW by 20 generating units of 700 MW each. [32]

Northern Brazil has large hydroelectric plants such as Belo Monte and Tucuruí, which produce much of the national energy.

Brazil's hydroelectric potential has not yet been fully explored, so the country still has the capacity to build several renewable energy plants in its territory.

Wind energy

Wind farm in Parnaiba, Piaui Energia Eolica.jpg
Wind farm in Parnaíba, Piauí
Mean wind speed in Brazil Mean-wind-speed-map-brazil-global-wind-atlas.png
Mean wind speed in Brazil

In July 2022 Brazil reached 22 GW of installed wind power. [34] [35] In 2021 Brazil was the 7th country in the world in terms of installed wind power (21 GW), [36] [37] and the 4th largest producer of wind energy in the world (72 TWh), behind only China, USA and Germany. [38]

Brazil's gross wind resource potential was estimated, in 2019, to be about 522 GW (this, only onshore), enough energy to meet three times the country's current demand. [39] [40] As of August 2021, according to ONS, total installed capacity was 18.9 GW, with average capacity factor of 58%. [41] While the world average wind production capacity factors is 24.7%, there are areas in Northern Brazil, specially in Bahia State, where some wind farms record with average capacity factors over 60%; [42] [43] the average capacity factor in the Northeast Region is 45% in the coast and 49% in the interior. [44] In 2019, wind energy represented 9% of the energy generated in the country. [27] In 2020 Brazil was the 8th country in the world in terms of installed wind power (17.2 GW); [36] in November 2021 Brazil reached 20 GW of installed wind power. [45]

Solar power

Pirapora Solar Complex, one of the largest in Latin America, with a capacity of 321 MW Usina solar de Pirapora 2.gif
Pirapora Solar Complex, one of the largest in Latin America, with a capacity of 321 MW

In October 2022 Brazil reached 21 GW of installed solar power. [46] [47] In 2021, Brazil was the 14th country in the world in terms of installed solar power (13 GW), [48] and the 11th largest producer of solar energy in the world (16.8 TWh). [49]

As of August 2021, according to ONS, total installed capacity of photovoltaic solar was 10.5 GW, with average capacity factor of 21%. Some of the most irradiated Brazilian States are MG ("Minas Gerais"), BA ("Bahia") and GO (Goiás), which have indeed world irradiation level records. [50] [43] [51] In 2019, solar power represented 1,27% of the energy generated in the country. [27] In 2020, Brazil was the 14th country in the world in terms of installed solar power (7.8 GW). [36]

Nuclear energy

Angra Nuclear Power Plant in Angra dos Reis, Rio de Janeiro Angra dos Reis - usinas nucleares.jpg
Angra Nuclear Power Plant in Angra dos Reis, Rio de Janeiro

Nuclear energy accounts for about 4% of Brazil's electricity. [52] The nuclear power generation monopoly is owned by Eletronuclear (Eletrobrás Eletronuclear S/A), a wholly owned subsidiary of Eletrobrás. Nuclear energy is produced by two reactors at Angra. It is located at the Central Nuclear Almirante Álvaro Alberto (CNAAA) on the Praia de Itaorna in Angra dos Reis, Rio de Janeiro. It consists of two pressurized water reactors, Angra I, with capacity of 657 MW, connected to the power grid in 1982, and Angra II, with capacity of 1,350 MW, connected in 2000. A third reactor, Angra III, with a projected output of 1,350 MW, is planned to be finished by 2014 and work has been paralyzed due to environmental concerns, but the licenses are being approved and the heavy construction work will start in 2009. By 2025 Brazil plans to build seven more reactors. [53]

Brazil signed a nuclear cooperation agreement with Argentina since 1991. [54]

Biofuels

Ethanol distillery in Piracicaba, Sao Paulo Piracicaba 10 2008 185 Costa Pinta Distillary.jpg
Ethanol distillery in Piracicaba, São Paulo

In 2021, Brazil was the world's second-largest biofuel producer, accounting for 20% of global production, after the United States. From 2011 to 2021, Brazil's average annual biofuel production and consumption grew by 3% and 4%, respectively. Due to the seasonal nature of biofuel production, Brazil imports biofuels during off-peak periods to satisfy demand. In 2021, the country consumed 569,000 barrels per day, with bioethanol constituting 79% and biodiesel 21%. [12]

In 2020, Brazil reached an installed capacity of 15.2 gigawatts (GW) for energy production derived from solid biofuels and renewable waste. [55]

Due to its ethanol fuel production, Brazil has sometimes been described as a bio-energy superpower. [56] Ethanol fuel is produced from sugar cane. Brazil has the largest sugar cane crop in the world, and is the largest exporter of ethanol in the world. With the 1973 oil crisis, the Brazilian government initiated in 1975 the Pró-Álcool program. The Pró-Álcool or Programa Nacional do Álcool (National Alcohol Program) was a nationwide program financed by the government to phase out all automobile fuels derived from fossil fuels in favour of ethanol. The program successfully reduced by 10 million the number of cars running on gasoline in Brazil, thereby reducing the country's dependence on oil imports.

The production and consumption of biodiesel is expected to reach to 2% of diesel fuel in 2008 and 5% in 2013. [3]

Brazil's peat reserves are estimated at 25 billion tonnes, the highest in South America. However, no production of peat for fuel has yet been developed. Brazil produces 65 million tonnes of fuelwood per year. The annual production of charcoal is about 6 million tonnes, used in the steel industry. The cogeneration potential of agricultural and livestock residues varies from 4 GW to 47 GW by 2025. [23]

Related Research Articles

<span class="mw-page-title-main">Economy of Brazil</span>

The economy of Brazil is historically the largest in Latin America and the Southern Hemisphere in nominal terms. The Brazilian economy is the second largest in the Americas. It is an upper-middle income developing mixed economy. In 2023, according to International Monetary Fund (IMF), Brazil has the 9th largest gross domestic product (GDP) in the world and has the 8th largest purchasing power parity in the world.

<span class="mw-page-title-main">Economy of South America</span>

The economy of South America comprises approximately 434 million people living in the 12 nations and three territories of South America, which encompasses 6 percent of the world's population. South America ranks fifth in terms of nominal GDP by continent, behind North America and after Oceania. Uruguay stands out as it boasts the highest GDP per capita in the region. Renowned for its stable political environment, strong social welfare system, and diversified economy, Uruguay has consistently ranked among the top nations in terms of human development and standard of living. Uruguay has a large agriculture sector and has made previous strategic investments in technology and innovation, Uruguay’s economy thrives on both domestic consumption and international trade. Guyana ranks second which is attributed to its oil and gas sector.

<span class="mw-page-title-main">Iberdrola</span> Spanish multinational electric utility monopoly

Iberdrola is a Spanish multinational electric utility company based in Bilbao, Spain. Iberdrola has a workforce of around 40,000 employees serving around 30 million customers. Subsidiaries include Scottish Power and a significant part of Avangrid, amongst others. As of 2023, the largest shareholder of the company is the Qatar Investment Authority, with BlackRock and Norges Bank also holding significant interests.

<span class="mw-page-title-main">Wind power in Spain</span>

Spain is one of the countries with the largest wind power capacity installed, with over 27 GW in 2020. In 2013, it had become the first country in the world to have wind power as its main source of energy.

<span class="mw-page-title-main">Renewable energy in Portugal</span>

Renewable energy in Portugal was the source for 25.7% of total energy consumption in 2013. In 2014, 27% of Portugal's energy needs were supplied by renewable sources. In 2016, 28% of final energy consumption in Portugal came from renewable sources.

<span class="mw-page-title-main">Renewable energy in Brazil</span> Renewable energy in Brazil

As of 2018, renewable energy accounted for 79% of the domestically produced electricity used in Brazil.

The electricity sector in Argentina constitutes the third largest power market in Latin America. It relies mostly on thermal generation and hydropower generation (36%). The prevailing natural gas-fired thermal generation is at risk due to the uncertainty about future gas supply.

As of August 2020 Chile had diverse sources of electric power: for the National Electric System, providing over 99% of the county's electric power, hydropower represented around 26.7% of its installed capacity, biomass 1.8%, wind power 8.8%, solar 12.1%, geothermal 0.2%, natural gas 18.9%, coal 20.3%, and petroleum-based capacity 11.3%. Prior to that time, faced with natural gas shortages, Chile began in 2007 to build its first liquefied natural gas terminal and re-gasification plant at Quintero near the capital city of Santiago to secure supply for its existing and upcoming gas-fired thermal plants. In addition, it had engaged in the construction of several new hydropower and coal-fired thermal plants. But by July 2020 91% of the new capacity under construction was of renewable power, 46.8% of the total solar and 25.6% wind, with most of the remainder hydro.

<span class="mw-page-title-main">Renewable energy in Spain</span> Overview of renewable energy in Spain

Renewable energy in Spain, comprising bioenergy, wind, solar, and hydro sources, accounted for 15.0% of the Total Energy Supply (TES) in 2019. Oil was the largest contributor at 42.4% of the TES, followed by gas, which made up 25.4%.

<span class="mw-page-title-main">Energy in Russia</span> Overview of the production, consumption, import and export of energy and electricity in Russia

The Energy in Russia is an area of the national economy, science, and technology of the Russian Federation, encompassing energy resources, production, transmission, transformation, accumulation, distribution, and consumption of various types of energy.

<span class="mw-page-title-main">Energy in Mexico</span> Overview of the production, consumption, import and export of energy and electricity in Mexico

Energy in Mexico describes energy and electricity production, consumption and import in Mexico.

<span class="mw-page-title-main">Energy in Romania</span>

Energy in Romania describes energy and electricity production, consumption and import in Romania.

Brazil has the largest electricity sector in Latin America. Its capacity at the end of 2021 was 181,532 MW. The installed capacity grew from 11,000 MW in 1970 with an average yearly growth of 5.8% per year. Brazil has the largest capacity for water storage in the world, being dependent on hydroelectricity generation capacity, which meets over 60% of its electricity demand. The national grid runs at 60 Hz and is powered 83% from renewable sources. This dependence on hydropower makes Brazil vulnerable to power supply shortages in drought years, as was demonstrated by the 2001–2002 energy crisis.

<span class="mw-page-title-main">Electricity sector in Uruguay</span>

The electricity sector of Uruguay has traditionally been based on domestic hydropower along with thermal power plants, and reliant on imports from Argentina and Brazil at times of peak demand. Over the last 10 years, investments in renewable energy sources such as wind power and solar power allowed the country to cover in early 2016 94.5% of its electricity needs with renewable energy sources.

<span class="mw-page-title-main">Energy in Uruguay</span>

Not to be confused with Electricity sector in Uruguay

<span class="mw-page-title-main">Energy in Spain</span> Overview of the production, consumption, import and export of energy and electricity in Spain

Primary energy consumption in Spain in 2020 was mainly composed of renewable sources. The largest sources are petroleum (42.3%), natural gas (19.8%) and coal (11.6%). The remaining 26.3% is accounted for by nuclear energy (12%) and different renewable energy sources (14.3%). Domestic production of primary energy includes nuclear (44,8%), solar, wind and geothermal (22,4%), biomass and waste (21,1%), hydropower (7,2%) and fossil (4,5%).

<span class="mw-page-title-main">Energy in Greece</span> Overview of the production, consumption, import and export of energy and electricity in Greece

Energy in Greece is dominated by fossil gas and oil. Electricity generation is dominated by the one third state owned Public Power Corporation. In 2009 DEI supplied for 85.6% of all electric energy demand in Greece, while the number fell to 77.3% in 2010. Almost half (48%) of DEI's power output in 2010 was generated using lignite. 12% of Greece's electricity comes from hydroelectric power plants and another 20% from natural gas. Between 2009 and 2010, independent companies' energy production increased by 56%, from 2,709 Gigawatt hour in 2009 to 4,232 GWh in 2010.

<span class="mw-page-title-main">Renewable energy in Italy</span>

Renewable energy has developed rapidly in Italy over the past decade and provided the country a means of diversifying from its historical dependency on imported fuels. Solar power accounted for around 8% of the total electric production in the country in 2014, making Italy the country with the highest contribution from solar energy in the world that year. Rapid growth in the deployment of solar, wind and bio energy in recent years lead to Italy producing over 40% of its electricity from renewable sources in 2014.

Energy in Estonia has heavily depended on fossil fuels. Finland and Estonia are two of the last countries in the world still burning peat.

<span class="mw-page-title-main">Latin American economy</span> Overview of the economy of Latin American

Latin America as a region has multiple nation-states, with varying levels of economic complexity. The Latin American economy is an export-based economy consisting of individual countries in the geographical regions of North America, Central America, South America, and the Caribbean. The socioeconomic patterns of what is now called Latin America were set in the colonial era when the region was controlled by the Spanish and Portuguese empires. Up until independence in the early nineteenth century, colonial Latin American regional economies thrived and worked things out. Many parts of the region had favorable factor endowments of deposits of precious metals, mainly silver, or tropical climatic conditions and locations near coasts that allowed for the development of cane sugar plantations. In the nineteenth century following independence, many economies of Latin America declined. In the late nineteenth century, much of Latin America was integrated into the world economy as an exporter of commodities. Foreign capital investment, construction of infrastructure, such as railroads, growth in the labor sector with immigration from abroad, strengthening of institutions, and expansion of education aided industrial growth and economic expansion. A number of regions have thriving economies, but "poverty and inequality have been deeply rooted in Latin American societies since the early colonial era."

References

  1. "Primary energy consumption by country 2022". Statista. Retrieved 2024-01-17.
  2. Pottmaier, D.; Melo, C. R.; Sartor, M. N.; Kuester, S.; Amadio, T. M.; Fernandes, C. A. H.; Marinha, D.; Alarcon, O. E. (2013-03-01). "The Brazilian energy matrix: From a materials science and engineering perspective". Renewable and Sustainable Energy Reviews. 19: 678–691. doi:10.1016/j.rser.2012.11.063. ISSN   1364-0321.
  3. 1 2 3 4 5 6 7 8 OECD/IEA. World Energy Outlook 2006. ISBN   92-64-10989-7
  4. "Project Closing Report. Natural Gas Centre of Excellence Project. Narrative" (PDF). 20 March 2005. Archived from the original (PDF) on 2007-09-27. Retrieved 2007-05-12.
  5. 1 2 3 "OECD Economic Survey of Brazil 2005: Regulation of the electricity sector" (PDF). Retrieved May 12, 2007.
  6. Silvestre, B. S., Dalcol, P. R. T. Geographical proximity and innovation: Evidences from the Campos Basin oil & gas industrial agglomeration — Brazil. Technovation (2009), doi : 10.1016/j.technovation.2009.01.003
  7. "Brazil - Countries & Regions". IEA. Retrieved 2024-01-16.
  8. 1 2 Data and statistics : Brazil - Electricity 2019, International Energy Agency, retrieved October 2021.
  9. IEA Key World Energy Statistics Statistics 2015 Archived 2016-03-04 at the Wayback Machine , 2014 (2012R as in November 2015 Archived 2015-04-05 at the Wayback Machine + 2012 as in March 2014 is comparable to previous years statistical calculation criteria, 2013 Archived 2014-09-02 at the Wayback Machine , 2012 Archived 2013-03-09 at the Wayback Machine , 2011 Archived 2011-10-27 at the Wayback Machine , 2010 Archived 2010-10-11 at the Wayback Machine , 2009 Archived 2013-10-07 at the Wayback Machine , 2006 Archived 2009-10-12 at the Wayback Machine IEA October, crude oil p.11, coal p. 13 gas p. 15
  10. "Brazil Energy Information | Enerdata". www.enerdata.net. 2024-01-03. Retrieved 2024-01-16.
  11. "Brazil CO2 Emissions - Worldometer". www.worldometers.info. Retrieved 2024-01-16.
  12. 1 2 3 4 "International - U.S. Energy Information Administration (EIA)". www.eia.gov. Retrieved 2024-04-11.
  13. Matriz Energética e Elétrica
  14. "Brazil's Senate approves new petroleum investment law". Oil and Gas Journal. PennWell Petroleum Group. July 28, 1997. Retrieved February 11, 2018.
  15. 1 2 3 "Critical issues in Brazil's energy sector" (PDF). Baker Institute. June 2004. Archived from the original (PDF) on 2007-07-09. Retrieved 2007-05-19.
  16. 1 2 3 4 5 6 7 Country Analysis Brief. Brazil, US Energy Information Agency, August 2006
  17. Gary Duffy (2007-11-09). "Brazil announces new oil reserves". BBC. Retrieved 2007-12-12.
  18. "Brasil se tornará exportador líquido de petróleo em 2011, diz AIE". Archived from the original on 2018-02-13. Retrieved 2011-02-23.
  19. Review on oil shale data Archived 2007-09-28 at the Wayback Machine , by Jean Laherrere, September 2005
  20. Altun, N. E.; Hiçyilmaz, C.; Hwang, J.-Y.; Suat Bağci, A.; Kök, M. V. (2006). "Oil Shales in the world and Turkey; reserves, current situation and future prospects: a review" (PDF). Oil Shale. A Scientific-Technical Journal . 23 (3): 211–227. doi:10.3176/oil.2006.3.02. ISSN   0208-189X. S2CID   53395288 . Retrieved 2007-06-16.
  21. Thania. "ANP divulga dados de reservas de petróleo e gás em 2017". www.anp.gov.br (in Brazilian Portuguese). Archived from the original on 2020-02-20. Retrieved 2018-10-28.
  22. 350.org (2023-06-09). "Creating Bold Safe Actions Despite Repression: Lessons from Brazil". The Commons Social Change Library. Retrieved 2023-07-05.{{cite web}}: CS1 maint: numeric names: authors list (link)
  23. 1 2 3 4 "Survey of energy resources" (PDF). World Energy Council. 2004. Archived from the original (PDF) on 2018-02-12. Retrieved 2007-07-13.
  24. Ronaldo C. Fabrício (March 20, 2005). "Outlook of Nuclear Power in Brazil" (PDF). Eletronuclear. Archived from the original (PDF) on October 6, 2007. Retrieved 2007-05-12.
  25. "A struggle for power". The Economist. Retrieved 2018-09-24.
  26. "Key World Energy Statistics -- 2006 Edition" (PDF). International Energy Agency. 2006. Archived from the original (PDF) on 2007-07-09. Retrieved 2007-07-13.
  27. 1 2 3 Quantas usinas geradoras de energia temos no Brasil?
  28. "RENEWABLE CAPACITY STATISTICS 2022" (PDF). IRENA. Retrieved 19 May 2022.
  29. "Brasil alcança 170 mil megawatts de capacidade instalada em 2019". Archived from the original on 2021-04-13. Retrieved 2020-07-21.
  30. "IEMA (Instituto de Energia e Meio Ambiente),2016.Série TERMOELETRICIDADE EM FOCO: Uso de água em termoelétricas" (PDF). Archived from the original (PDF) on 2018-04-01.
  31. O BNDES e a questão energética e logística da Região Sudeste
  32. "Power: World's biggest hydroelectric facility". USGS. Archived from the original on May 19, 2006. Retrieved May 18, 2006.
  33. "Global Wind Atlas" . Retrieved 7 December 2018.
  34. Eólica supera 22 GW em operação no Brasil
  35. "Brasil atinge 21 GW de capacidade instalada de energia eólica" (in Brazilian Portuguese). Valor. 2022-01-21. Retrieved 2022-03-05.
  36. 1 2 3 RENEWABLE CAPACITY STATISTICS 2021
  37. "Global wind statistics" (PDF). IRENA. 2022-04-22. Retrieved 2022-04-22.
  38. Hannah Ritchie and Max Roser, Wind Power generation
  39. Ventos promissores a caminho
  40. "Brazilian onshore wind potential could be 880 GW, study indicates". Archived from the original on 2020-08-14. Retrieved 2020-11-01.
  41. "Boletim Mensal de Geração Eólica Agosto/2021" (PDF) (in Portuguese). Operador Nacional do Sistema Elétrico - ONS. 2021-09-29. pp. 6, 14. Retrieved 2021-10-13.
  42. "Brasil é o país com melhor fator de aproveitamento da energia eólica". Governo do Brasil (in Brazilian Portuguese). Archived from the original on 2018-10-07. Retrieved 2018-10-07.
  43. 1 2 "Invest in Brazil". CAPITAL INVEST: Top M&A Financial Advisors in Brazil (Sao Paulo). 2018-08-23. Retrieved 2018-10-07.
  44. "Boletim Trimestral de Energia Eólica – Junho de 2020" (PDF) (in Brazilian Portuguese). Empresa de Pesquisa Energética. 2020-06-23. p. 4. Retrieved 2020-10-24.
  45. "Geração eólica ultrapassa os 20 GW de capacidade instalada no Brasil" (in Brazilian Portuguese). ANEEL. 2021-11-19. Archived from the original on 2021-12-02. Retrieved 2021-11-29.
  46. Solar atinge 21 GW e R$ 108,6 bi em investimentos no Brasil
  47. "Brasil é 4º país que mais cresceu na implantação de energia solar em 2021" (in Brazilian Portuguese). R7. 2022-04-25. Retrieved 2022-05-27.
  48. RENEWABLE CAPACITY STATISTICS 2022
  49. Hannah Ritchie, Max Roser: Solar Power Generation
  50. "Quais as melhores regiões do Brasil para geração de energia fotovoltaica? - Sharenergy". Sharenergy (in Brazilian Portuguese). 2017-02-03. Archived from the original on 2018-10-07. Retrieved 2018-10-07.
  51. "Boletim Mensal de Geração Solar Fotovoltaica Agosto/2021" (PDF) (in Portuguese). Operador Nacional do Sistema Elétrico - ONS. 2021-09-29. pp. 6, 13. Retrieved 2021-10-13.
  52. "Nuclear Power in Brazil. Briefing Paper # 95". Uranium Information Centre. May 2007. Archived from the original on 2007-02-08. Retrieved 2007-05-19.
  53. "Brazil plans to build seven nuclear reactors". Mecropress. 23 October 2006. Archived from the original on 2007-02-19. Retrieved 2007-05-19.
  54. Brasil e Argentina, 25 anos de cooperação nuclear
  55. "RENEWABLE CAPACITY STATISTICS 2021 page 41" (PDF). Retrieved 24 May 2021.
  56. Brazil - A Bio-Energy Superpower Archived 2014-06-03 at the Wayback Machine , by Mario Osava, Tierramérica

Further reading