Access to water supply and sanitation in Ethiopia is amongst the lowest in Sub-Saharan Africa and the entire world. While access has increased substantially with funding from foreign aid, much still remains to be done. Some factors inhibiting the achievement of these goals are the limited capacity of water bureaus in the country's 13 regions, two city administrations and water desks in the 770 districts of Ethiopia (woredas); insufficient cost recovery for proper operation and maintenance; and different policies and procedures used by various donors, notwithstanding the Paris Declaration on Aid Effectiveness.
In 2001 the government adopted a water and sanitation strategy that called for more decentralized decision-making; promoting the involvement of all stakeholders, including the private sector; increasing levels of cost recovery; as well as integrating water supply, sanitation and hygiene promotion activities. Implementation of the policy apparently is uneven.
In 2005 the government announced highly ambitious targets to increase coverage in its Plan for Accelerated Sustained Development and to End Poverty (PASDEP) for 2010. The investment needed to achieve the goal is about US$300 million per year, compared to actual investments of US$39 million in 2001–2002. In 2010 the government presented the equally ambitious Growth and Transformation Plan (GTP) 2011–2015, which aims at increasing drinking water coverage, based on the government's definition, from 68.5% to 98.5%.[2] While donors have committed substantial funds to the sector, effectively spending the money and to ensure the proper operation and maintenance of infrastructure built with these funds remain a challenge.
Water resources and use
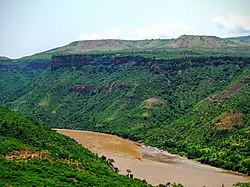
The major river in Ethiopia is the Blue Nile. However, most drinking water in Ethiopia comes from ground water, not rivers.
Ethiopia has 12 river basins with an annual runoff volume of 122 billion m3 of water and an estimated 2.6–6.5 billion m3 of ground water potential. This corresponds to an average of 1,575 m3 of physically available water per person per year, a relatively large volume. However, due to large spatial and temporal variations in rainfall and lack of storage, water is often not available where and when needed.[5] Only about 3% of water resources are used, of which only about 11% (0.3% of the total) is used for domestic water supply.[6]
The capital Addis Ababa's main source of drinking water is the Gafsara dam built during the Italian occupation and rehabilitated in 2009. Wells and another dam complement the supply.[7][8]
This diagram shows the variability of rainfall in Ethiopia, here in the case of the capital Addis Abeba.
The city of Dire Dawa is supplied exclusively from groundwater that is highly polluted.[9] The situation is most dramatic in Harar where "a steady decrease of the level of Lake Alemaya has resulted in the complete closure of the treatment plant". Due to supply shortfall, water vendors sell untreated water at extremely high prices.[10] The lake dries up because of local climate change, changes in land use in its basin and increased irrigation of khat, a mild drug that is being grown for local consumption and export.[11] A pipeline is expected to bring water over a distance of 75km from a well field near Dire Dawa to Harar.[12]
People who have no access to improved supply usually obtain water from rivers, unprotected springs and hand-dug wells. Well, rivers and springs can be contaminated and can cause waterborne diseases.[5]Rainwater harvesting is also common.
Groundwater
The great majority of the rural community water supply relies on groundwater through shallow wells, deep wells and springs.[5]:6 Data from 2012 estimated that 70% of domestic water use in rural Ethiopia is supplied by groundwater, and large cities like Addis Ababa get up to 40% of water supply and industrial water use from groundwater.[13]
Volcanic rocks are the most extensive and accessible aquifers in central Ethiopia. In terms of groundwater storage, loose sediments are the most important aquifers.[13]
Shallow groundwater sites are recharged by local sources, for example the Addis Ababa pocket wells, Akaki well fields, and Ada'a plain.[14] These well fields are in urban areas and are used as water sources of major settlements and industries. For this reason, these groundwater resources are at risk of groundwater contamination
In Central Ethiopia, many of the aquifers are volcanic which leads to a high degree of heterogeneity of the groundwater flow systems. A detailed analysis of the groundwater flow systems is needed for decision-making to achieve sustainable water resource management.[14]
Groundwater exploration is taking place in the upper Awash sub-basin: "More than 300 boreholes have been drilled in this area for the municipality, irrigation, industries, and different private owners under a government-promoted self-supply policy."[15] For example deep boreholes were drilled to supply water to Addis Ababa city. There are also well fields in Addis Ababa city, Akaki, South Ayat, Legedadi, and Sebeta Tefki. Deep boreholes are also supplying water to large-scale irrigation schemes in Becho plain and Alliadege plains. However, there is a rapid decline in groundwater level in the major well fields such as Akaki well field.[15]
There is usually an assumption that groundwater well are recharged from groundwater flows in the highlands which would make them quite resilient to climate variations. However, research has shown that recharge mechanisms are complex. There are "shallow groundwater systems fed by local recharge sources" as well as "deep systems connected to the regional flow from the plateau". Those groundwater system that are fed by local recharge sources need to be carefully monitored and protected from local contamination.[15]
Poor waste management practice in Addis Ababa city and Akaki areas has the potential to contaminate shallow groundwater systems. Similarly, new urban settlements and industrial zones in areas that were formerly farmland, such as Ada'a plain (Bishoftu and Mojo areas), can also be a threat to groundwater systems.[15]
Water allocation
Partnerships with the Awash Basin Development Office (AwBDO) and the Ministry of Water, Irrigation and Electricity (MoWIE) have led to the development of new models of water allocation in the Awash basin. This can improve water security for the 18.3 million residents in the basin. With this they will have enough water for their domestic, irrigation and industry needs.[16]
Access
Drinking water
Proportion of respondents by Kebele (sub-city) in Wukro indicating months in which water shortages restrict their activities (in 2019).
In 2017 only 11% of the population used a safely managed drinking water service on their premises. Another 30% used a "basic service" (less than 30 minutes round trip for water collection), with the remainder having to rely on "limited service" (more than 30 minutes), "unimproved sources" (such as unprotected dug wells or springs) or surface water.[18]
Ethiopia is lower than the global average for access to piped water but higher than the average for sub-Saharan Africa: at 41% of the population using piped water (88% urban and 22% rural).[17] Within these statistics, access to safely managed drinking water will vary within and between large cities, medium- and small-towns. Urban water insecurity in Ethiopia is driven by socio-political processes, climate change and urbanisation.[17]
In communities that lack access to water on or close to their premises, women bear the brunt of the burden of collecting water. For example, in the mountain-top village Foro in the Konso special woreda of southwestern Ethiopia women make three to five round trips per day to fetch dirty water from the Koiro river. Each roundtrip lasts two to three hours and water is carried in "50-pound jerrycans".[19]
Sanitation and hygiene
Only 7% of the population used a safely managed sanitation service, 7% only had "limited service" (latrines shared with other households), 63% had to rely on "unimproved service" (e.g. a simple pit or a bucket) and 22% defecate in the open.[18]
Service quality
Drinking water quality
Percentage of households in Wukro using a variety of drinking water sources reported used in the last two weeks.
Drinking water quality in Ethiopia varies. The most comprehensive picture of drinking water quality are the results of a national statistically representative survey of piped water supply, boreholes, protected dug wells and protected springs carried out by the WHO and UNICEF in 2004–2005. It shows that 72% of samples complied with the values for coliform bacteria in the Ethiopian drinking water standard ES 261:2001 and the WHO guidelines for drinking water. In the case of piped water supply by utilities compliance was highest at 88%. Open wells and unprotected springs were not included in the survey. Besides bacterial contamination, natural contamination with fluoride is an issue in the Rift Valley. The results of the survey confirm the results of routine monitoring undertaken in the laboratories of the Regional Water Bureaus and the Regional Health Bureaus. The latter results are archived at the Ethiopian Health and Nutrition Research Institute. Interaction and exchange of information between regional health bureaus and regional water bureaus is poor.[20]
In regions where drinking water is sourced from groundwater, attention needs to be paid to water chemistry quality parameters: Groundwater chemistry is an area of concern for water management in Ethiopia due to geogenic hazards, saline intrusion, and pressures from waste streams and other activities associated with agriculture, industry, and urbanization.[13] Health hazards from groundwater chemistry are wide-spread.
Chemical contaminants occur widely in groundwaters that are used for drinking but are not regularly monitored. Example priority parameters are fluoride, arsenic, nitrate, or salinity.[13] There is generally not enough data to fully understand distribution of risk.[13] The available data tends to have a bias because research tends to focus on areas of high-profile contamination only. Furthermore, there are only few laboratories available in Ethiopia that can carry out these chemical analyses.[13]
Intermittent supplies
Map of Wukro town showing spatial distribution of household water security in August 2019. Red areas have low household water security.
It was reported in 2023 that "most water supply systems are intermittent, providing water for only a few hours per week in some settings".[21] The reasons for this intermittency are that there is not enough water being produced or that water is lost though leakages in the water distribution system. There are also problems with power supply.[21]
For example in Wukro town (population of 50,000), people frequently had to use alternative sources (other than the piped water supply) as the piped water was often unsafe and insufficient.[21] Residents installed household water storage tanks with a volume of 28 to 150 litres to cope with the problems of unreliable supply.[21] Some have called for free or subsidised water storage containers to be supplied by the government to the poorest households so that these households are not disadvantaged compared to wealthier households during times of intermittent water availability.[21]
Despite the wide-reaching piped water network, households and small businesses in Wukro remain water insecure to different degrees, primarily due to the unreliable and intermittent flow of water through the pipes. In Wukro, residents experience water insecurity and vulnerability to endemic drought.[17]
Other aspects of service quality
In 2010, 20 percent of rural water systems were malfunctioning, down from 25% in 2007.[3] About 35 percent of the estimated 30,000 hand pumps in Ethiopia, serving an estimated 2 million people, were non-functioning in the mid-2000s.[22] In piped water systems rationing and service interruptions are frequent.[23]
In order to understand responsibilities in the sector it is necessary to provide a brief overview of local government in Ethiopia. Ethiopia is a federal state consisting of the following subdivisions:
10 ethnically based Regions (kililoch), with a population between 200,000 and 25 million each;
68 Zones, with a population between 100,000 and a few million each;
770 Districts, with a population between 10,000 and more than 300,000 each, the largest ones being found in urban areas;
Many thousand Kebeles, which constitute the smallest administrative units in Ethiopia with a population of a few thousand each.
In addition to the regions there are two "chartered cities", (Addis Ababa and Dire Dawa), where the lower-level administrative units mentioned above do not exist. There is wide disparity in development and institutional capacity between regions and also within regions. The Amhara, Oromia, Tigray regions as well as the small Harari region are relatively developed. About 70% of Ethiopians live in these four regions. The Southern Nations, Nationalities, and Peoples' Region, where about 20% of the population lives, is very heterogeneous. In the more pastoralist and remote "emerging" regions Somali, Afar, Gambela and Benishangul-Gumuz Regions, where about 10% of the population lives, capacity tends to be lowest.[23]
Policy and regulation
There are strong national water supply and sanitation policies and key agencies have clear roles and strategies.[24] National policies are set by the Ministry of Water, Irrigation and Energy (MWE), where a State Minister is responsible for water supply and sanitation. Previously, the Ministry of Health had been in charge of sanitation. As of 2009, what was then the Ministry of Water Resources had 737 employees in eight departments and 10 "services". One of the eight departments was the Water Supply and Sewerage Department.[25]
In 2006 the government adopted a Universal Access Plan (UAP) to achieve 98% access for rural water supply and 100% access for urban water supply and sanitation by 2012. Its cost was estimated at US$2.5bn. During the first phase until 2012 the focus is on affordable and appropriate technologies, with the following service standards:[26]
Setting
Per capita consumption
Service radius
Rural
15 litre/capita/day
1.5km
Urban
20 litre/capita/day
0.5km
In 2001 the government adopted a National Water Strategy prepared. The overall strategy included a water resources strategy, a hydropower development strategy, a water supply and sanitation strategy, and an irrigation strategy.[27]
The water supply and sanitation aimed at:
More decentralized decision-making
Promoting the involvement of all stakeholders, including the private sector
Increasing levels of cost recovery
Integrating water supply, sanitation and hygiene promotion activities.
The strategy document does not include a diagnostic of the current situation. The water and sanitation part of the strategy alone includes 44 recommendations concerning technical, institutional, capacity building, social, economic and environmental issues. There is no prioritization between the recommendations and the strategy does not establish mechanisms to monitor the implementation of the strategy.
Regional Water Bureaus and Woreda Water Desks are in charge of investment planning, monitoring and technical assistance to water service providers. Their capacity to fulfill these tasks is sometimes limited. According to a research report funded by DFID, the community management service delivery approach that dominates in rural areas in Ethiopia "has bypassed local government authorities and reduced their ownership; however these actors are still needed if rural services are to be sustainable and scalable."[28]
A public toilet at the Adama University (Nazret). This toilet uses the urine diversion technology that allows urine and feces to be collected separately as fertilizer.
When it used to be in charge of on-site sanitation, the Ministry of Health adopted a Sanitation and Hygiene Promotion Strategy.[29] The Sanitation and Hygiene Promotion Strategy has re-focused government resources on the promotion of pro-poor, low-cost practices.[24]
Service provision
In the capital, the Addis Ababa Water and Sewer Authority provides water and sewer services. In other cities and towns, Town Water Boards are responsible for service provision. They are expected to contract out service provision to private operators.
In rural areas community water and sanitation committees operate water systems and promote sanitation. Not all the local committees are registered, which is a prerequisite to open a bank account to hold funds collected from users.
Other
The Ethiopian Social Rehabilitation and Development Fund (ERSDF)– a Social Fund established in 1996 and dissolved in 2007 – was an important actor, especially in rural areas. It has financed almost 2,000 rural water projects serving about 2.5 million people. Its staff has been re-deployed to other institutions.[29]
History and recent developments
Until 1995 the national government had been responsible for centrally planning and implementing water and sanitation projects. Under the 1995 constitution Ethiopia became a federal state, which implied the decentralization of many functions to lower levels of government. This process has now been under way for more than a decade, but decentralization has been hampered by the limited capacity of local government to carry out its new responsibilities.
Also in 1995, a Ministry of Water Resources was created, taking over many of the responsibilities of the water resources department of the former Ministry of Public Works.[29]
In 1999 the government adopted a National Water Resources Management Policy, which was followed by the establishment of a Water Resources Development Fund (2002) and a Water Sector Development Program. The latter includes a water supply and sewerage development program (nota bene the focus on sewerage and thus the absence of on-site sanitation from the program).
The government's Plan for Accelerated Sustained Development and to End Poverty (PADEP), covering the period 2005–2010, aimed at increasing access to an improved water source to 84% and access to improved sanitation to 80% by 2010. These ambitious targets go well beyond the water and sanitation targets of the Millennium Development Goals, which aim at halving the share of people without access by 2015. According to one set of government figures, which is used by the Ministry of Finance and Economic Development for planning purposes, access to drinking water reached 68.5% in 2010. According to another set of government figures, based on national survey data and used by the WHO and UNICEF to monitor the Millennium Development Goals, in 2008 access to an improved water source was only 38% and to improved sanitation 12%.
In 2010 the government presented the equally ambitious Growth and Transformation Plan (GTP) 2011-2015 that aims at increasing drinking water coverage, based on the government's definition, from 68.5% to 98.5%.[2]
In Ethiopia, access to a piped water supply on private premises is the administrative responsibility of the town water utility and requires a one-time connection fee payment by the household and monthly service charge.[17] In 2014 water tariffs in Addis Abeba were of an increasing-block type, with the first 15m3 per month costing the equivalent of 0,14 USD per m3, rising to 0,21 USD per m3 until 50 m3 and 0,24 USD per m3 above.[30]
In the small town of Wukro (50,000 residents), the water utility uses an increasing block tariff with a fixed charge to calculate customers' water bills. The mean average price households pay for water from the utility was 6.5 Ethiopian birr per m3 in 2022 (or 0.12 USD with October 2023 exchange rate). Because the utility does not provide 24 × 7 water service, households report using multiple sources to meet their water needs. Households reported paying 120 birr per m3 (2.2 USD) for water from alternative sources, which is two orders of magnitude higher than the price paid for water from the utility.[17]
On average, according to the World Bank cost recovery is too low to recover operating costs, not to speak of providing adequate maintenance of facilities.[31] Recurrent expenditures – estimated at US$29 million in 2001–02 – were financed primarily through user charges (64%), as well as by subsidies from the regional governments (31%) and the federal government (5%).[32] Nevertheless, a few service providers recover all operating costs and generate a modest cash surplus.[33]
As of 2022, utilities are usually not financially self-sustaining because the water tariff is not sufficient to cover the full cost of supply. This has a critical effect on the provision of equitable urban water supply services.[17]
The National Water Resources Management Policy aims at full cost recovery for urban systems and recovery of operation and maintenance costs for rural systems.[citation needed] It is not clear if progress has been made to achieve this ambitious objective since the policy was adopted.
Investment and financing
Investment
Actual investment. There are no recent reliable estimates of actual investment levels in the sector, and available estimates vary greatly. A detailed estimate of investment and financial flows in the Ethiopian water sector was carried out by the World Bank's Water and Sanitation Program (WSP) for the financial year 2001–02. It estimated total sector investments at US$39 million or less than half a dollar per capita, being one of the lowest recorded sector investment levels in the world.[32] Water and sanitation have declined as a share of total poor-focused expenditure from 7.4% in 2005/06 to 3.4% in 2009/10. In addition, according to research funded by DFID, "actual expenditure may fall well short of these levels. It seems that a very significant proportion of resources are not utilised and are subject to bottlenecks."[28]
Projected investment. The government estimates that annual investments in the 2006-2015 period will reach about US$100 million per year, or about two and a half times their level in 2001–2002. This projection is based on funding commitments made by donors and the government.[34] It thus does not take into account bottlenecks in implementation due to limited capacities or other potential pitfalls. The government estimates that the actual investment needs are about three times as much or US$297 million per year for the period 2006–2015.[34]
Financing
Sources. According to the WSP estimate quoted, in 2001-2002 only 9% of sector investments were funded by the federal budget, 55% through the regional budget, 33% off-budget by NGOs, 2% by the ERSDF and 1% by other sources.[32] This estimate does not include community in-kind contributions, which are high for rural water supply and sanitation. A high but unknown share of the federal budget and probably also of the Woreda budget devoted to the sector is funded by donors. Concerning projected investments for 2006–2015, it is estimated that 12% (US$12 million) will be funded by the government with its own resources, 15% (US$16 million) by communities and 73% (US$75 million) by donors. It is not clear if this estimate includes off-budget support by NGOs. Because of the different categories used, a comparison between the historical and projected sources of financing is not possible.[34]
Processes. According to a research report funded by DFID, the levels of funding to services delivered by regional and local government are difficult to predict. A large share of donor funding is channeled outside the government budget, although as of 2009 there was a trend for donors and government to "ensure the alignment of financing mechanisms". Where financing is provided through the budget, conditions and reporting procedures are "excessively onerous". Budget transparency and accountability are limited, although efforts are being made to create an open budget system at all levels of government. According to the report the government, particularly at lower tiers, "does not recognise citizens' rights to information about budget allocations". The Universal Access Plan uses national-level unit costs to allocated government funds to local governments. The unit cost approach fails to take regional differences into account. There is no funding for operation and maintenance or the costs of local governments to support communities in operation and maintenance. This increases the risk that newly built systems will be failing.[28] For the country's 550 Woredas an important source of financing are block grants from the central government which they can use autonomously within broad criteria set by the Water Resources Development Fund (WRDF).[23] The WRDF itself provides loans and is administered by a Board that is responsible to the MWE and is funded through budgetary allocations and donor funds.
External cooperation
Children play by a newly installed hand pump in the village of Jedane.
Donors finance numerous projects in water supply and sanitation in Ethiopia – some through the Federal Government and some directly to regions, towns and communities. The donors have established a technical working group (TWG) on water as part of a core donor group called the Development Assistance Group.[35] A Multi-Stakeholder Forum is also supported through the European Union Water Initiative.[24] Despite improved coordination, donors still use different implementation arrangements. As a result, according to the World Bank, transaction cost are high.[23]
Important donors in the sector are the African Development Bank, CIDA, China, the British DFID, the EU, FINIDA, AFD from France, Germany (through GTZ and KfW), JICA, the Netherlands, UNDP, UNICEF and the World Bank. There are also about 500 local and foreign NGOs, many of which are active in water supply and sanitation.[29]
The African Development Bank provided a US$64 million grant for rural water supply and sanitation approved in 2005.[29] In November 2011 it was announced that China would provide a US$100 million loan for water supply in Addis Ababa.[36]
WaterAid
The British NGO WaterAid has been engaged in Ethiopia since 1983. It works closely with established local NGOs. In Oromia Region, water projects tend to be spring-fed gravity schemes, some of which are very large, providing water for tens of thousands of people. In Southern Nations, Nationalities, and People's Region schemes have included deep boreholes as water is sometimes only found below 200 metres.[37] For example, in the village of Orbesho residents - mainly women - built themselves an access road to allow drilling equipment to be brought in, dug trenches for pipes and collected stones for structures.[19] In Amhara and Tigray the main technologies have been hand-dug wells and spring development. In Benishangul-Gumuzrope pumps are also used. Since 1998 WaterAid has also been engaged in the slum areas of Addis Ababa. Projects include establishing communal water points linked to the city's piped systems, as well as shower and latrine blocks.[37]
World Bank
Street in Addis Abeba, the Ethiopian capital, where the World Bank, China and other external donors assist in financing water supply and sanitation
In May 2012 the World Bank provided approved a US$150 million soft loan for an urban water and sanitation project as additional financing to a US$100 million soft loan approved in 2007.[38] The project covers Addis Ababa, Gondar, Hawassa, Jimma, Mekelle and Diredawa. On the sanitation side, it will promote household latrines, hygiene and sanitation practices and constructing communal sanitation facilities. Water production is expected to increase from 50 to 75 liter per capita per day in Addis Ababa and from 30 to 50 liter in the five secondary cities. The water distribution network will be extended to serve 400,000 more people (40,000 connections) in Addis Ababa and 500,000 more people (50,000 connections) in the five secondary cities. The project will also promote awareness of water conservation among customers. The project will also reduce water losses: In Addis Ababa out of the 50 liters per capita per day produced, only 35 reached consumers due to water losses. In the remaining cities only 20 of the 30 liters produced reached consumers.[39]
In March 2010, the World Bank approved additional financing of US$80 million for a US$100 million rural water supply and sanitation project approved in 2004. According to the World Bank, until 2010 the original project had financed the construction of 1288 hand dug wells, 835 protected springs, 576 shallow wells, 99 deep wells, 75 rural piped systems and 35 rainwater harvesting, as well as conducting hygiene and sanitation promotion. In rural areas alone, according to the World Bank the project facilitated access to clean water and improved sanitation facilities to about 1.4 million people. In urban areas, the project provided "immediate service improvement" in 87 towns which benefited about 143,000 people.[40][41]
Example towns
Wukro
Aerial photograph of Wukro, facing south, late afternoon, January 2020, taken above Wukro Lodge
Water in Wukro has been a scarce resource due to urban population growth, construction, and the seasonality of water availability.[42]Climate variability is a driver of water access in Wukro, with greater access to water during the wet season, particularly July to September. In the dry season, around 43%–45% of households rely solely on piped water to meet domestic water needs, which is mostly supplemented with buying water. In the wet season, just over half of households rely on piped water only for drinking and cooking, while rainwater is used widely for washing clothes, cleaning and bathing; a smaller proportion of households still rely on bought water for drinking and cooking.[17]
To improve urban water access in the town of Wukro, its water utility expanded and renovated the existing piped water system. The project had financial support from the National ONEWASH programme, UNICEF and UK Foreign, Commonwealth & Development Office, as well as the Tigray regional and national governments, Inaugurated in 2018, this included the development of more productive and reliable boreholes with a planning period from 2015 to 2035, designed to provide water equally over all water demand nodes of the distribution network.[17] As part of this project, three new boreholes were constructed in an artesian aquifer in the Abreha-we-Athsbeha village near Wukro.[42] According to the municipal water utility in 2019, the boreholes were only producing 1900 m3 (with 19 per cent wastage) per day, below the minimum demand of 3141 m3.[42]
Despite this expanded piped water system, there is still (as of 2022) a high degree of spatial heterogeneity in the reliability of piped water supply. Some households in Wukro have supply of tap water six days a week, some only 1–3 days per week, some do not have piped water for weeks or even months; others do not even have piped water on their premises at all.[42] In this situation of water precarity, lack of clarity, consistency and geographical fairness, people resort to using different water sources. People buy water from water tankers or supplement their water needs by borrowing or purchasing from neighbours, or informal water vendors, at costs ranging from 2 to 10 birr [0.07–0.34 EUR] per 20-litre jerrycan. This is much higher than the 5 birr [0.17 EUR] per 1000-litres through the piped network.[42]
↑The International Benchmarking Network for Water and Sanitation Utilities (IBNET):Utility SearchArchived 2010-03-01 at the Wayback Machine The range is for the five utilities serving Addis Abeba, Dire Dawa, Harar, Mekelle and Adama; accessed on September 19, 2010
123International Water Management Institute:Water Resources and Irrigation Development in Ethiopia, Working Paper 123, by Seleshi Bekele Awulachew, Aster Denekew Yilma, Makonnen Loulseged, Willibald Loiskandl, Mekonnen Ayana and Tena Alamirew, 2007
↑Rural Water Supply Network (April 21, 2009). "Handpump Data, Selected Countries in Sub-Saharan Africa". Archived from the original on 2012-11-18. Retrieved 19 July 2012.. Data are from the Demographic and Health Survey 2000 and the number of handpumps has been estimated by B.Muluneh.
This page is based on this Wikipedia article Text is available under the CC BY-SA 4.0 license; additional terms may apply. Images, videos and audio are available under their respective licenses.