Demographics of Ethiopia

Last updated

Demographics of Ethiopia
Ethiopia single age population pyramid 2020.png
Ethiopia population pyramid in 2020
Population120,283,026 [1] [2]
Density109.3 people per.sq.km
Growth rate2.5% (2021) (22nd)
Birth rate32.4 births/1,000 population (2021)
Death rate6.8 deaths/1,000 population (2021)
Life expectancy68.25 years (2022 est.)
  male66.12 years (2022 est.)
  female70.44 years (2022 est.)
Fertility rate4.16 children born/woman (2021)
Infant mortality rate34.4 deaths/1,000 live births (2021)
Sex ratio
At birth1.03 male(s)/female (2013 est.)
Under 151.00 male(s)/female (2009 est.)
15–64 years0.99 male(s)/female (2009 est.)
65 and over0.95 male(s)/female (2009 est.)
Nationality
Major ethnicSee Ethnic Groups of Ethiopia
Language
OfficialSee Languages of Ethiopia

The demographics of Ethiopia encompass the demographic features of inhabitants in Ethiopia, including ethnicity, languages, population density, education level, health, economic status, religious affiliations and other aspects of the population.

Contents

Ethnic groups

Ethnic groups in Ethiopia (2007 census) [3]
Ethnic grouppercent
Oromo
34.5%
Amhara
26.9%
Somali
6.2%
Tigray
6.1%
Sidama
4.0%
Gurage
2.5%
Welayta
2.3%
Hadiya
1.7%
Afar
1.7%
Gamo
1.5%
others
12.6%

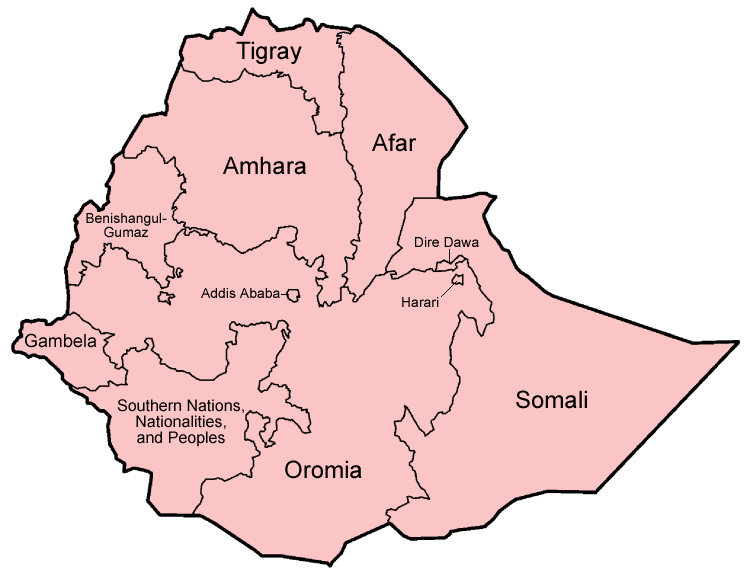
Ethiopia's population is highly diverse, containing over 80 different ethnic groups, the four largest of which are the Oromo, Amhara, Somali and Tigrayans. According to the Ethiopian national census of 2007, the Oromo are the largest ethnic group in Ethiopia, at 34.4% of the nation's population. The Amhara represent 27.0% of the country's inhabitants, while Somalis and Tigrayans represent 6.2% and 6.1% of the population respectively. Other prominent ethnic groups are as follows: Sidama 4.0%, Gurage 2.5%, Welayta 2.3%, Afar 1.7%, Hadiya 1.7%, Gamo 1.5% and Others 12.6%. [3]

Afroasiatic-speaking communities make up the majority of the population. Among these, Semitic speakers often collectively refer to themselves as the Habesha people. The Arabic form of this term (al-Ḥabasha) is the etymological basis of "Abyssinia", the former name of Ethiopia in English and other European languages. [4] Additionally, Nilo-Saharan-speaking ethnic minorities inhabit the southern regions of the country, particularly in areas of the Gambela Region which borders South Sudan. The largest ethnic groups among these include the Nuer and Anuak. [5] The Southern Nations, Nationalities, and Peoples' Region, being an amalgam of the main homelands of numerous ethnicities, contains over 56 indigenous ethnic groups. [6]

Languages

According to the bibliographic database Glottolog, there are 109 languages spoken in Ethiopia; meanwhile, Ethnologue lists 90 individual languages spoken in the country. [7] [8] Most people in the country speak Afroasiatic languages of the Cushitic or Semitic branches, including the Oromo language, Somali, Amharic, and Tigrinya. Together, these four groups make up about three-quarters of Ethiopia's population. Other Afroasiatic languages with a significant number of speakers include the Cushitic Sidamo, Afar, Hadiyya and Agaw languages, as well as the Semitic Gurage languages, Harari, Silt'e, and Argobba languages. Arabic, which also belongs to the Afroasiatic family, is likewise spoken in some areas. [9]

The principal Semitic language of the north-west and centre of the country is Amharic, which is the language of the Amhara Region. Moreover, Amharic is also one of the official working languages of Ethiopia. [10] [11] [12]

Oromo serves as one of the official working languages of Ethiopia [10] [11] [12] and is also the working language of several of the states within the Ethiopian federal system including Oromia, [13] Harar and Dire Dawa regional states and of the Oromia Zone in the Amhara Region.

Religion

Religion in Ethiopia in 2015 by ARDA [14]
Ethiopian Orthodox
42.1%
Islam
34.6%
Protestant
20.8%
Traditional faiths
1.4%
Roman Catholic
0.6%
Other and No religion
0.1%

Various religions are adhered to in Ethiopia. Most Christians live in the highlands, whereas Muslims mainly inhabit the lowlands. Adherents of traditional faiths are primarily concentrated in the southern regions.

According to the Ethiopian Central Statistical Agency (2007 census), the national religious composition is Ethiopian Orthodox 43.5%, Protestantism 18.6%, Roman Catholicism 0.7%, Islam 33.9%, traditional 2.6%, and others 0.6%. [15]

Population

Historical population
YearPop.±% p.a.
1 1,000,000    
1500 6,000,000+0.12%
1900 10,742,000+0.15%
2000 63,000,000+1.78%
2011 85,555,555+2.82%
2012 84,320,987−1.44%
2013 86,613,986+2.72%

Source: Central Statistical Agency (CSA) [16]

Ethiopia is the most populous landlocked country in the world. [17] Its total population has grown from 38.1 million in 1983 to 109.5 million in 2018. [18] The population was only about nine million in the 19th century. [19] The 2007 Population and Housing Census results show that the population of Ethiopia grew at an average annual rate of 2.6% between 1994 and 2007, down from 2.8% during the period 1983–1994. As of 2015, the population growth rate is among the top ten countries in the world. [20] According to UN estimations, life expectancy in Ethiopia had improved over time, with male life expectancy reported to be 56 years and for women 60 years. [21]

UN estimates

Population, fertility rate and net reproduction rate, United Nations estimates Ethiopia Population 1950-2021 Forecast 2022-2032 UN World Population Prospects 2022.svg
Population, fertility rate and net reproduction rate, United Nations estimates

According to the 2022 revision of the World Population Prospects [1] [2] , the total population was 120,283,026 in 2021, compared to 18,434,000 in 1950. The proportion of children below the age of 15 in 2010 was 41.5%, 55.8% was between 15 and 65 years of age, while 3.3% was 65 years or older. The average age was 25.1. [22]

Total populationPopulation aged 0–14 (%)Population aged 15–64 (%)Population aged 65+ (%)
195018 434 00044.152.93
195520 298 00043.953.32.8
196022 553 00043.553.82.6
196525 480 00043.553.92.6
197028 959 00044.153.32.7
197532 959 00044.552.72.8
198035 426 00044.552.62.9
198541 078 00044.652.62.9
199048 333 00045.452.12.9
199557 042 00045.951.22.9
200065 578 00045.951.13.0
200574 264 00044.552.43.1
201082 950 00041.555.23.3
Population by Sex and Age Group (Census 29.V.2007): [23]
Age GroupMaleFemaleTotal%
Total37 217 13036 533 80273 750 932100
0–45 482 7925 314 23010 797 02214.64
5–96 106 7885 874 97611 981 76416.25
10–145 412 3244 999 91310 412 23714.12
15–194 454 7104 293 3388 748 04811.86
20–243 098 3383 303 7476 402 0858.68
25–292 622 7593 039 4295 662 1887.68
30–342 088 2082 131 8584 220 0665.72
35–391 827 2961 949 3463 776 6425.12
40–441 464 5291 408 4512 872 9803.90
45–491 150 0171 097 2872 247 3043.05
50–54928 294962 4721 890 7662.56
55–59634 053536 9671 171 0201.59
60–64646 359588 6411 235 0001.67
65-69446 242359 019805 2611.09
70-74359 897316 663676 5600.92
75-79203 843146 333350 1760.47
80-84159 786127 691287 4770.39
85-8962 00138 195100 1960.14
90-9438 18526 35764 5420.09
95+30 70918 88949 5980.07
Age groupMaleFemaleTotalPercent
0–1417 001 90416 189 11933 191 02345.00
15–6418 914 56319 311 53638 226 09951.83
65+1 300 6631 033 1472 333 8103.16
Population Estimates by Sex and Age Group (01.VII.2020) (Estimates considering also the results of the 2007 Population Census.): [24]
Age GroupMaleFemaleTotal%
Total50 501 05450 195 689100 696 744100
0–46 928 6576 696 03613 624 69313.53
5–96 556 4626 386 58512 943 04512.85
10–145 953 6395 819 25011 772 88911.69
15–195 590 6675 450 66011 041 32410.96
20–245 047 2534 902 3299 949 5829.88
25–294 406 7984 348 5828 755 3798.69
30–343 687 2683 768 2467 455 5127.40
35–392 990 4053 135 3476 125 7546.08
40–442 394 3202 528 7494 923 0714.89
45–491 843 8221 962 6673 806 4893.78
50–541 472 2631 548 2923 020 5533.00
55–591 156 7651 177 7782 334 5412.32
60–64883 392899 3031 782 6941.77
65–69639 745643 7761 283 5231.27
70–74444 339441 554885 8940.88
75–79276 955273 976550 9280.55
80+228 308212 565440 8710.44
Age groupMaleFemaleTotalPercent
0–1419 438 75818 901 87138 340 62938.08
15–6429 472 94929 721 94759 194 89658.79
65+1 589 3471 571 8713 161 2183.14

UN projections

Below are the UN's medium variant projections: [25] [22]

UN population projections for Ethiopia (medium variant)
YearPop.±% p.a.
2022121,822,590    
2025 131,322,576+2.53%
2030 147,649,901+2.37%
2035 164,079,192+2.13%
2040 180,415,091+1.92%
2045 196,839,709+1.76%
2050 213,190,071+1.61%

Vital statistics

Registration of vital events in Ethiopia is incomplete. The Population Department of the United Nations prepared the following estimates: [25]

YearPopulation (thousands)Live births (thousands)Deaths (thousands)Natural change (thousands)CBRCDRNCTFRIMRLife expectancy (years)
195017 710  875  494  38149.427.921.57.35199.436.35
1951  18 101  890  498  39249.127.521.67.30198.136.60
1952  18 497  899  502  39748.627.121.57.20195.436.82
1953  18 892  910  503  40748.126.621.57.12192.337.23
1954  19 292  921  505  41647.726.221.57.05189.137.54
1955  19 704  934  507  42847.425.721.76.99185.637.96
1956  20 128  951  509  44247.225.321.96.95181.938.34
1957  20 499  967  643  32447.231.415.86.92216.332.39
1958  20 817  985  636  34947.330.516.86.90211.832.94
1959  21 227  1 007  502  50547.423.623.86.89169.939.86
1960  21 740  1 032  508  52447.523.324.16.88165.840.33
1961  22 282  1 060  509  55147.622.924.76.88161.841.00
1962  22 852  1 090  516  57447.722.625.16.88158.041.40
1963  23 449  1 121  520  60147.822.225.66.87154.641.96
1964  24 074  1 157  529  62848.022.026.16.87151.642.28
1965  24 728  1 193  541  65248.321.926.46.86149.642.44
1966  25 378  1 230  607  62248.523.924.56.87160.640.15
1967  26 052  1 268  566  70248.721.726.96.88146.542.69
1968  26 779  1 308  580  72848.821.727.26.90146.242.84
1969  27 530  1 358  599  75949.321.827.56.94146.042.83
1970  28 308  1 399  618  78149.421.827.66.98145.742.82
1971  29 100  1 442  634  80749.521.827.77.02145.442.89
1972  29 891  1 481  687  79449.523.026.67.06152.041.55
1973  30 694  1 517  702  81549.422.926.57.09151.641.64
1974  31 489  1 561  783  77849.624.924.77.12163.239.45
1975  32 253  1 601  803  79849.624.924.77.14163.039.36
1976  33 062  1 644  744  90049.722.527.27.19147.941.90
1977  33 695  1 694  766  92949.922.527.37.26147.641.89
1978  34 259  1 712  774  93749.822.527.37.30147.141.90
1979  34 759  1 750  766  98549.821.828.07.31143.442.81
1980  34 945  1 764  761  1 00449.821.528.37.33141.943.22
1981  35 819  1 771  752  1 01849.921.228.77.36140.443.61
1982  37 213  1 858  782  1 07650.021.028.97.37138.643.77
1983  38 235  1 917  1 084  83350.228.421.87.38180.936.04
1984  39 203  1 985  1 088  89750.727.822.97.40177.536.43
1985  40 286  2 052  1 077  97451.026.824.27.38171.437.36
1986  41 455  2 111  1 090  1 02151.026.424.77.36167.937.81
1987  42 852  2 168  833  1 33550.719.531.27.34126.645.44
1988  44 512  2 230  877  1 35350.319.830.57.30125.145.06
1989  46 196  2 304  911  1 39450.019.830.27.27123.145.04
1990  47 878  2 389  957  1 43250.120.130.07.24122.044.56
1991  49 937  2 466  935  1 53149.818.930.97.21117.646.13
1992  52 012  2 548  950  1 59849.118.330.87.16114.346.90
1993  53 792  2 618  957  1 66148.717.830.97.13111.147.39
1994  55 620  2 677  964  1 71448.217.330.87.08107.747.86
1995  57 477  2 737  970  1 76747.616.930.87.01104.148.30
1996  59 348  2 811  968  1 84347.416.331.16.92100.548.92
1997  61 233  2 865  968  1 89746.815.831.06.8597.149.51
1998  63 136  2 895  973  1 92145.815.430.46.7593.749.93
1999  65 078  2 946  1 011  1 93545.315.529.76.6590.949.43
2000  67 032  2 984  990  1 99544.514.829.76.5687.250.54
2001  69 019  3 040  991  2 04844.014.429.76.4683.951.04
2002  71 073  3 085  992  2 09243.414.029.46.3780.351.52
2003  73 169  3 096  970  2 12642.313.329.06.2476.852.53
2004  75 301  3 138  960  2 17841.712.728.96.1173.153.24
2005  77 470  3 177  948  2 23041.012.228.85.9769.654.01
2006  79 691  3 207  920  2 28740.211.528.75.8566.355.15
2007  81 996  3 240  886  2 35439.510.828.75.7462.856.43
2008  84 357  3 245  856  2 38938.510.128.35.5759.857.59
2009  86 756  3 235  823  2 41237.39.527.85.3957.158.80
2010  89 238  3 259  803  2 45636.59.027.55.2254.459.73
2011  91 818  3 290  782  2 50835.88.527.35.0551.960.72
2012  94 451  3 289  766  2 52334.88.126.74.8849.661.54
2013  97 084  3 294  751  2 54333.97.726.24.7247.462.37
2014  99 747  3 346  748  2 59833.67.526.14.6145.262.91
2015  102 472  3 425  739  2 68733.47.226.24.5343.263.65
2016  105 293  3 507  729  2 77733.36.926.44.4741.464.39
2017  108 198  3 577  732  2 84433.16.826.34.3939.664.84
2018  111 129  3 668  730  2 93733.06.626.44.3438.065.41
2019  114 121  3 781  735  3 04633.16.426.74.3236.665.84
2020  117 191  3 842  775  3 06632.86.626.24.2435.465.37
2021  120 283  3 896  815  3 08132.46.825.64.1634.464.98

CBR = crude birth rate (per 1,000); CDR = crude death rate (per 1,000); NC = natural change (per 1,000); IMR = infant mortality rate per 1,000 births; TFR = total fertility rate (number of children per woman); IMR = infant mortality rate per 1,000 births

Source: UN World Population Prospects

Total fertility rate in Ethiopia (census 2007)

As per 2007 Population and Housing Census of Ethiopia [26]

RegionUrban TFRRural TFRTotal TFR (U+R)
Ethiopia (Country Total)2,2204,6504,160
Tigray Region2,9154,9054,440
Affar Region2,4402,0002,075
Amhara Region2,1354,5404,175
Oromia Region2,6355,2354,845
Somali Region2,1751,9852,010
Benishangul – Gumuz Region3,0054,8004,520
S.N.N.P Region2,7504,7154,495
Gambella Region2,7252,9302,885
Harari Region1,7254,7252,885
Addis Ababa City Administration1,485-1,485
Dira Dawa City Administration2,1555,4552,985
Region 173,2102,5852,845

Ethiopia regions english.png

Fertility and Births (Demographic and Health Surveys)

Total Fertility Rate (TFR) (Wanted Fertility Rate) and Crude Birth Rate (CBR): [27]

YearCBR (Total)TFR (Total)CBR (Urban)TFR (Urban)CBR (Rural)TFR (Rural)
200041.35.9 (4.9)30.73.3 (2.7)42.96.4 (5.4)
200535.75.4 (4.0)23.42.4 (1.8)37.36.0 (4.5)
201134.54.8 (3.8)26.42.636.25.5
201631.84.6 (3.6)23.92.3 (2.1)33.25.2 (4.0)
201926.54.124.63.227.24.5

Fertility data as of 2011 (DHS Program): [28]

RegionTotal fertility ratePercentage of women age 15–49 currently pregnantMean number of children ever born to women age 40–49
Tigray4.67.26.4
Afar5.09.97.3
Amhara4.24.76.9
Oromiya5.68.37.1
Somali7.112.47.9
Benishangul-Gumuz5.210.26.6
SNNP4.99.37.3
Gambela4.05.75.6
Harari3.86.75.5
Addis Ababa1.53.63.3
Dire Dawa3.47.24.8

Other demographic statistics

Demographic statistics according to the World Population Review in 2019. [29]

The following demographic statistics are from the CIA World Factbook. [30]

Population

116,462,712 (2023 est.) Country comparison to the world: 12th
120,283,026 (estimate for 2021) [1] [2]

Ethnic groups

Oromo 35.8%, Amhara 24.1%, Somali 7.2%, Tigray 5.7%, Sidama 4.1%, Guragie 2.6%, Welaita 2.3%, Afar 2.2%, Silte 1.3%, Kefficho 1.2%, other 13.5% (2022 est.)

Religions

Ethiopian Orthodox 43.8%, Muslim 31.3%, Protestant 22.8%, Catholic 0.7%, traditional 0.6%, other 0.8% (2016 est.)

Age structure

Population pyramid of Ethiopia in 2020 Ethiopia single age population pyramid 2020.png
Population pyramid of Ethiopia in 2020
0-14 years: 38.91% (male 22,821,026/female 22,498,331)
15-64 years: 57.55% (male 33,345,764/female 33,672,933)
65 years and over: 3.54% (male 1,887,831/female 2,236,827) (2023 est.)
0–14 years: 39.81% (male 21,657,152/female 21,381,628)
15–24 years: 19.47% (male 10,506,144/female 10,542,128)
25–54 years: 32.92% (male 17,720,540/female 17,867,298)
55–64 years: 4.42% (male 2,350,606/female 2,433,319)
65 years and over: 3.38% (male 1,676,478/female 1,977,857) (2020 est.)
0–14 years: 43.21% (male 23,494,593 /female 23,336,508)
15–24 years: 20.18% (male 10,857,968 /female 11,011,100)
25–54 years: 29.73% (male 15,978,384 /female 16,247,086)
55–64 years: 3.92% (male 2,059,129 /female 2,185,814)
65 years and over: 2.97% (male 1,445,547 /female 1,770,262) (2018 est.)
0–14 years: 43.94% (male 21,900,571/female 21,809,643)
15–24 years: 19.98% (male 9,865,976/female 10,009,596)
25–54 years: 29.31% (male 14,487,280/female 14,667,179)
55–64 years: 3.88% (male 1,882,315/female 1,981,762)
65 years and over: 2.88% (male 1,289,336/female 1,572,161) (2015 est.)

Population growth rate

2.42% (2023 est.) Country comparison to the world: 25th
2.46% (2022 est.) Country comparison to the world: 25th
2.83% (2018 est.) Country comparison to the world: 11th
2.89% (2015 est.)

Birth rate

29.97 births/1,000 population (2023 est.) Country comparison to the world: 29th
30.49 births/1,000 population (2022 est.) Country comparison to the world: 29th
36 births/1,000 population (2018 est.) Country comparison to the world: 17th
37.27 births/1,000 population (2015 est.)

Death rate

5.6 deaths/1,000 population (2022 est.) Country comparison to the world: 176rd
5.7 deaths/1,000 population (2022 est.) Country comparison to the world: 173rd
7.5 deaths/1,000 population (2018 est.) Country comparison to the world: 110th
8.19 deaths/1,000 population (2015 est.)

Total fertility rate

3.92 children born/woman (2023 est.) Country comparison to the world: 27th
3.99 children born/woman (2022 est.) Country comparison to the world: 28th
4.91 children born/woman (2018 est.) Country comparison to the world: 15th
5.15 children born/woman (2015 est.)

Median age

total: 19.8 years. Country comparison to the world: 197th
male: 19.6 years
female: 20.1 years (2020 est.)
total: 18 years. Country comparison to the world: 213rd
male: 17.8 years
female: 18.2 years (2018 est.)
total: 17.7 years
male: 17.5 years
female: 17.8 years (2015 est.)

Net migration rate

-0.19 migrant(s)/1,000 population (2023 est.) Country comparison to the world: 109th
-0.2 migrant(s)/1,000 population (2017 est.) Country comparison to the world: 107th

Mother's mean age at first birth

19.3 years (2019 est.)
note: median age at first birth among women 20–49
20 years (2016 est.)
note: median age at first birth among women 25–29

Contraceptive prevalence rate

37.7% (2020)
36.5% (2017)

Urbanization

urban population: 23.2% of total population (2023)
rate of urbanization: 4.4% annual rate of change (2020–25 est.)
urban population: 20.8% of total population (2018)
rate of urbanization: 4.63% annual rate of change (2015–20 est.)
urban population: 19.5% of total population (2015)
rate of urbanization: 4.89% annual rate of change (2010–15 est.)

Dependency ratios

total dependency ratio: 75.7 (2021 est.)
youth dependency ratio: 70.2 (2021 est.)
elderly dependency ratio: 5.5 (2021 est.)
potential support ratio: 18.1 (2021 est.)

Sex ratio

at birth: 1.03 male(s)/female
0-14 years: 1.01 male(s)/female
15-64 years: 0.99 male(s)/female
65 years and over: 0.84 male(s)/female
total population: 0.99 male(s)/female (2023 est.)

Life expectancy at birth

Life expectancy in Ethiopia since 1950 Life expectancy in Ethiopia.svg
Life expectancy in Ethiopia since 1950
Life expectancy in Ethiopia since 1960 by gender Life expectancy by WBG -Ethiopia -diff.png
Life expectancy in Ethiopia since 1960 by gender
total population: 68.59 years. Country comparison to the world: 183rd
male: 66.43 years
female: 70.81 years (2023 est.)
total population: 63 years
male: 60.5 years
female: 65.5 years (2018 est.)
total population: 61.48 years
male: 59.11 years
female: 63.93 years (2015 est.)

HIV/AIDS

adult prevalence rate: 1.15%
people living with HIV/AIDS: 730,300
deaths: 23,400 (2014 est.)

Literacy

definition: age 15 and over can read and write
total population: 51.8%
male: 57.2%
female: 44.4% (2017)
total population: 49.1%
male: 57.2%
female: 41.1% (2015 est.)

School life expectancy (primary to tertiary education)

total: 8 years (2012)
male: 9 years (2012)
female: 8 years (2012)

Major infectious diseases

degree of risk: very high (2023)
food or waterborne diseases: bacterial and protozoal diarrhea, hepatitis A, and typhoid fever
vectorborne diseases: malaria and dengue fever
water contact diseases: schistosomiasis
animal contact diseases: rabies
respiratory diseases: meningococcal meningitis

note: on 21 March 2022, the US Centers for Disease Control and Prevention (CDC) issued a Travel Alert for polio in Africa; Ethiopia is currently considered a high risk to travelers for circulating vaccine-derived polioviruses (cVDPV); vaccine-derived poliovirus (VDPV) is a strain of the weakened poliovirus that was initially included in oral polio vaccine (OPV) and that has changed over time and behaves more like the wild or naturally occurring virus; this means it can be spread more easily to people who are unvaccinated against polio and who come in contact with the stool or respiratory secretions, such as from a sneeze, of an “infected” person who received oral polio vaccine; the CDC recommends that before any international travel, anyone unvaccinated, incompletely vaccinated, or with an unknown polio vaccination status should complete the routine polio vaccine series; before travel to any high-risk destination, CDC recommends that adults who previously completed the full, routine polio vaccine series receive a single, lifetime booster dose of polio vaccine

Unemployment, youth ages 15–24

total: 5,7 % (2021 est.)
male: 4.4 % (2021 est.)
female: 7.2 % (2021 est.)

See also

Related Research Articles

<span class="mw-page-title-main">Demographics of Burkina Faso</span>

Burkina Faso's 22.1 million people belong to two major West African cultural groups: the Gur (Voltaic) and the Mandé. The Voltaic are far more numerous and include the Mossi, who make up about one-half of the population. The Mossi claim descent from warriors who migrated to present-day Burkina Faso and established an empire that lasted more than 800 years. Predominantly farmers, the Mossi are still bound by the traditions of the Mogho Naba, who hold court in Ouagadougou.

<span class="mw-page-title-main">Demographics of Chad</span>

The people of Chad speak more than 100 languages and divide themselves into many ethnic groups. However, language and ethnicity are not the same. Moreover, neither element can be tied to a particular physical type.

<span class="mw-page-title-main">Demographics of the Central African Republic</span> Demographics of country

Demographic features of the population of the Central African Republic include population density, ethnicity, education level, health of the populace, economic status, religious affiliations and other aspects of the population.

<span class="mw-page-title-main">Demographics of Djibouti</span>

Demographic features of Djibouti include population density, ethnicity, education level, health, economic status, religious affiliations and other aspects.

<span class="mw-page-title-main">Demographics of Guinea</span>

Demographics of Guinea describes the condition and overview of Guinea's peoples. Demographic topics include basic education, health, and population statistics as well as identified racial and religious affiliations.

<span class="mw-page-title-main">Demographics of Guinea-Bissau</span>

This is a demography of the population of Guinea-Bissau including population density, ethnicity, education level, health of the populace, economic status, religious affiliations and other aspects of the population.

<span class="mw-page-title-main">Demographics of Kenya</span> Demographics of a country

The demography of Kenya is monitored by the Kenyan National Bureau of Statistics. Kenya is a multi-ethnic state in East Africa. Its total population was at 47,558,296 as of the 2019 census.

<span class="mw-page-title-main">Demographics of Liberia</span>

As of 2006, Liberia had the highest population growth rate in the world. This has declined since, however, and stood at 2.37 percent in 2023.

<span class="mw-page-title-main">Demographics of Malawi</span> Demographics of the country

Demographic features of the population of Malawi include population density, ethnicity, education level, health of the populace, economic status, religious affiliations and other aspects of the population.

<span class="mw-page-title-main">Demographics of Mauritania</span>

Demographic features of the population of Mauritania include population density, ethnicity, education level, health of the populace, economic status, religious affiliations and other aspects.

<span class="mw-page-title-main">Demographics of Mozambique</span>

The demographics of Mozambique describes the condition and overview of Mozambique's peoples. Demographic topics include basic education, health, and population statistics as well as identified racial and religious affiliations.

<span class="mw-page-title-main">Demographics of Niger</span>

The demographic features of Nigeriens, the people of Niger consist of population density, ethnicity, education level, health of the populace, economic status, religious affiliations and other aspects of the population.

<span class="mw-page-title-main">Demographics of Nigeria</span>

Nigeria is the most populous country in Africa and the sixth in the world. It is also one of the most densely populated countries in Africa, with approximately 218.5 million people in an area of 923,768 km2 (356,669 sq mi).

<span class="mw-page-title-main">Demographics of the Republic of the Congo</span> National demographics

Demographic features of the population of the Republic of the Congo include population density, ethnicity, education level, health of the populace, economic status, religious affiliations and other aspects of the population.

<span class="mw-page-title-main">Demographics of Senegal</span>

Demographic features of the population of Senegal include population density, ethnicity, education level, health of the populace, economic status, religious affiliations and other aspects of the population.

<span class="mw-page-title-main">Demographics of Sierra Leone</span>

The demographics of Sierra Leone are made up of an indigenous population from 18 ethnic groups. The Temne in the north and the Mende in the south are the largest. About 60,000 are Krio, the descendants of freed slaves who returned to Sierra Leone from Great Britain, North America and slave ships captured on the high seas. In addition, about 5,000 Lebanese, 1,000 Indians, and 5,000 Europeans reside in the country.

<span class="mw-page-title-main">Demographics of Madagascar</span>

Demographic features of the population of Madagascar include population density, ethnicity, education level, health of the populace, economic status, religious affiliations and other aspects of the population.

<span class="mw-page-title-main">Demographics of Uganda</span> Aspect of human geography in Uganda

Demographic features of the population of Uganda include population density, ethnicity, education level, health of the populace, economic status, religious affiliations and others.

<span class="mw-page-title-main">Demographics of the Gambia</span> Demographics of the West African country

The demographic characteristics of the population of The Gambia are known through national censuses, conducted in ten-year intervals and analyzed by The Gambian Bureau of Statistics (GBOS) since 1963. The latest census was conducted in 2013. The population of The Gambia at the 2013 census was 1.8 million. The population density is 176.1 per square kilometer, and the overall life expectancy in The Gambia is 64.1 years. Since the first census of 1963, the population of The Gambia has increased every ten years by an average of 43.2 percent. Since 1950s, the birth rate has constantly exceeded the death rate; the natural growth rate is positive. The Gambia is in the second stage of demographic transition. In terms of age structure, The Gambia is dominated by 15- to 24-year-old segment (57.6%). The median age of the population is 19.9 years, and the gender ratio of the total population is 0.98 males per female.

<span class="mw-page-title-main">Demographics of Somalia</span>

Demographic features of Somalia's inhabitants include ethnicity, language, population density, education level, health, economic status, religious affiliations and other aspects of the population. Somalia is believed to be one of the most homogeneous countries in Africa.

References

  1. 1 2 3 "World Population Prospects 2022". United Nations Department of Economic and Social Affairs, Population Division. Retrieved 17 July 2022.
  2. 1 2 3 "World Population Prospects 2022: Demographic indicators by region, subregion and country, annually for 1950-2100" (XSLX) ("Total Population, as of 1 July (thousands)"). United Nations Department of Economic and Social Affairs, Population Division. Retrieved 17 July 2022.
  3. 1 2 "Table 2.2 Percentage distribution of major ethnic groups: 2007" (PDF). Summary and Statistical Report of the 2007 Population and Housing Census Results. Population Census Commission. p. 16. Archived from the original (PDF) on 25 March 2009. Retrieved 14 December 2020.
  4. "Abyssinia: Ethiopian Protest". Time Europe . 9 August 1926. Archived from the original on 6 February 2004. Retrieved 5 June 2005.
  5. "Ethiopia: Targeting the Anuak: Background and Context". www.hrw.org. Retrieved 22 December 2023.
  6. "SNNPR". Ethiopia Peace Observatory.
  7. "Glottolog 4.8 - Languages of Ethiopia". glottolog.org. Retrieved 30 August 2023.
  8. "Languages of Ethiopia". Ethnologue. SIL International. Archived from the original on 18 March 2017. Retrieved 9 February 2013.
  9. Yigezu, Moges (2012). Language Ideologies and Challenges of Multilingual Education in Ethiopia. African Books Collective. p. 143. ISBN   978-99944-55-47-8.
  10. 1 2 "ETHIOPIA TO ADD 4 MORE OFFICIAL LANGUAGES TO FOSTER UNITY". Ventures Africa. Ventures. 4 March 2020. Retrieved 2 February 2021.
  11. 1 2 "Ethiopia is adding four more official languages to Amharic as political instability mounts". Nazret. Archived from the original on 17 August 2021. Retrieved 2 February 2021.
  12. 1 2 Shaban, Abdurahman. "One to five: Ethiopia gets four new federal working languages". Africa News. Archived from the original on 15 December 2020. Retrieved 22 February 2021.
  13. "Ethiopia Population 2019", World Population Review, 18 April 2022
  14. "Ethiopia, Religion And Social Profile | National Profiles | International Data | TheARDA". www.thearda.com. Archived from the original on 21 June 2021. Retrieved 28 July 2021.
  15. "Summary and Statistical Report of the 2007 Population and Housing Census" (PDF). 14 February 2012. Archived from the original on 14 February 2012. Retrieved 27 August 2017.{{cite web}}: CS1 maint: bot: original URL status unknown (link)
  16. "Population". Archived from the original on 5 May 2013. Retrieved 29 April 2013.
  17. "Explore All Countries – Ethiopia". The World Factbook. CIA . Retrieved 30 August 2021. landlocked – entire coastline along the Red Sea was lost with the de jure independence of Eritrea on 24 May 1993; Ethiopia is, therefore, the most populous landlocked country in the world
  18. "Population, total | Data". data.worldbank.org. Retrieved 23 September 2019.
  19. Clarence-Smith, W.G. (1989) The Economics of the Indian Ocean Slave Trade in the Nineteenth Century. p. 100. ISBN   0-7146-3359-3
  20. "IFs Forecast – Version 7.00 – Google Public Data Explorer" . Retrieved 24 October 2015.
  21. "National Accounts Estimates of Main Aggregates". The United Nations Statistics Division. Retrieved 12 November 2013.
  22. 1 2 "Population Division of the Department of Economic and Social Affairs of the United Nations Secretariat, World Population Prospects: The 2010 Revision". Esa.un.org. Retrieved 27 August 2017.
  23. https://unstats.un.org/unsd/demographic-social/products/dyb/#statistics>
  24. "UNSD — Demographic and Social Statistics".
  25. 1 2 "World Population Prospects: The 2022 Revision".
  26. "Country Level". 2007 Population and Housing Census of Ethiopia. CSA. 13 July 2010. Archived from the original on 13 November 2012. Retrieved 18 January 2013.
  27. "MEASURE DHS: Demographic and Health Surveys". Microdata.worldbank.org. Retrieved 27 August 2017.
  28. "Ethiopia Demographic and Health Survey 2011" (PDF). Dhsprogram.com. Retrieved 27 August 2017.
  29. "Ethiopia Population 2022", World Population Review, 2022
  30. PD-icon.svg This article incorporates text from this source, which is in the public domain : "The World FactBook – Ethiopia", The World Factbook , 12 July 2018

Attribution