Tunisia's population was estimated to be around 12.04 million in 2022.[7] In the generally youthful African continent, Tunisia's population is among the most mature. This is because the government has supported a successful family planning program that has reduced the population growth rate to just over 1% per annum, contributing to Tunisia's economic and social stability.[8]
The population of Tunisia is made up of Arabs (98%),[2]Berbers (1%),[3][4] and others (1%). Around 98 percent of the population are Muslim.[9] There is a Jewish population on the southern island of Djerba and in Tunis. There also exists a small autochthonous group of Christian adherents.[10]
Population History
Historical population
Year
Pop.
±% p.a.
0
800,000
—
500
850,000
+0.01%
1000
1,000,000
+0.03%
1500
800,000
−0.04%
1700
800,000
+0.00%
1900
1,880,000
+0.43%
1960
4,220,701
+1.36%
1970
5,127,000
+1.96%
1980
6,384,000
+2.22%
1990
8,154,400
+2.48%
2000
9,563,500
+1.61%
2010
10,547,000
+0.98%
2020
11,818,619
+1.14%
Source: National Institute of Statistics[11] and United Nations Statistics Division[12]
The majority of the population of Tunisia is made up of Arabs (98% of the population).[2] The first people known to history in what is now Tunisia were the Berbers, who currently make up 1% of the population, and were ultimately conquered by the Arabs in the 7th century.[3] There was a continuing inflow of nomadic Arab tribes to the Maghreb from the Arabian Peninsula since the 7th century with a major wave in the 11th century.[18]
Whilst the Ottoman influence has been particularly significant in forming the Turco-Tunisian community, other peoples have also migrated to Tunisia during different periods of time, including Sub-Saharan Africans, Greeks, Romans, Phoenicians (Punics), Jews, and French settlers. The Tunisian, by 1870 the distinction between the Arabic-speaking mass and the Turkish elite had blurred.[19] There is also a small Berber (1% at most)[4] population located in the Dahar mountains and on the island of Djerba in the south-east and in the Khroumire mountainous region in the north-west.
From the late 19th century to after World War II, Tunisia was home to large populations of French and Italians (255,000 Europeans in 1956),[20] although nearly all of them, along with the Jewish population, left after Tunisia became independent. The history of the Jews in Tunisia goes back some 2,000 years. In 1948 the Jewish population was an estimated 105,000, but by 2013 only about 900 remained.[21]
After the Reconquista and expulsion of non-Christians and Moriscos from Spain, many Spanish Muslims and Jews also arrived. According to Matthew Carr, "As many as eighty thousand Moriscos settled in Tunisia, most of them in and around the capital, Tunis, which still contains a quarter known as Zuqaq al-Andalus, or Andalusia Alley."[22]
"In fact, the Tunisian genetic distances to European samples are smaller than those to North African groups. (...) This could be explained by the history of the Tunisian population, reflecting the influence of the ancient Punic settlers of Carthage followed, among others, by Roman, Byzantine, Arab and French occupations, according to historical records. Notwithstanding, other explanations cannot be discarded, such as the relative heterogeneity within current Tunisian populations, and/or the limited sub-Saharan genetic influence in this region as compared with other North African areas, without excluding the possibility of the genetic drift, whose effect might be particularly amplified on the X chromosome.",[27][28]
However, other research has suggested instead that Tunisians exhibit a mostly indigenous North African ancestral component similar to other Northwest African populations; characterized by a high amount of native Northwest African genes, but with higher Middle Eastern input than in Algeria or Morocco.[29]
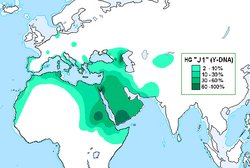
Y-Chromosome
Young Tunisians in Ras Jebel.Men wearing the chechia.
According to statistics from the Tunisian Office for Foreign Nationals. (OTE), the Tunisian diaspora consists of approximately 2.54 million people, with 49% of them residing in France. France has historically hosted a large portion of the Tunisian emigrants, due to historical ties and labor agreements between the two countries.
Berber (minority language spoken by <1% of the population)[36]
Religion
Muslim (official; Sunni) 99%, other (includes Christian, Jewish, Shia Muslim, and Baha'i) <1%
References
↑Tunisia: People, CIA World Factbook, 2018 This article incorporates text from this source, which is in the public domain.
1234"Tunisia", The World Factbook, Central Intelligence Agency, 9 September 2022, archived from the original on 18 January 2026, retrieved 18 September 2022
↑Stearns, Peter N.; Leonard Langer, William (2001). The Encyclopedia of World History: Ancient, Medieval, and Modern, Chronologically Arranged (6ed.). Houghton Mifflin Harcourt. pp.129–131. ISBN978-0-395-65237-4.
↑Green, Arnold H. (1978), The Tunisian Ulama 1873–1915: Social Structure and Response to Ideological Currents, BRILL, p.69, ISBN978-90-04-05687-9
This page is based on this Wikipedia article Text is available under the CC BY-SA 4.0 license; additional terms may apply. Images, videos and audio are available under their respective licenses.