Demographics of Cape Verde

Last updated

Demographics of Cape Verde
Cape Verde single age population pyramid 2020.png
Population pyramid of Cape Verde in 2020
Population596,707 (2022 est.)
Growth rate1.21% (2022 est.)
Birth rate18.49 births/1,000 population (2022 est.)
Death rate5.8 deaths/1,000 population (2022 est.)
Life expectancy73.75 years
  male71.41 years
  female76.15 years
Fertility rate2.13 children born/woman (2022 est.)
Infant mortality rate23.53 deaths/1,000 live births
Net migration rate-0.57 migrant(s)/1,000 population (2022 est.)
Age structure
0–14 years27.95%
65 and over5.48%
Sex ratio
Total0.95 male(s)/female (2022 est.)
At birth1.03 male(s)/female
Under 151.01 male(s)/female
65 and over0.52 male(s)/female
Nationality
NationalityCabo Verdean or Cape Verdean

Demographic features of the population of Cape Verde include population density, ethnicity, education level, health of the populace, economic status, religious affiliations and other aspects of the population.

Contents

Cape Verde has a population of about 540,000 inhabitants who live in the islands. A large proportion (236,000) of Cape Verdeans live on the main island, Santiago. [1] Many more live abroad in the Cape Verdean diaspora in mainland Africa, Europe, U.S., Brazil, et cetera.

The archipelago of Cape Verde were first found and claimed by Portuguese sailors working for the Portuguese Crown in 1456. Cape Verdeans are West African. Many foreigners from other parts of the world settled in Cape Verde as their permanent country.
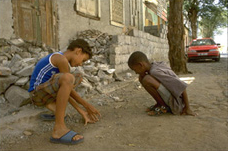
Two Cape Verdean children playing IMG0053a.jpg
Two Cape Verdean children playing

Survival in a country with few natural resources has historically induced Cape Verdeans to emigrate. In fact, of the more than 1 million people of Cape Verdean ancestry in the world, only a little more than one-third actually live on the islands. Some 500,000 people of Cape Verdean ancestry live in the United States, mainly in New England. Many people of Cape Verdean ancestry also live in Portugal, Netherlands, France, Italy and Senegal. Cape Verdean populations also settled Spain, Germany, Canada, and other CPLP countries (Angola, Brazil and Guinea-Bissau). Since independence from Portugal in 1975, a number of Cape Verdean students continued to be admitted every year at Portuguese high schools, polytechnical institutes and universities, through bilateral agreements between the Portuguese and Cape Verdean governments.

Portuguese functions as a state language. Virtually all formal documents and official declarations are stated in Portuguese. But it is not the first language. Cape Verdean, commonly called Kriolu, is spoken as a mother tongue by virtually all Cape Verdeans, irrespective of social status or religious affiliation. Moreover, historical linguists often attribute Cape Verdean Creole as the oldest "New World" contact language. It is a "contact" language in the sense that it was birthed and evolved between linguistically different groups who, by necessity, had to create a common language to communicate with each other. There is a rich repertoire of literature and songs in Cape Verdean Creole. In religion, the majority of Cape Verdeans follow Catholic Christianity. There are some Protestants, Baháʼís and Muslims.

Population

Demographics of Cape Verde, Data of FAO, year 2005 ; Number of inhabitants in thousands. Cape-Verde-demography.png
Demographics of Cape Verde, Data of FAO, year 2005 ; Number of inhabitants in thousands.

According to the 2022 revision of the World Population Prospects [2] [3] the total population was 587,925 in 2021, compared to only 178,000 in 1950. The proportion of children below the age of 15 in 2010 was 31.8%, 62.3% was between 15 and 65 years of age, while 5.9% was 65 years or older. [4]

Total populationPopulation aged 0–14 (%)Population aged 15–64 (%)Population aged 65+ (%)
1950178,00032.659.87.6
1955195,00035.857.96.2
1960211,00042.153.24.8
1965240,00048.547.34.2
1970274,00048.247.84
1975311,00045.849.64.6
1980300,0004648.75.3
1985328,00044.550.55
1990348,00045.449.84.8
1995395,00044.550.55
2000437,00041.752.95.3
2005473,0003757.25.8
2010496,00031.862.35.9
Population by Sex and Age Group (Census 16.VI.2010): [5]
Age GroupMaleFemaleTotal%
Total243 403248 280491 683100
0–425 13125 06950 20010.21
5–925 16825 04050 20810.21
10–1427 86427 36155 22511.23
15–1929 65529 40559 06012.01
20–2427 32725 57852 90510.76
25–2923 33621 00544 3419.02
30–3418 16516 33934 5047.02
35–3914 10613 13027 2365.54
40–4412 98813 30326 2915.35
45–4911 34712 16523 5124.78
50–548 1629 99918 1613.69
55–594 9477 19612 1432.47
60–642 6133 5806 1931.26
65-692 4993 7166 2151.26
70-743 4375 2298 6661.76
75-792 9804 4537 4331.51
80-842 0923 1855 2771.07
85-898271 3582 1850.44
90-943776961 0730.22
95+1723254970.10
Age groupMaleFemaleTotalPercent
0–1478 16377 470155 63331.65
15–64152 646151 700304 34661.90
65+12 38418 96231 3466.38
Unknown2101483580.07
Population Estimates by Sex and Age Group (01.VII.2020) (Data refer to national projections.): [6]
Age GroupMaleFemaleTotal%
Total281 533275 324556 857100
0–426 73925 52452 2649.39
5–926 16224 97351 1359.18
10–1425 26225 38950 6519.10
15–1923 73423 48347 2188.48
20–2423 95522 46146 4168.34
25–2928 15926 01554 1739.73
30–3428 60324 99553 5979.62
35–3924 11120 48444 5958.01
40–4418 73815 92334 6606.22
45–4914 04312 78026 8224.82
50–5412 28212 69324 9744.48
55–5910 43711 55721 9943.95
60–647 1259 22616 3512.94
65-694 0806 40210 4821.88
70-742 0502 9555 0060.90
75-791 7222 7724 4940.81
80-842 0373 4965 5330.99
85-891 4432 3893 8330.69
90-946821 2491 9310.35
95+1705607300.13
Age groupMaleFemaleTotalPercent
0–1478 16375 886154 04927.66
15–64191 186179 615370 80166.59
65+12 18419 82332 0075.75
Population by Sex and Age Group (Census 16.VI.2021): [7]
Age GroupMaleFemaleTotal%
Total246 363244 870491 233100
0–423 11122 42945 5409.27
5–923 53323 08646 6199.49
10–1423 80922 77146 5809.48
15–1921 90320 40142 3048.61
20–2420 39118 15938 5507.85
25–2922 48121 66544 1468.99
30–3422 55221 68144 2339.00
35–3919 21718 10537 3227.60
40–4415 82014 25930 0796.12
45–4912 26911 34723 6164.81
50–5411 25711 22422 4814.58
55–5910 00110 68220 6834.21
60–647 5368 76516 3013.32
65-694 4966 51011 0062.24
70-742 3473 2795 6261.15
75-791 6852 8424 5270.92
80-841 8393 4045 2431.07
85-891 2572 4733 7300.76
90-946481 3161 9640.40
95+2114726831.39
Age groupMaleFemaleTotalPercent
0–1470 45368 286138 73928.24
15–64163 427156 288319 71565.08
65+12 48320 29632 7796.67

Vital statistics

Vital events of Cape Verde are not (yet) available for recent years. The Population Department of the United Nations prepared the following estimates. [4]

PeriodLive births per yearDeaths per yearNatural change per yearCBR*CDR*NC*TFR*IMR*
1950-19559 0004 0005 00049.022.626.36.57139
1955-196010 0004 0005 00048.021.126.96.76132
1960-196510 0004 0006 00045.018.726.36.97125
1965-197011 0004 0006 00041.416.425.06.97117
1970-197512 0004 0008 00041.113.427.76.8696
1975-198013 0004 0009 00041.611.630.06.6278
1980-198513 0003 00010 00041.310.331.06.1065
1985-199014 0003 00011 00040.99.231.75.6354
1990-199514 0003 00011 00036.57.928.64.9344
1995-200013 0003 00010 00031.66.724.94.1537
2000-200512 0003 0009 00026.25.820.53.2828
2005-201011 0003 0008 00021.95.216.72.6021
* CBR = crude birth rate (per 1000); CDR = crude death rate (per 1000); NC = natural change (per 1000); IMR = infant mortality rate per 1000 births; TFR = total fertility rate (number of children per woman)

Births and deaths

[8] [9]

YearPopulationLive birthsDeathsNatural increaseCrude birth rateCrude death rateRate of natural increaseTFR
19483,756
19493,9043,641263
19505,3222,5622,760
19517,3672,3774,990
19527,6472,4555,192
19537,5972,8664,731
19548,6973,3055,392
19558,5472,2206,327
19568,3772,2006,177
19578,2372,7905,447
19589,0262,5526,474
19599,6092,3827,227
19608,9543,1275,827
19618,3192,5435,776
19628,9522,4526,500
19639,6712,9966,675
19649,7832,3157,468
19659,6382,3777,261
19669,6212,1677,454
196710,1902,5937,597
196810,1312,3977,734
19699,6713,4526,219
19709,3792,8836,496
19719,4934,1475,346
19728,9662,7796,187
19738,4183,5134,905
19748,4922,5765,916
19758,2102,7965,414
19769,8632,8696,994
19779,9652,5647,401
197810,0603,2076,853
19798,2892,4695,820
19809,6502,0807,570
19818,580
198211,0662,1698,897
198311,4382,6498,789
198411,6962,8638,833
198511,2822,7358,547
198612,636
198712,771
198812,443
1989
19909,6692,5057,164
199112,2892,6169,673
19929,6712,8436,828
19932,821
1994
1995386,8133,5209.1
1996393,4782,7156.9
1997406,2673,0477.5
1998413,38215,4602,81112,6496.8
1999426,0612,8126.6
2000436,82112,7462,43310,31329.25.623.64.00
2001445,03512,5502,39610,15428.25.422.8
2002452,19812,3452,3959,95027.35.322.0
2003460,83712,1202,6009,52026.35.620.7
2004468,85411,8622,5229,34025.35.419.9
2005478,16311,5542,4239,13124.35.119.2
2006487,1219,7652,6127,15320.75.415.32.44
2007491,41910,4212,4847,93721.85.216.62.57
2008499,79610,1652,6837,48221.05.515.52.43
2009485,6779,9622,5837,37920.45.315.12.33
2010491,68310,5682,3528,21621.44.816.62.42
2011499,92910,7772,4888,28921.65.016.62.44
2012505,98310,0502,6107,44019.95.214.72.26
2013512,1739,8452,5187,32719.24.914.32.19
2014518,4679,8682,5287,34019.04.914.12.17
2015524,8339,7572,7616,99618.65.313.32.11
2016531,2399,9352,5917,34418.74.913.82.13
2017537,6619,8992,4977,40218.44.613.62.11
2018544,0819,4802,8366,58817.45.212.21.98
20199,1542,7716,38316.65.011.6
20208,9442,9595,98516.15.310.8
20217,6323,1784,45413.65.68.0

Fertility and births

Total fertility rate (TFR) (wanted fertility rate) and crude birth rate (CBR): [10]

YearCBR (Total)TFR (Total)CBR (Urban)TFR (Urban)CBR (Rural)TFR (Rural)
2005222,9 (2,8)232,7 (2,7)223,1 (3,0)

Fertility data from 2005 (DHS Program): [11]

RegionTotal fertility ratePercentage of women age 15-49 currently pregnantMean number of children ever born to women age 40-49
Santo Antão2.93.86.0
São Vicente2.03.44.0
São Nicolau3.34.44.2
Sal3.27.03.9
Boa Vista2.410.04.4
Maio2.61.74.3
Santiago3.15.44.5
Praia Urbano3.25.14.5
Santiago Norte2.76.24.3
Resto Santiago3.34.64.8
Fogo3.16.35.6
Brava2.87.05.0

Life expectancy

PeriodLife expectancy in
Years [12]
1950–195548.08
1955–1960Increase2.svg 48.77
1960–1965Increase2.svg 49.45
1965–1970Increase2.svg 52.43
1970–1975Increase2.svg 55.25
1975–1980Increase2.svg 60.52
1980–1985Increase2.svg 62.37
1985–1990Increase2.svg 64.10
1990–1995Increase2.svg 65.73
1995–2000Increase2.svg 67.94
2000–2005Increase2.svg 71.27
2005–2010Increase2.svg 71.77
2010–2015Increase2.svg 72.14

Other demographic statistics

Demographic statistics according to the World Population Review in 2022. [13]

The following demographic statistics are from the CIA World Factbook. [14]

Population

596,707 (2022 est.)
568,373 (July 2018 est.)

Age structure

Population pyramid of Cape Verde in 2020 Cape Verde single age population pyramid 2020.png
Population pyramid of Cape Verde in 2020
0-14 years: 27.95% (male 82,010/female 81,012)
15-24 years: 18.69% (male 54,521/female 54,504)
25-54 years: 40.76% (male 115,811/female 121,923)
55-64 years: 7.12% (male 18,939/female 22,597)
65 years and over: 5.48% (male 12,037/female 19,901) (2020 est.)
0-14 years: 28.7% (male 82,035 /female 81,082)
15-24 years: 19.64% (male 55,811 /female 55,798)
25-54 years: 40.02% (male 110,646 /female 116,804)
55-64 years: 6.4% (male 16,154 /female 20,245)
65 years and over: 5.24% (male 11,272 /female 18,526) (2018 est.)

Median age

total: 26.8 years. Country comparison to the world: 151st
male: 25.9 years
female: 27.6 years (2020 est.)
total: 25.8 years. Country comparison to the world: 153rd
male: 25 years
female: 26.7 years (2018 est.)
Total: 23.1 years
Male: 22.3 years
Female: 23.9 years (2012 est.)

Population growth rate

1.21% (2022 est.) Country comparison to the world: 76th
1.32% (2018 est.) Country comparison to the world: 83rd

Total fertility rate

2.13 children born/woman (2022 est.) Country comparison to the world: 92nd
2.21 children born/woman (2018 est.) Country comparison to the world: 95th

Birth rate

18.49 births/1,000 population (2022 est.) Country comparison to the world: 79th
19.7 births/1,000 population (2018 est.) Country comparison to the world: 79th

Death rate

5.8 deaths/1,000 population (2022 est.) Country comparison to the world: 168th
6 deaths/1,000 population (2018 est.) Country comparison to the world: 163rd

Net migration rate

-0.57 migrant(s)/1,000 population (2022 est.) Country comparison to the world: 126th
-0.6 migrant(s)/1,000 population (2017 est.) Country comparison to the world: 128th

Urbanization

urban population: 67.5% of total population (2022)
rate of urbanization: 1.83% annual rate of change (2020-25 est.)
urban population: 65.7% of total population (2018)
rate of urbanization: 1.97% annual rate of change (2015-20 est.)

Contraceptive prevalence rate

55.8% (2018)

Sex ratio

At birth: 1.03 male(s)/female
Under 15 years: 1.01 male(s)/female
15-64 years: 0.97 male(s)/female
65 years and over: 0.58 male(s)/female
Total population: 0.95 male(s)/female (2009 est.)

Life expectancy at birth

total population: 73.75 years. Country comparison to the world: 144th
male: 71.41 years
female: 76.15 years (2022 est.)
total population: 72.7 years (2018 est.)
male: 70.3 years (2018 est.)
female: 75.1 years (2018 est.) Country comparison to the world: 147th
Total population: 71 years
Male: 68.78 years
Female: 73.27 years (2012 est.)

HIV/AIDS

Adult prevalence rate: 0.035% (2001 est.)
People living with HIV/AIDS: 775 (2001)
Deaths: 225 (as of 2001)

Genetics

E1b1a, R1b

The predominance of West African mitochondrial DNA haplotypes in their maternal gene pool, the major West African Y-chromosome lineage E3a was observed only at a frequency of 15.9%. Overall, these results indicate that gene flow from multiple sources and sex-specific patterns have been important in the formation of the genomic diversity in the Cabo Verde islands. [15]

Religions

Catholic 77.3%, Protestant 3.7% (includes Church of the Nazarene 1.7%, Adventist 1.5%, Universal Kingdom of God 0.4%, and God and Love 0.1%), other Christian 4.3% (includes Christian Rationalism 1.9%, Jehovah's Witness 1%, Assembly of God 0.9%, and New Apostolic 0.5%), Islam 1.8%, Other 1.3%, None 10.8%, Unspecified 0.7% (2010 estimate) [16]

Languages

Portuguese (official), Kriolu [16]

Literacy

Definition: age 15 and over can read and write
Total population: 76.6%
Male: 85.8%
Female: 69.2% (2003 est.)

School life expectancy (primary to tertiary education)

total: 13 years
male: 12 years
female: 13 years (2018)
total: 12 years (2017)
male: 12 years (2017)
female: 12 years (2017)

Dependency ratios

total dependency ratio: 55.4 (2015 est.)
youth dependency ratio: 48.4 (2015 est.)
elderly dependency ratio: 6.9 (2015 est.)
potential support ratio: 14.4 (2015 est.)

See also

Related Research Articles

<span class="mw-page-title-main">Demographics of Angola</span>

Demographic features of the population of Angola include population density, ethnicity, education level, health of the populace, economic status, religious affiliations and other aspects.

<span class="mw-page-title-main">Demographics of Botswana</span> Demographics of country

Demographic features of the population of Botswana include population density, ethnicity, education level, health of the populace, economic status, religious affiliations and other aspects.

<span class="mw-page-title-main">Demographics of Cameroon</span>

The demographic profile of Cameroon is complex for a country of its population. Cameroon comprises an estimated 250 distinct ethnic groups, which may be formed into five large regional-cultural divisions:

<span class="mw-page-title-main">Demographics of Ivory Coast</span>

Demographic features of the population of Ivory Coast include population density, ethnicity, education level, health of the populace, economic status, religious affiliations and other aspects of the population.

<span class="mw-page-title-main">Demographics of Djibouti</span>

Demographic features of Djibouti include population density, ethnicity, education level, health, economic status, religious affiliations and other aspects.

<span class="mw-page-title-main">Demographics of the Dominican Republic</span>

This is a demography of the population of the Dominican Republic including population density, ethnicity, education level, health of the populace, economic status, religious affiliations and other aspects of the population.

<span class="mw-page-title-main">Demographics of Guinea</span>

Demographics of Guinea describes the condition and overview of Guinea's peoples. Demographic topics include basic education, health, and population statistics as well as identified racial and religious affiliations.

<span class="mw-page-title-main">Demographics of Guinea-Bissau</span>

This is a demography of the population of Guinea-Bissau including population density, ethnicity, education level, health of the populace, economic status, religious affiliations and other aspects of the population.

<span class="mw-page-title-main">Demographics of Jamaica</span>

Jamaica is an island country in the Caribbean. The country had a population of 2,825,352 in 2023, the fourth largest in the region.

<span class="mw-page-title-main">Demographics of Lesotho</span>

Demographic features of the population of Lesotho include population density, ethnicity, education level, health of the populace, economic status, religious affiliations and other aspects.

<span class="mw-page-title-main">Demographics of Namibia</span>

This is a demography of the population of Namibia including population density, ethnicity, education level, health of the populace, economic status, religious affiliations and other aspects of the population.

<span class="mw-page-title-main">Demographics of the Republic of the Congo</span> National demographics

Demographic features of the population of the Republic of the Congo include population density, ethnicity, education level, health of the populace, economic status, religious affiliations and other aspects of the population.

<span class="mw-page-title-main">Demographics of Rwanda</span>

Demographic features of the population of Rwanda include population density, ethnicity, education higher level, health of the populace, economic status, religious affiliations and other aspects.

<span class="mw-page-title-main">Demographics of São Tomé and Príncipe</span>

Demographic features of the population of São Tomé and Príncipe include population density, ethnicity, education level, health of the populace, economic status, religious affiliations and other aspects.

<span class="mw-page-title-main">Demographics of Eswatini</span>

Demographic features of the population of Eswatini include population density, ethnicity, education level, health of the populace, economic status, religious affiliations and other aspects of the population.

<span class="mw-page-title-main">Demographics of Togo</span>

The demographics of Togo include ethnicity, population density, age, education level, health, economic status and religious affiliations.

<span class="mw-page-title-main">Demographics of Venezuela</span>

Venezuela is a country in South America. The Venezuelan people comprise a combination of heritages, primarily Native American and European. The historically present Native American, Spanish colonists, and African slaves have all contributed to varying degrees. Later, waves of European groups migrated to Venezuela in the 20th century, influencing many aspects of Venezuelan life, including its culture, language, food, and music though small in number.

<span class="mw-page-title-main">Demographics of the Bahamas</span>

This is a demography of the population of The Bahamas including population density, ethnicity, education level, health of the populace, economic status, religious affiliations and other aspects of the population.

<span class="mw-page-title-main">Demographics of Benin</span>

The demographics of Benin include population density, ethnicity, education level, health of the populace, economic status, religious affiliations and other aspects of the population.

<span class="mw-page-title-main">Demographics of the Gambia</span> Demographics of the West African country

The demographic characteristics of the population of The Gambia are known through national censuses, conducted in ten-year intervals and analyzed by The Gambian Bureau of Statistics (GBOS) since 1963. The latest census was conducted in 2013. The population of The Gambia at the 2013 census was 1.8 million. The population density is 176.1 per square kilometer, and the overall life expectancy in The Gambia is 64.1 years. Since the first census of 1963, the population of The Gambia has increased every ten years by an average of 43.2 percent. Since 1950s, the birth rate has constantly exceeded the death rate; the natural growth rate is positive. The Gambia is in the second stage of demographic transition. In terms of age structure, The Gambia is dominated by 15- to 24-year-old segment (57.6%). The median age of the population is 19.9 years, and the gender ratio of the total population is 0.98 males per female.

References

  1. "Cape Verde: Population". Caperverde.com. Retrieved 3 October 2017.
  2. "World Population Prospects 2022". population.un.org. United Nations Department of Economic and Social Affairs, Population Division. Retrieved July 17, 2022.
  3. "World Population Prospects 2022: Demographic indicators by region, subregion and country, annually for 1950-2100" (XSLX). population.un.org ("Total Population, as of 1 July (thousands)"). United Nations Department of Economic and Social Affairs, Population Division. Retrieved July 17, 2022.
  4. 1 2 "Population Division of the Department of Economic and Social Affairs of the United Nations Secretariat, World Population Prospects: The 2010 Revision". Esa.un.org. Retrieved 3 October 2017.
  5. "UNSD — Demographic and Social Statistics".
  6. "UNSD — Demographic and Social Statistics".
  7. "UNSD — Demographic and Social Statistics".
  8. "United Nations Statistics Division - Demographic and Social Statistics". unstats.un.org. Retrieved 3 October 2017.
  9. "Relatório Estatístico".
  10. "Server Error". microdata.worldbank.org. Archived from the original on 3 March 2016. Retrieved 3 October 2017.
  11. "Inquérito Demográfico e de Saúde Reprodutiva (IDSR-II)" (PDF). Dhsprogram.com. 2005. Archived (PDF) from the original on 2022-10-09. Retrieved 2 October 2017.
  12. "World Population Prospects - Population Division - United Nations". esa.un.org. Retrieved 2018-08-26.
  13. "Cape Verde Population 2022", World Population Review
  14. PD-icon.svg This article incorporates text from this source, which is in the public domain : "The World FactBook - Cape Verde", The World Factbook , May 2022
  15. Gonçalves, Rita; Alexandra Rosa; Ana Freitas; Ana Fernandes; Toomas Kivisild; Richard Villems; António Brehm (26 August 2003). "Y-chromosome lineages in Cabo Verde Islands witness the diverse geographic origin of its first male settlers". Human Genetics. 113 (6): 467–472. doi:10.1007/s00439-003-1007-4. hdl: 10400.13/3047 . PMID   12942365. S2CID   63381583.
  16. 1 2 "Africa :: CAPE VERDE". CIA The World Factbook. 14 April 2022.

PD-icon.svg This article incorporates public domain material from The World Factbook (2024 ed.). CIA.  (Archived 2008 edition)