The population of Africa has grown rapidly over the past century[2] and consequently shows a large youth bulge, further reinforced by a low life expectancy of below 50 years in some African countries.[3] Total population as of 2017 is estimated at more than 1.25 billion, with a growth rate of more than 2.5% p.a. The most populous African country is Nigeria with 191 million inhabitants as of 2017 and a growth rate of 2.6% p.a.[1]
As of 2016[update], the total population of Africa is estimated at 1.225 billion, representing 17% of the world's population.[1] According to UN estimates, the population of Africa may reach 2.5 billion by 2050 (about 26% of the world's total) and nearly 4.5 billion by 2100 (about 40% of the world's total).[1]
The population of Africa first surpassed one billion in 2009, with a doubling time of 27 years (growth rate 2.6% p.a.).[4]
Population growth has continued at almost the same pace, and total population is expected to surpass 2 billion by 2038 (doubling time 29 years, 2.4% p.a.).[1]
The reason for the uncontrolled population growth since the mid 20th century is the decrease of infant mortality and general increase of life expectancy without a corresponding reduction in fertility rate, due to a very limited use of contraceptives. Uncontrolled population growth threatens to overwhelm infrastructure development and crippling economic development.[5]Kenya and Zambia are pursuing programs to promote family planning in an attempt to curb growth rates.[6]
The extreme population growth in Africa is driven by East Africa, Middle Africa and West Africa, which regions are projected to more than quintuple their populations over the 21st century. The most extreme of these is Middle Africa, with an estimated population increase by 680%, from less than 100 million in 2000 to more than 750 million in 2100 (more than half of this figure is driven by the Democratic Republic of the Congo, projected to increase from 47 million in 2000 to 379 million in 2100). Projected population growth is less extreme in Southern Africa and North Africa, which are expected, respectively, to not quite double and triple their populations over the same period.[1]
History of health care development in sub-Saharan Africa
In September 1987, UNICEF and the World Health Organization (WHO) Regional Committee announced the launching of the Bamako Initiative— chartered in response to financial issues occurring in the region during the 1980s, and with the aim of increasing access to vital medications through community involvement in revolving drug funds.[12][13] The 1987 Bamako Initiative conference, organized by the WHO was held in Bamako, the capital of Mali, and helped reshape the health policy of sub-Saharan Africa.[14] The meeting was attended by African Ministers of Health who advocated for improvement of healthcare access through the revitalization of primary healthcare.[12][13] The new strategy substantially increased accessibility through community-based healthcare reform, resulting in more efficient and equitable provision of services. The public health community within the region raised issues in response to the initiative, of which included: equity, access, affordability, integration issues, relative importance given to medications, management, dependency, logistics, and sustainability.[12] As a result of these critiques, the Initiative later transformed to address the increase of accessibility of health services, the enhancement of quality of health services, and the overall improvement of health system management.[12] A comprehensive approach strategy was extended to all areas of health care, with subsequent improvement in the health care indicators and improvement in health care efficiency and cost.[15][16]
The sub-Saharan African region experiences disproportionate rates of infectious and chronic diseases in comparison to other global regions.[18]
Diabetes
Type 2 diabetes persists as an epidemic in the region posing a public health and socioeconomic crisis for sub-Saharan Africa. Scarcity of data for pathogenesis and subtypes for diabetes in sub-Saharan African communities has led to gaps in documenting epidemiology for the disease. High rates of undiagnosed diabetes in many countries leaves individuals at a high risk of chronic health complications, thus, posing a high risk of diabetes-related morbidity and mortality in the region.[19]
HIV/AIDS
In 2011, sub-Saharan Africa was home to 69% of all people living with HIV/AIDS worldwide.[20] In response, a number of initiatives have been launched to educate the public on HIV/AIDS. Among these are combination prevention programmes, considered to be the most effective initiative, the abstinence, be faithful, use a condom campaign, and the Desmond Tutu HIV Foundation's outreach programs.[21] According to a 2013 special report issued by the Joint United Nations Programme on HIV/AIDS (UNAIDS), the number of HIV positive people in Africa receiving anti-retroviral treatment in 2012 was over seven times the number receiving treatment in 2005, with an almost 1 million added in the last year alone.[22][23] The number of AIDS-related deaths in sub-Saharan Africa in 2011 was 33 percent less than the number in 2005.[24] The number of new HIV infections in sub-Saharan Africa in 2011 was 25 percent less than the number in 2001.[24]
Malaria
Malaria is an endemic illness in sub-Saharan Africa, where the majority of malaria cases and deaths worldwide occur.[25]
Maternal and infant mortality
Studies show that more than half of the world’s maternal deaths occur in sub-Saharan Africa.[26][27] However, progress has been made in this area, as maternal mortality rates have decreased for multiple countries in the region by about half since 1990.[27] Additionally, the African Union in July 2003 ratified the Maputo Protocol, which pledges to prohibit female genital mutilation(FGM).[28]
The sub-Saharan African region alone accounts for about 45% of global infant and child mortalities. Studies have shown a relationship between infant survival and the education of mothers, as years of education positively correlate with infant survival rates. Geographic location is also a factor, as child mortality rates are higher in rural areas in comparison to urban regions.[29]
Measles
Routine immunization has been introduced to countries within sub-Saharan Africa in order to prevent measles outbreaks within the region.[30]
Onchocerciasis ("river blindness"), a common cause of blindness, is also endemic to parts of the region. More than 99% of people affected by the illness worldwide live in 31 countries therein.[32] In response, the African Programme for Onchocerciasis Control (APOC) was launched in 1995 with the aim of controlling the disease.[32]
Tuberculosis
Tuberculosis is a leading cause of morbidity and mortality on a global scale, especially in high HIV-prevalent populations in the sub-Saharan African region, with a high case fatality rate.[33]
National healthcare systems
National health systems vary between countries. In Ghana, most health care is provided by the government and largely administered by the Ministry of Health and Ghana Health Services. The healthcare system has five levels of providers: health posts which are first level primary care for rural areas, health centers and clinics, district hospitals, regional hospitals and tertiary hospitals. These programs are funded by the government of Ghana, financial credits, Internally Generated Fund, and Donors-pooled Health Fund.[34]
A shortage of health professionals compounded by migration of health workers from sub-Saharan Africa to other parts of the world (namely English-speaking nations such as the United States and the United Kingdom) has negatively impacted productivity and efficacy of the region's health systems.[35]
More than 85% of individuals in Africa use traditional medicine as an alternative to often expensive allopathic medical health care and costly pharmaceutical products. The Organization of African Unity (OAU) Heads of State and Government declared the 2000s decade as the African Decade on African Traditional Medicine in an effort to promote The WHO African Region’s adopted resolution for institutionalizing traditional medicine in health care systems across the continent.[36] Public policy makers in the region are challenged with consideration of the importance of traditional/indigenous health systems and whether their coexistence with the modern medical and health sub-sector would improve the equitability and accessibility of health care distribution, the health status of populations, and the social-economic development of nations within sub-Saharan Africa.[37]
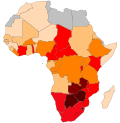
Map of Africa colored according to the percentage of the adult (ages 15–49) population with HIV/AIDS.[38]
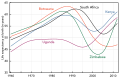
Life expectancy has fallen drastically in Southern Africa a result of HIV/AIDS.[39]
Speakers of Bantu languages (part of the Niger–Congo family) predominate in southern, central and southeast Africa. The Bantu farmers from West Africa's inland savanna progressively expanded over most of Africa.[40] But there are also several Nilotic groups in South Sudan and East Africa, the mixed Swahili people on the Swahili Coast, and a few remaining indigenous Khoisan (San and Khoikhoi) and Pygmy peoples in southern and central Africa, respectively. Bantu-speaking Africans also predominate in Gabon and Equatorial Guinea, and are found in parts of southern Cameroon. In the Kalahari Desert of Southern Africa, the distinct people known as the "San" have long been present. Together with the Khoikhoi, they form the Khoisan. The San are the pre-Bantu indigenous people of southern Africa, while Pygmies are the pre-Bantu indigenous African peoples of Central Africa.[41] The peoples of West Africa primarily speak Niger–Congo languages belonging mostly, though not exclusively, to its non-Bantu branches, though some Nilo-Saharan and Afroasiatic-speaking groups are also found. The Niger–Congo-speaking Yoruba, Igbo, Fulani, Akan and Wolof ethnic groups are the largest and most influential. In the central Sahara, Mandinka or Mande groups are most significant. Chadic-speaking groups, including the Hausa, are found in the more northerly parts of the region nearest to the Sahara and Nilo-Saharan communities such as the Kanuri,[42][43]Zarma[43] and Songhai[43][44] are present in eastern parts of West Africa bordering Central Africa.
The peoples of North Africa comprise three main groups: Berbers in the northwest, Egyptians and Libyans in northeast, and Nilo-Saharan-speaking peoples in the east. The Muslim settlers who arrived in the 7th century introduced the Arabic language and Islam to the region, initiating a process of linguistic Arabization of the region's inhabitants. The Semitic Phoenicians (who founded Carthage) and Hyksos, the Indo-Iranian Alans, the Indo-European Greeks, Romans and Vandals settled in North Africa as well. Berber-speaking populations still make significant communities within Morocco and Algeria and are still also present in smaller numbers in Tunisia and Libya.[45] The Berber-speaking Tuareg and other often-nomadic peoples are the principal inhabitants of the Saharan interior of North Africa. In Mauritania, there is a small Berber community and Niger–Congo-speaking peoples in the South, though in both regions Arabic and Arab culture predominates. In Sudan, although Arabic and Arab culture predominates, it is also inhabited by originally Nilo-Saharan-speaking groups such as the Nubians, Fur, Masalit and Zaghawa[46] who over the centuries have variously intermixed with migrants from the Arabian peninsula. Small communities of Afro-Asiatic-speaking Beja nomads can also be found in Egypt and Sudan.
In the Horn of Africa, Afro-Asiatic-speaking groups predominate. Ethiopian and Eritrean groups like the Amhara and Tigrayans (collectively known as Habesha) speak languages from the Semitic branch of Afro-Asiatic language family, while the Oromo and Somali speak languages from the Cushitic branch of Afro-Asiatic. In southern Ethiopia and Eritrea, Nilotic peoples related to those in South Sudan are also found, while Bantu and Khoisan ethnic minorities inhabit parts of southern Somalia.
Prior to the decolonization movements of the post-World War II era, Europeans were represented in every part of Africa.[47] Decolonisation during the 1960s and 1970s often resulted in the mass emigration of European-descended settlers out of Africa– especially from Algeria and Morocco (1.6 million pieds-noirs in North Africa),[48] Kenya, Congo,[49] Rhodesia, Mozambique and Angola.[50] By the end of 1977, more than one million Portuguese were thought to have returned from Africa.[51] Nevertheless, White Africans remain a minority in many African states, particularly South Africa, Zimbabwe, Namibia and Réunion.[52] The African country with the largest native European African population is South Africa.[53] The Afrikaners, the British diaspora and the Coloureds are the largest native European-descended groups in Africa today.
Native European colonization also brought sizable groups of Asians, particularly people from the Indian subcontinent, to British colonies. Large Indian communities are found in South Africa, and smaller ones are present in Kenya, Tanzania, and some other southern and East African countries. The large Indian community in Uganda was expelled by the dictator Idi Amin in 1972, though many have since returned. The islands in the Indian Ocean are also populated primarily by people of Asian origin, often mixed with Africans and Europeans. The Malagasy people of Madagascar are Austronesian people and native African people, but those along the coast are generally mixed with Bantu, Arab, Indian and European origins. Malay and Indian ancestries are also important components in the group of people known in South Africa as Cape Coloureds (people with origins in two or more races and continents). Beginning with the 21st century many Hispanics, primarily Mexicans, Central Americans, Chileans, Peruvians, and Colombians, have immigrated to Africa. Around 500,000 Hispanics have immigrated to Africa, most of whom live in South Africa, Kenya, Nigeria, Uganda, and Ghana. During the 20th century, small but economically important communities of Lebanese and Chinese[54] have also developed in the larger coastal cities of West and East Africa, respectively.[55]
The total number of languages natively spoken in Africa is variously estimated (depending on the delineation of language vs. dialect) at between 1,250 and 2,100,[56] and by some counts at "over 3,000",[57]Nigeria alone has over 500 languages (according to the count of SIL Ethnologue),[58]
Around a hundred languages are widely used for inter-ethnic communication. Arabic, Somali, Berber, Amharic, Oromo, Igbo, Swahili, Hausa, Manding, Fulani and Yoruba are spoken by tens of millions of people. Twelve dialect clusters (which may group up to a hundred linguistic varieties) are spoken by 75 percent, and fifteen by 85 percent, of Africans as a first or additional language.[59]
Niger–Congo is the largest phylum of African languages, with more than 500 million speakers (2017); it is dominated by the Bantu branch, spread throughout sub-Saharan Africa in the Bantu expansion, Bantu speakers accounting for about half of Niger–Congo speakers. Arabic is the most widely spoken single language in Africa by far, with a population of Arab Africa of the order of 330 million (2017). Other Afroasiatic languages are spoken by of the order of 100 million speakers in Africa (2017). Nilo-Saharan are spoken by of the order of 100 million speakers (2017). Khoisan groups a number of mostly endangered click languages, the largest being Khoekhoe with of the order of 300,000 speakers (2016).
↑Joseph J Bish, "Population growth in Africa: grasping the scale of the challenge", The Guardian, 11 January 2016. "African fertility has not fallen as expected. Precipitous declines in fertility in Asia and Latin America, from five children per woman in the 1970s to around 2.5 today, led many to believe Africa would follow a similar course. [...] Unfortunately, since the early 1990s, family planning programmes in Africa have not had the same attention [as in other parts of the world], resulting in slow, sometimes negligible, fertility declines. In a handful of countries, previous declines have stalled altogether and are reversing. [...] A few heroic efforts, such as Family Planning 2020, are attempting to stimulate family planning programmes across the continent, and there are some signs of success. Recent figures from Kenya and Zambia show substantial strengthening of contraceptive use among married women. In Kenya, 58% of married women now use modern contraception, and in Zambia this measure has risen from 33% to 45% in the last three years. In both cases, the catalysts for improvements were government commitment and commensurate budget financing. The virtuous circle may not be completely out of reach, but many more African governments must make haste and make substantial investments in contraceptive information and access for their people."
↑The world factbook 2006. United States Central Intelligence Agency. Dulles, Va.: Potomac. 2006. ISBN1574889974. OCLC64964412.{{cite book}}: CS1 maint: others (link)
↑Knippenberg, R.; Alihonou, E.; Soucat, A.; Oyegbite, K.; Calivis, M.; Hopwood, I.; Niimi, R.; Diallo, M. P.; Conde, M. (June 1997). "Implementation of the Bamako Initiative: strategies in Benin and Guinea". The International Journal of Health Planning and Management. 12 Suppl 1: S29–47. doi:10.1002/(SICI)1099-1751(199706)12:1+3.0.CO;2-U (inactive 16 October 2025). ISSN0749-6753. PMID10173105.{{cite journal}}: CS1 maint: DOI inactive as of October 2025 (link)
12Global report: UNAIDS report on the global AIDS epidemic: 2012. Joint United Nations Programme on HIV/AIDS. [Geneva]: UNAIDS. 2012. ISBN9789291735921. OCLC823635323.{{cite book}}: CS1 maint: others (link)
↑Verguet, Stéphane; Jassat, Waasila; Hedberg, Calle; Tollman, Stephen; Jamison, Dean T.; Hofman, Karen J. (21 February 2012). "Measles control in Sub-Saharan Africa: South Africa as a case study". Vaccine. 30 (9): 1594–1600. doi:10.1016/j.vaccine.2011.12.123. ISSN1873-2518. PMID22230581.
↑Naicker, Saraladevi; Plange-Rhule, Jacob; Tutt, Roger C.; Eastwood, John B. (2009). "Shortage of healthcare workers in developing countries--Africa". Ethnicity & Disease. 19 (1 Suppl 1): S1–60–4. ISSN1049-510X. PMID19484878.
↑Kofi-Tsekpo, Mawuli (2004). "Institutionalization of African traditional medicine in health care systems in Africa". African Journal of Health Sciences. 11 (1–2): i–ii. doi:10.4314/ajhs.v11i1.30772. ISSN1022-9272. PMID17298111.
↑John A. Shoup, Ethnic Groups of Africa and the Middle East (2011), p. 333, ISBN159884363X: "The Zaghawa is one of the major divisions of the Beri peoples who live in western Sudan and eastern Chad, and their language, also called Zaghawa, belongs to the Saharan branch of the Nilo-Saharan language group."
↑Heine, Bernd; Heine, Bernd, eds. (2000). African Languages: an Introduction. Cambridge University Press.
↑Epstein, Edmund L.; Kole, Robert, eds. (1998). The Language of African Literature. Africa World Press. p.ix. ISBN0-86543-534-0. Retrieved 23 June 2011. Africa is incredibly rich in language—over 3,000 indigenous languages by some counts, and many creoles, pidgins, and lingua francas.
This page is based on this Wikipedia article Text is available under the CC BY-SA 4.0 license; additional terms may apply. Images, videos and audio are available under their respective licenses.