Demographics of Mali

Last updated

Demographics of Mali
Mali single age population pyramid 2020.png
Population pyramid of Mali in 2020
Population20,741,769 (2022 est.)
Growth rate2.95% (2022 est.)
Birth rate41.07 births/1,000 population (2022 est.)
Death rate8.53 deaths/1,000 population (2022 est.)
Life expectancy62.41 years
  male60.19 years
  female64.7 years
Fertility rate5.54 children born/woman (2022 est.)
Infant mortality rate60.64 deaths/1,000 live births
Net migration rate-3.08 migrant(s)/1,000 population (2022 est.)
Age structure
0–14 years47.69%
65 and over3.02%
Nationality
NationalityMalian
Language
OfficialFrench

Demographic features of the population of Mali include population density, ethnicity, education level, health of the populace, economic status, religious affiliations and other aspects of the population.

Contents

Mali's population (1890-2021) Mali-demography.png
Mali's population (1890-2021)

Population

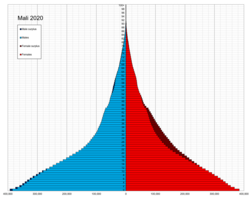
In 2021, Mali's population was an estimated 21.9 million [1] [2] , with an annual growth rate of 2.7%. [3] This figure can be compared to 4,638,000 in 1950. [4] The population is predominantly rural (68% in 2002), and 5–10% of Malians are nomadic. [5] More than 90% of the population lives in the southern part of the country, especially in Bamako, which has over 1 million residents. [5]

In 2007, about 48% of Malians were less than 15 years old, 49% were 15–64 years old, and 3% were 65 and older. [3] The median age was 15.9 years. [3] The birth rate in 2007 was 49.6 births per 1,000, and the total fertility rate was 7.4 children per woman. [3]

The death rate in 2007 was 16.5 deaths per 1,000. [3] Life expectancy at birth was 49.5 years total (47.6 for males and 51.5 for females). [3] Mali has one of the world's highest rates of infant mortality, [5] with 106 deaths per 1,000 live births. [3]

The proportion of the population aged below 15 in 2010 was 47.2%. [4] 50.6% of the population were aged between 15 and 65 years of age. 2.2% of the population were aged 65 years or older. [4]

Total populationPopulation aged 0–14 (%)Population aged 15–64 (%)Population aged 65+ (%)
19504 638 00038.958.32.8
19554 928 00040.157.42.5
19605 248 00040.557.22.3
19655 597 00041.556.22.3
19706 034 00042.355.22.4
19756 604 00043.354.12.6
19807 246 00044.652.62.8
19858 010 00045.851.32.9
19908 673 00047.549.53.0
19959 825 00047.449.92.8
200011 295 00047.250.32.5
200513 177 00047.150.62.3
201015 370 00047.250.62.2

Structure of the population

Population pyramid 2016 Bevolkerungspyramide Mali 2016.png
Population pyramid 2016

Structure of the population (Census 01.IV.2009): [6]

Age GroupMaleFemaleTotal%
Total7 204 9907 323 67214 528 662100
0-41 328 8711 294 5142 623 38518.06
5-91 202 8751 154 9482 357 82316.23
10-14918 866865 1381 784 00412.28
15-19732 526783 6201 516 14610.44
20-24529 535612 3681 141 9037.86
25-29449 099546 603995 7026.85
30-34385 003427 795812 7985.59
35-39325 005326 894651 9494.49
40-44271 239275 364546 6033.76
45-49228 626217 261445 8873.07
50-54189 424192 382381 8062.63
55-59148 594134 083282 6771.95
60-64127 557123 461251 0181.73
65-6988 29277 082165 3741.14
70-7467 31966 063133 3820.92
75-7940 90436 19777 1010.53
80+41 99243 60285 5940.59
unknown129 213146 297275 5101.90
Age groupMaleFemaleTotalPercent
0-143 450 6123 314 6006 765 21246.56
15-643 386 6583 639 8317 026 48948.36
65+238 507222 944461 4513.18

Population Estimates by Sex and Age Group (01.VII.2018) (Projections considering also the results of the 2009 Population Census.): [7]

Age GroupMaleFemaleTotal%
Total9 631 3769 786 72119 418 097100
0–41 824 7181 854 1493 678 86718.95
5–91 481 6101 505 5072 987 11715.38
10–141 235 7901 255 7222 491 51212.83
15–191 027 7441 044 3212 072 06510.67
20–24872 370886 4401 758 8109.06
25–29740 900752 8501 493 7507.69
30–34608 309618 1211 226 4306.32
35–39481 340489 104970 4445.00
40–44363 798369 665733 4633.78
45–49270 771275 138545 9092.81
50–54211 869215 287427 1562.20
55–59172 475175 257347 7311.79
60–64127 886129 949257 8351.33
65-69103 184104 848208 0331.07
70-7460 82861 809122 6370.63
75-7931 96432 47964 4430.33
80+15 82016 07531 8950.16
Age groupMaleFemaleTotalPercent
0–144 542 1184 615 3789 157 49647.16
15–644 877 4624 956 1329 833 59450.64
65+211 796215 211427 0072.20

Ethnic groups

A family in Djenne, Mali. Family trip.jpg
A family in Djenné, Mali.

Ethnic groups include: [8]

Mali's population consists of Sub-Saharan ethnic groups, sharing similar historic, cultural, and religious traditions. Exceptions are two nomadic northern groups, the Tuaregs, a Berber people, and Maurs (or Moors), of Arabo-Berber origins. In Mali and Niger, the Moors are also known as Azawagh Arabs, named after the Azawagh region of the Sahara. [9] Azawagh Arabs speak mainly Hassaniya Arabic which is one of the regional varieties of Arabic. [10]

The Tuaregs traditionally have opposed the central government. Starting in June 1990 in the north, Tuaregs seeking greater autonomy led to clashes with the military. In April 1992, the government and most opposing factions signed a pact to end the fighting and restore stability in the north. Its major aims are to allow greater autonomy to the north and increase government resource allocation to what has been a traditionally impoverished region. The peace agreement was celebrated in 1996 in Timbuktu during an official and highly publicized ceremony called "Flamme de la Paix"--(peace flame).

Historically, interethnic relations throughout the rest of the country were facilitated by easy mobility on the Niger River and across the country's vast savannahs. Each ethnic group was traditionally tied to a specific occupation, all working within proximity to each other, although the distinctions were often blurred.

The Bambara, Malinké, Sarakole, Dogon and Songhay are farmers; the Fula or Fulani, Maur, and Tuareg are herders, while the Bozo are fishers. In recent years this linkage has shifted considerably, as ethnic groups seek nontraditional sources of income.

Europeans in Mali

People of European origin form a small minority in the country. They include those of mixed European and African descendant, as well as those of full European background. The latter includes the French, as well as the Spanish, Irish, Italian and Portuguese origins. Some of them descend from the Arma people (1% of the nation's population). They mainly live in Bamako, Sikasso, Kalabancoro, Koutiala, Ségou, Kayes, Kati, Mopti, Niono, Gao, San, Koro, Bla, Bougouni, Mandé, Baguineda-Camp, Kolondiéba, Kolokani, and others. [11]

Vital statistics

Registration of vital events in Mali is not complete. The website Our World in Data prepared the following estimates based on statistics from the Population Department of the United Nations. [12]

Mid-year population (thousands)Live births (thousands)Deaths (thousands)Natural change (thousands)Crude birth rate (per 1000)Crude death rate (per 1000)Natural change (per 1000) Total fertility rate (TFR) Infant mortality (per 1000 live births) Life expectancy (in years)
19504 695  245  176  6952.237.514.76.96211.128.17
1951  4 760  247  178  6951.837.314.66.96210.228.29
1952  4 825  249  178  7051.536.914.66.95208.428.53
1953  4 888  250  179  7251.136.514.66.95206.928.76
1954  4 951  252  179  7350.836.114.76.94205.528.97
1955  5 015  254  180  7450.535.814.76.94204.329.13
1956  5 079  256  180  7650.435.514.96.94203.329.37
1957  5 145  259  182  7750.235.315.06.95202.529.47
1958  5 209  262  183  7950.235.115.16.95201.829.59
1959  5 275  267  185  8150.535.115.46.99201.229.65
1960  5 347  270  187  8350.535.015.57.00200.629.75
1961  5 420  274  189  8450.434.915.57.00200.029.83
1962  5 495  277  191  8650.434.815.67.02199.329.94
1963  5 570  281  193  8850.434.615.87.03198.430.15
1964  5 647  285  194  9150.434.316.17.05197.330.42
1965  5 726  290  195  9450.534.116.47.08195.830.62
1966  5 807  294  197  9750.633.916.77.10194.030.87
1967  5 888  299  198  10150.633.617.17.13191.831.21
1968  5 974  303  198  10550.733.117.57.15189.431.63
1969  6 062  306  199  10850.432.717.77.17186.932.05
1970  6 154  310  198  11250.432.218.27.18183.932.53
1971  6 248  315  199  11650.431.818.67.20181.332.94
1972  6 347  320  196  12450.330.819.57.20177.833.86
1973  6 455  326  195  13150.430.220.37.21174.834.57
1974  6 569  332  193  13950.429.321.17.23171.935.43
1975  6 687  338  192  14650.528.621.97.24169.036.23
1976  6 808  344  189  15550.427.722.77.25165.537.20
1977  6 935  350  187  16350.426.923.57.28162.038.11
1978  7 073  357  185  17250.426.124.37.30158.539.06
1979  7 218  365  183  18250.525.325.27.32155.039.95
1980  7 373  372  182  19050.324.725.77.33151.540.75
1981  7 533  379  183  19550.124.325.97.32148.241.22
1982  7 696  383  183  20049.623.725.97.27144.641.82
1983  7 864  387  184  20449.123.325.87.23141.242.14
1984  8 030  394  183  21048.922.826.17.22138.042.70
1985  8 188  399  183  21648.522.326.27.21134.943.21
1986  8 335  405  181  22448.321.626.77.24131.743.98
1987  8 474  408  179  22947.821.026.97.25128.944.69
1988  8 617  413  176  23747.720.427.37.26126.345.39
1989  8 774  416  176  24147.219.927.37.28123.845.88
1990  8 945  419  173  24646.719.327.47.25121.846.62
1991  9 124  430  172  25847.018.828.27.23119.847.22
1992  9 311  437  173  26346.718.528.27.18118.147.50
1993  9 507  443  174  26946.418.328.17.12116.547.73
1994  9 712  452  177  27546.418.228.27.07115.247.74
1995  9 921  455  179  27545.718.027.76.99113.647.82
1996  10 132  464  182  28245.717.927.86.95112.147.79
1997  10 359  477  180  29745.917.428.66.91110.048.53
1998  10 620  492  180  31246.216.929.36.89107.949.16
1999  10 917  513  180  33347.016.530.56.88105.549.80
2000  11 239  530  180  35047.116.031.16.87102.850.54
2001  11 584  549  180  36947.315.531.86.85100.051.28
2002  11 953  568  178  39047.514.932.66.8297.152.22
2003  12 342  588  178  41047.614.433.26.7894.252.89
2004  12 752  611  179  43247.914.033.96.7491.453.54
2005  13 181  633  180  45348.013.734.36.7288.754.00
2006  13 624  649  180  46947.613.234.46.6986.254.62
2007  14 081  666  182  48447.312.934.46.6683.754.94
2008  14 551  684  184  50147.012.634.46.6481.255.29
2009  15 033  705  183  52146.812.234.66.6178.855.87
2010  15 529  724  184  54146.611.834.86.5876.556.38
2011  16 040  743  185  55846.211.534.76.5574.256.76
2012  16 515  762  186  57645.911.234.76.5272.057.08
2013  17 004  771  186  58545.310.934.36.4970.057.36
2014  17 552  788  185  60244.810.534.26.4467.857.90
2015  18 113  804  185  61944.310.234.16.3965.858.36
2016  18 700  820  186  63443.89.933.96.3263.958.73
2017  19 311  839  186  65243.49.633.76.2562.159.13
2018  19 934  856  188  66842.99.433.56.1860.459.39
2019  20 567  873  190  68342.49.233.26.1058.759.66
2020  21 224  892  202  68942.09.532.56.0457.158.63
2021  21 905  913  203  71041.69.332.45.9655.458.94

Fertility and Births

Total Fertility Rate (TFR) (Wanted Fertility Rate) and Crude Birth Rate (CBR): [13]

YearCBR (Total)TFR (Total)CBR (Urban)TFR (Urban)CBR (Rural)TFR (Rural)
1981-19837.106.857.17
1984-19866.736.096.97
1995-199645.16.7 (6.0)39.95.4 (4.8)47.27.3 (6.6)
200145.16.8 (6.1)42.15.5 (4.8)45.97.3 (6.6)
200645.26.6 (6.0)41.85.4 (5.1)46.67.2 (6.5)
2012-201338.86.1 (5.3)36.75.0 (4.3)39.26.5 (5.6)
201840.96.3 (5.5)36.34.9 (4.2)42.36.8 (6.0)

Fertility data as of 2012-2013 (DHS Program): [14]

RegionTotal fertility ratePercentage of women age 15-49 currently pregnantMean number of children ever born to women age 40-49
Kayes 6.011.36.0
Koulikoro 6.014.35.8
Sikasso 6.611.56.2
Ségou 6.112.26.1
Mopti 6.511.75.9
Bamako 5.16.55.1

Immigration and emigration

Mali had an estimated net migration rate of –6.6 migrants per 1,000 people in 2006. [15] About 3 million Malians are believed to reside in Côte d'Ivoire and France. Conversely, according to a 2003 estimate, Mali hosts about 11,000 Mauritanians; most are Fulani herders who routinely engage in cross-border migration. In addition, there are several thousand refugees from Côte d'Ivoire, Sierra Leone, and Liberia in Bamako and other urban areas of Mali. [5]

Demographic statistics

Demographic statistics according to the World Population Review in 2022. [16]

The following demographic are from the CIA World Factbook [17] unless otherwise indicated.

Population

20,741,769 (2022 est.)
18,429,893 (July 2018 est.)

Religions

Muslim 93.9%, Christian 2.8%, animist 0.7%, none 2.5% (2018 est.)

Age structure

Population pyramid of Mali in 2020 Mali single age population pyramid 2020.png
Population pyramid of Mali in 2020
0-14 years: 47.69% (male 4,689,121/female 4,636,685)
15-24 years: 19% (male 1,768,772/female 1,945,582)
25-54 years: 26.61% (male 2,395,566/female 2,806,830)
55-64 years: 3.68% (male 367,710/female 352,170)
65 years and over: 3.02% (male 293,560/female 297,401) (2020 est.)
0-14 years: 48.03% (male 4,449,790 /female 4,402,076)
15-24 years: 18.89% (male 1,657,609 /female 1,823,453)
25-54 years: 26.36% (male 2,243,158 /female 2,615,695)
55-64 years: 3.7% (male 346,003 /female 335,733)
65 years and over: 3.02% (male 277,834 /female 278,542) (2018 est.)

Birth rate

41.07 births/1,000 population (2022 est.) Country comparison to the world: 4th
43.2 births/1,000 population (2018 est.) Country comparison to the world: 3rd

Death rate

8.3 deaths/1,000 population (2023 est.) Country comparison to the world: 79th
8.53 deaths/1,000 population (2022 est.) Country comparison to the world: 73rd
9.6 deaths/1,000 population (2018 est.) Country comparison to the world: 45th

Total fertility rate

5.45 children born/woman (2023 est.) Country comparison to the world: 4th
5.54 children born/woman (2022 est.) Country comparison to the world: 4th
5.9 children born/woman (2018 est.) Country comparison to the world: 5th

Population growth rate

2.95% (2022 est.) Country comparison to the world: 11th
2.98% (2018 est.) Country comparison to the world: 8th

Median age

total: 16 years. Country comparison to the world: 224th
male: 15.3 years
female: 16.7 years (2020 est.)
total: 15.8 years. Country comparison to the world: 127th
male: 15.2 years
female: 16.5 years (2018 est.)

Mother's mean age at first birth

19.2 years (2018 est.)
note: median age at first birth among women 20-49
18.8 years (2012/13 est.)
note: median age at first birth among women 25-29

Contraceptive prevalence rate

17.2% (2018)
15.6% (2015)

Net migration rate

-3.08 migrant(s)/1,000 population (2022 est.) Country comparison to the world: 181st
-3.9 migrant(s)/1,000 population (2017 est.) Country comparison to the world: 181st

Dependency ratios

total dependency ratio: 101.9 (2015 est.)
youth dependency ratio: 96.8 (2015 est.)
elderly dependency ratio: 5.1 (2015 est.)
potential support ratio: 19.5 (2015 est.)

Urbanization

urban population: 45.4% of total population (2022)
rate of urbanization: 4.57% annual rate of change (2020-25 est.)
urban population: 42.4% of total population (2018)
rate of urbanization: 4.86% annual rate of change (2015-20 est.)

Life expectancy at birth

total population: 62.41 years. Country comparison to the world: 211st
male: 60.19 years
female: 64.7 years (2022 est.)
total population: 60.8 years (2018 est.)
male: 58.6 years (2018 est.)
female: 63 years (2018 est.)

Major infectious diseases

degree of risk: very high (2020)
food or waterborne diseases: bacterial and protozoal diarrhea, hepatitis A, and typhoid fever
vectorborne diseases: malaria and dengue fever
water contact diseases: schistosomiasis
animal contact diseases: rabies
respiratory diseases: meningococcal meningitis

Education expenditures

3.4% of GDP (2019) Country comparison to the world: 131st

Literacy

definition: age 15 and over can read and write (2015 est.)

total population: 35.5%
male: 46.2%
female: 25.7% (2018)
total population: 33.1% (2015 est.)
male: 45.1% (2015 est.)
female: 22.2% (2015 est.)

School life expectancy (primary to tertiary education)

total: 7 years
male: 8 years
female: 7 years (2017)

Unemployment, youth ages 15-24

total: 2.4%
male: 2.6%
female: 2.3% (2018 est.)

Languages

Although each ethnic group speaks a separate language, nearly 80% of Malians communicate over ethnic borders in Bambara, which is the common language of the marketplace. French is the country's official language and is spoken somewhat by 30% of Malians.

Religion

An estimated 95% of Malians are Sunni Muslim, 4% adhere to indigenous or traditional animist beliefs, and 1% are Christian (about two-thirds Roman Catholic and one-third Protestant). [18] [3] [5] Atheism and agnosticism are believed to be rare among Malians, most of whom practice their religion on a daily basis. [5] Islam as practiced in Mali can be moderate, tolerant, and adapted to local conditions; relations between Muslims and practitioners of minority religious faiths are generally amicable. [5] The constitution establishes a secular state and provides for freedom of religion. [19]

Health

Life expectancy in Mali Life expenctancy in Mali.svg
Life expectancy in Mali

Mali's health and development indicators rank among the worst in the world. In 2000 only 62–65 percent of the population was estimated to have access to safe drinking water and only 69 percent to sanitation services of some kind; only 8 percent was estimated to have access to modern sanitation facilities. Only 20 percent of the nation’s villages and livestock watering holes had modern water facilities. [5]

There were an estimated 140,000 cases of human immunodeficiency virus/acquired immune deficiency syndrome (HIV/AIDS) reported in 2003, and an estimated 1.9 percent of the adult population was afflicted with HIV/AIDS that year, among the lowest rates in Sub-Saharan Africa (see also HIV/AIDS in Africa). [5] In the same year, there were 12,000 AIDS deaths. The infant mortality rate is 69.5 deaths/1,000 live births (75.3/1,000 among males and 63.5/1,000 among females) (2017 est.). Life expectancy at birth is 60.3 years (58.2 years among males and 62.5 years among females) (2017 est.).

Life expectancy

PeriodLife expectancy in
Years [20]
1950–195526.96
1955–1960Increase2.svg 27.98
1960–1965Increase2.svg 28.61
1965–1970Increase2.svg 30.79
1970–1975Increase2.svg 34.20
1975–1980Increase2.svg 37.71
1980–1985Increase2.svg 41.55
1985–1990Increase2.svg 44.51
1990–1995Increase2.svg 46.57
1995–2000Increase2.svg 46.75
2000–2005Increase2.svg 49.96
2005–2010Increase2.svg 54.03
2010–2015Increase2.svg 56.24

Education

In the 2000–01 school year, the primary school enrollment rate was 61% (71% of males and 51% of females). The primary school completion rate is also low: only 36 percent of students in 2003 (and lower for females). The majority of students reportedly leave school by age 12. In the late 1990s, the secondary school enrollment rate was 15% percent (20% of males and 10% of females). [5]

According to United States government estimates, the adult literacy rate (defined as those over age 15 who can read and write) was 46.4 percent for the total population in 2003 (53.5 percent for males and 39.6 percent for females). According to United Nations sources, however, the literacy rate is actually much lower—only 27–30 percent overall and as low as 12 percent for females, among the lowest rates in Africa.

Related Research Articles

<span class="mw-page-title-main">Demographics of Angola</span>

Demographic features of the population of Angola include population density, ethnicity, education level, health of the populace, economic status, religious affiliations and other aspects.

<span class="mw-page-title-main">Demographics of Burkina Faso</span>

Burkina Faso's 22.1 million people belong to two major West African cultural groups: the Gur (Voltaic) and the Mandé. The Voltaic are far more numerous and include the Mossi, who make up about one-half of the population. The Mossi claim descent from warriors who migrated to present-day Burkina Faso and established an empire that lasted more than 800 years. Predominantly farmers, the Mossi are still bound by the traditions of the Mogho Naba, who hold court in Ouagadougou.

<span class="mw-page-title-main">Demographics of Burundi</span>

Demographic features of the population of Burundi include population density, ethnicity, education level, health of the populace, economic status, religious affiliations and other aspects.

<span class="mw-page-title-main">Demographics of Cameroon</span>

The demographic profile of Cameroon is complex for a country of its population. Cameroon comprises an estimated 250 distinct ethnic groups, which may be formed into five large regional-cultural divisions:

<span class="mw-page-title-main">Demographics of Ivory Coast</span>

Demographic features of the population of Ivory Coast include population density, ethnicity, education level, health of the populace, economic status, religious affiliations and other aspects of the population.

<span class="mw-page-title-main">Demographics of the Comoros</span>

The Comorians inhabiting Grande Comore, Anjouan, and Mohéli share African-Arab origins. Islam is the dominant religion, and Quranic schools for children reinforce its influence. Although Islamic culture is firmly established throughout, a small minority are Christian.

<span class="mw-page-title-main">Demographics of the Democratic Republic of the Congo</span>

Demographic features of the population of the Democratic Republic of the Congo include ethnicity, education level, health, economic status, religious affiliations and other aspects of the population.

This is a demography of the population of Dominica including population density, ethnicity, religious affiliations and other aspects of the population.

<span class="mw-page-title-main">Demographics of Ethiopia</span>

The demographics of Ethiopia encompass the demographic features of inhabitants in Ethiopia, including ethnicity, languages, population density, education level, health, economic status, religious affiliations and other aspects of the population.

<span class="mw-page-title-main">Demographics of Lesotho</span>

Demographic features of the population of Lesotho include population density, ethnicity, education level, health of the populace, economic status, religious affiliations and other aspects.

<span class="mw-page-title-main">Demographics of Liberia</span>

As of 2006, Liberia had the highest population growth rate in the world. This has declined since, however, and stood at 2.37 percent in 2023.

<span class="mw-page-title-main">Demographics of Mauritius</span> Demographics of Mauritius

Mauritian society incorporates several ethnic and multi-ethnic groups. A majority of the republic's residents are descendants of people from India. Mauritius also comprises migrants from continental Africa, China, France, and the East African island of Madagascar. As of 2023, Mauritius now has the highest population density in Africa.

<span class="mw-page-title-main">Demographics of Niger</span>

The demographic features of Nigeriens, the people of Niger consist of population density, ethnicity, education level, health of the populace, economic status, religious affiliations and other aspects of the population.

<span class="mw-page-title-main">Demographics of Rwanda</span>

Demographic features of the population of Rwanda include population density, ethnicity, education higher level, health of the populace, economic status, religious affiliations and other aspects.

<span class="mw-page-title-main">Demographics of Seychelles</span>

Demographic features of the population of Seychelles include population density, ethnicity, education level, health of the populace, economic status, religious affiliations and other aspects of the population.

<span class="mw-page-title-main">Demographics of Tanzania</span>

Demographic features of the population of Tanzania include population density, ethnicity, education level, health of the populace, economic status, religious affiliations, and other aspects of the population.

<span class="mw-page-title-main">Demographics of Uganda</span> Aspect of human geography in Uganda

Demographic features of the population of Uganda include population density, ethnicity, education level, health of the populace, economic status, religious affiliations and others.

<span class="mw-page-title-main">Demographics of the Bahamas</span>

This is a demography of the population of The Bahamas including population density, ethnicity, education level, health of the populace, economic status, religious affiliations and other aspects of the population.

<span class="mw-page-title-main">Demographics of Benin</span>

The demographics of Benin include population density, ethnicity, education level, health of the populace, economic status, religious affiliations and other aspects of the population.

<span class="mw-page-title-main">Demographics of the Gambia</span> Demographics of the West African country

The demographic characteristics of the population of The Gambia are known through national censuses, conducted in ten-year intervals and analyzed by The Gambian Bureau of Statistics (GBOS) since 1963. The latest census was conducted in 2013. The population of The Gambia at the 2013 census was 1.8 million. The population density is 176.1 per square kilometer, and the overall life expectancy in The Gambia is 64.1 years. Since the first census of 1963, the population of The Gambia has increased every ten years by an average of 43.2 percent. Since 1950s, the birth rate has constantly exceeded the death rate; the natural growth rate is positive. The Gambia is in the second stage of demographic transition. In terms of age structure, The Gambia is dominated by 15- to 24-year-old segment (57.6%). The median age of the population is 19.9 years, and the gender ratio of the total population is 0.98 males per female.

References

  1. "World Population Prospects 2022". United Nations Department of Economic and Social Affairs, Population Division. Retrieved July 17, 2022.
  2. "World Population Prospects 2022: Demographic indicators by region, subregion and country, annually for 1950-2100" (XSLX) ("Total Population, as of 1 July (thousands)"). United Nations Department of Economic and Social Affairs, Population Division. Retrieved July 17, 2022.
  3. 1 2 3 4 5 6 7 8 CIA world factbook.
  4. 1 2 3 Population Division of the Department of Economic and Social Affairs of the United Nations Secretariat, World Population Prospects: The 2010 Revision Archived May 6, 2011, at the Wayback Machine
  5. 1 2 3 4 5 6 7 8 9 10 Mali country profile. Library of Congress Federal Research Division (January 2005). This article incorporates text from this source, which is in the public domain.
  6. "United Nations Statistics Division - Demographic and Social Statistics". unstats.un.org. Retrieved 2017-08-27.
  7. "UNSD — Demographic and Social Statistics".
  8. "Africa :: MALI". CIA The World Factbook. 19 April 2022.
  9. For an introduction to the culture of the Azawagh Arabs, see Rebecca Popenoe, Feeding Desire — Fatness, Beauty and Sexuality among a Saharan People. Routledge, London (2003) ISBN   0-415-28096-6
  10. Popenoe (2003), p. 16-17.
  11. Fage, J. D.; Oliver, Roland Anthony (1975). The Cambridge History of Africa. Cambridge University Press. ISBN   9780521204132.
  12. "Population & Demography Data Explorer". Our World in Data. Retrieved 2022-07-22.
  13. "MEASURE DHS: Demographic and Health Surveys". microdata.worldbank.org. Retrieved 2017-08-27.
  14. "Enquête Démographique et de Santé (EDSM-V) 2012-2013" (PDF). Mali Enquête Démographique et de Santé (EDSM-V).
  15. CIA factbook
  16. "Mali Population 2022", World Population Review
  17. PD-icon.svg This article incorporates public domain material from "Mali". The World Factbook (2024 ed.). CIA. 2018. Retrieved 27 September 2022.  (Archived 2018 edition)
  18. US State Dept 2022 report
  19. US State Dept 2022 report
  20. "World Population Prospects - Population Division - United Nations". esa.un.org. Retrieved 2018-08-26.

Further reading